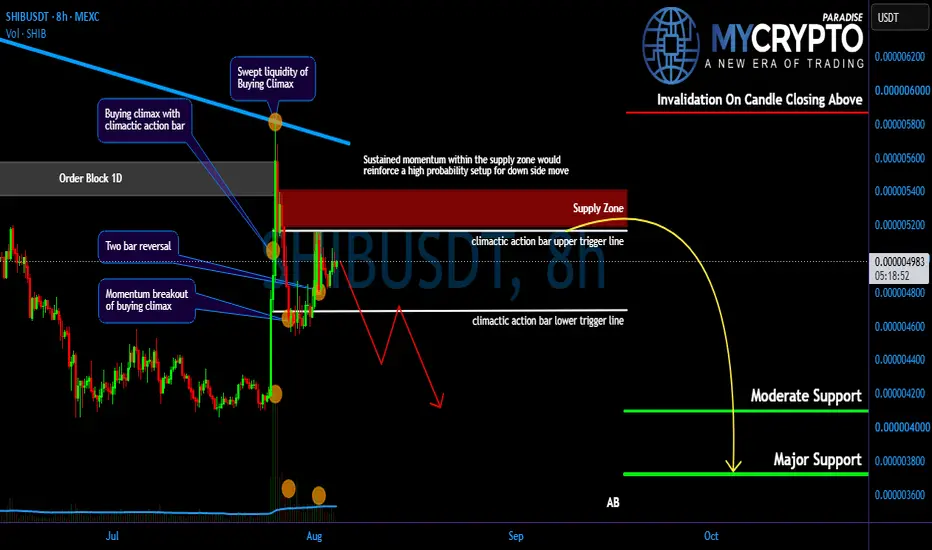
SHIB Rejection: Is the Next Move Lower…!Yello Paradisers, is #SHIB latest rejection shows that the recent recovery is already running out of strength? Although the move may still look like a normal pullback to many traders, the broader structure, resistance reaction, supply pressure, and Volume Spread Analysis suggest that the market may be preparing for another bearish phase.
💎#SHIB has clearly respected the descending resistance trend-line and failed to break above it. This rejection is a key probability of ongoing structural weakn
Shibanalysis
SHIB Trap - Smart Money May Be Preparing a Sharp Drop…!Yello Paradisers! Are you prepared for a potential sharp downside move on #SHIB, or are you still calling this “just a healthy pullback” while smart money quietly distributes above you? At first glance, the structure may look harmless. But when we remove emotions and read the chart objectively, the story changes completely. This is not a random retracement. This is a high-risk zone where discipline matters more than opinions.
💎#SHIB has clearly respected the descending resistance trend-line and
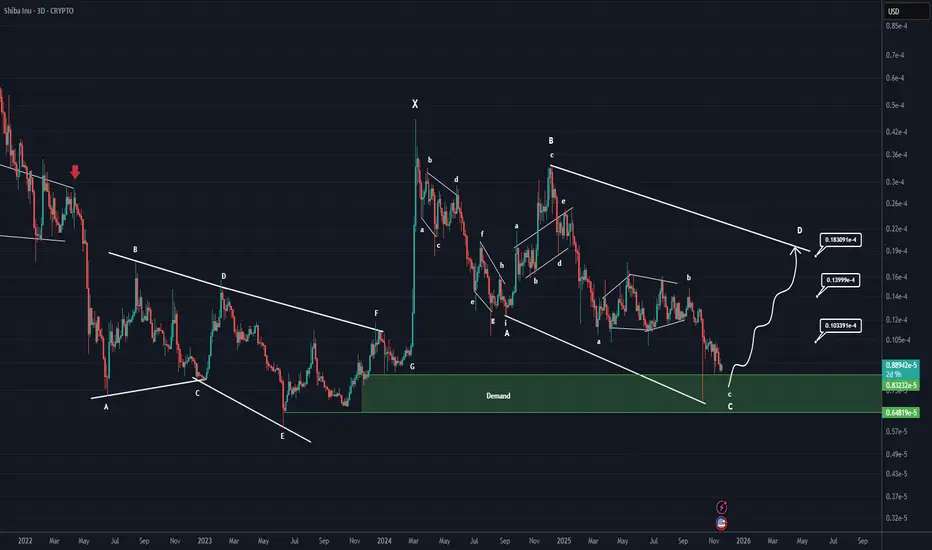
SHIBA Inu Analysis (3D)Shiba Inu is completing a very large correction across higher degrees and larger time frames.
It appears to be in a double or multiple correction, currently in the second phase. This phase itself is a complex correction, and it is now finishing wave C of this complex corrective structure.
The green zone is where Shiba can enter wave D in the higher time frames | a bullish wave.
Remember, we do not make decisions based on emotions; we analyze based on signals and indications.
For risk managem
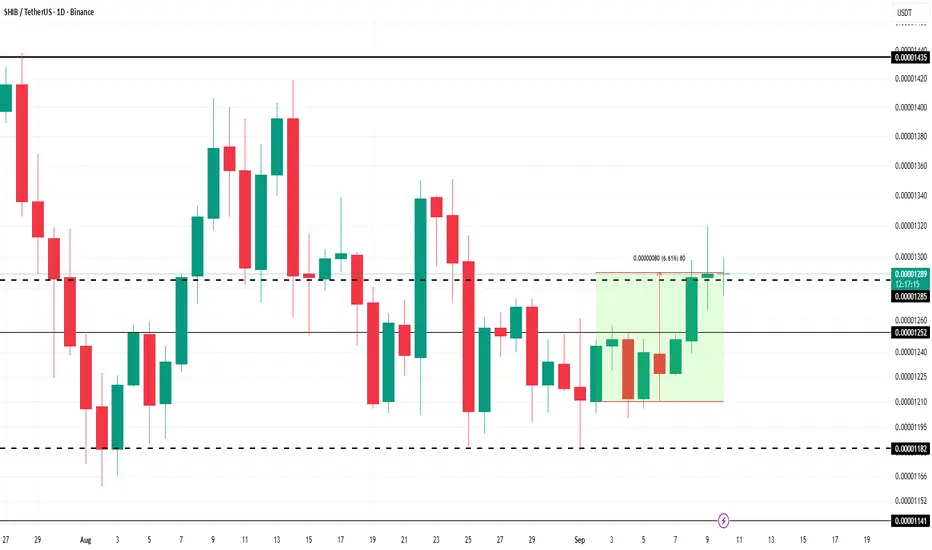
Shiba Inu Sees Heavy Selling at 3-Week Price PeakShiba Inu is up 6.69% in the past week, with the token trading at $0.00001291. The meme coin is attempting to establish $0.00001285 as a support level, holding near its recent peak.
However, maintaining this momentum appears difficult without strong investor conviction. If selling continues, SHIB could drop toward $0.00001252 or even lower to $0.00001182, erasing recent gains.
On the flip side, if Shiba Inu price successfully defends the $0.00001285 support, a rebound may follow. In that case,
SHIB New Update/Roadmap (3D)The correction for this coin started from the point where we placed the red arrow on the chart.
The price appears to be inside a Triangle or Diametric, nearing the end of wave D.
The green zone is a low-risk rebuy area.
There is a liquidity pool on the chart, which we expect to be swept soon.
Targets are marked on the chart.
A weekly candle close below the invalidation level will invalidate this analysis
For risk management, please don't forget stop loss and capital management
When we reach
shib/usd updated scenarios !!!shiba inu 2 scenarios predictions, trump tarris coming out for every country this week so it will create a lot of volatility everywhere! stay firm and keep adding our ecosystem will improve how government use crypto !!! united arabs already on board! so a lot of mix news.... any thoughts???
Shiba Inu AnalysisShiba Inu Analysis
Shiba Inu has recently experienced a downtrend, breaking through a significant support level. Currently, it appears to be retesting this level; however, this remains unconfirmed until the candle closes.
In my view, it would be prudent to await the closure of the current candle before contemplating a short position. I also believe that the pair is still aligned with the broader downward trend and has yet to complete its downward movement.
I would be interested in hearin
Shiba Inu have a tp@ 0.0003$ !!!"As cryptocurrencies continue to rise, Shiba Inu is getting ready for takeoff. The cup pattern on the weekly timeframe, along with the beautiful FTR, indicates that a rise is imminent. The target could easily be between 0.00015 and 0.0003. I hope you have this strange, old, and controversial meme coin in your portfolio."
SHIBUSDT.1DAnalyzing the SHIB/USDT daily chart, it's clear that the market has shown a mixture of explosive growth followed by a sharp decline, which is typical for volatile assets like SHIB. Let's dive deeper into the key technical indicators and the support and resistance levels to get a clearer picture of potential market movements.
Support and Resistance Levels:
Support Level 1 (S1) at $0.00000549, which the price is currently testing. This level is crucial as it has previously acted as a floor, prev
SHIBUSDT.1DIn my technical analysis of the SHIB/USDT daily chart on Binance, I focus on the trend behaviors and key indicators that could provide insights into future price actions.
The chart reveals a volatile journey for SHIB/USDT, particularly noticeable in the sharp spike and subsequent fall during early 2024, characterized by point A on the chart. This volatility has since tapered into a descending triangle pattern, indicating a potential continuation or reversal could be forthcoming.
Firstly, let's
SHIBUSDT.1DUpon analyzing the daily chart for SHIB/USDT, I have identified several critical elements that provide insight into the current market condition and potential future price movements.
Technical Analysis Observations:
Support and Resistance Levels (S1, R1, R2):
Support Level 1 (S1): At approximately $0.00001057, this level has been a significant support zone. It marks a crucial floor that, if breached, could signal further declines.
Resistance Level 1 (R1): Positioned at $0.00002019, this is th
SHIBUSDT.1DThe SHIB/USDT pair, as shown on the daily chart, trades at $0.00001655, demonstrating a significant bearish trend with a recent decline in value by approximately 5.59%. The trading environment has been largely bearish over the past months, following a failed breakout above earlier resistance levels.
Key Support and Resistance Levels:
Resistance 1 (R1): $0.00002155 - This level marks a recent high that SHIB failed to surpass, forming a clear resistance zone.
Support 1 (S1): $0.00001413 - This i
SHIBUSDT.1DIn this technical analysis of the SHIB/USDT daily chart, we explore the recent price movements and use key technical indicators to forecast potential future trends.
Key Observations:
Current Price and Recent Movement:
SHIB/USDT is trading at a price of $0.00001854, showing a moderate increase of 2.49% today. This suggests a possible change in market sentiment or response to external stimuli.
Support and Resistance Levels:
R1 (Resistance Level 1): $0.00001825 - It's noteworthy that the current
SHIBUSDT.1DThe SHIB/USDT daily chart indicates a significant downtrend with the price closing in on the support level (S1) at 0.00001599. If the price breaches this level, it might signal further declines.
The resistance levels (R2) sit far above the current price at 0.00003357, suggesting that the asset has room to recover if the momentum shifts. However, the current market structure would require a strong bullish reversal to reach these heights again.
The RSI is approaching the oversold territory at 28
Cryptolean Shiba Inu SHIB Update Shiba Inu found a support at $0.00002399-$0.00002509, the key daily support zone.
A bullish reversal from this zone is likely, assuming we see back bullishness in BTC, and will result in a move to re-test $0.00003107.
A bearish break-out of $0.00002399-$0.00002509 will push SHIB price lower towards $0.00001911.
Intraday Chart
The SHIBUSD 4-Hour chart is bearish and moving to the key intraday resistance at $0.00002814.
(1) A bearish rejection of $0.00002814 or (2
SHIBUSDT.1DBased on the provided market data, SHIB is currently trading at 2192 USDT. The Relative Strength Index (RSI) is an indicator that measures the speed and change of price movements. An RSI above 70 typically indicates that the asset may be overbought, suggesting a bearish price movement in the future. The RSI for SHIB is 76.99 for 4 hours, 100.04 for 1 day, and 86.34 for 7 days, suggesting that the asset is currently overbought.
The Moving Average Convergence Divergence (MACD) is a trend-followin
SHIB (Shiba Inu) Technical Analysis & Short Trade SetupSHIBA INU has been experiencing significant selling pressure, compromising its previous bullish trend and indicating a potential reversal. The 50% Fibonacci retracement level presents a logical entry point for a short position. As the market seeks liquidity, price action could target previous swing lows. Consider initiating a short position on #SHIB at the 50% Fibonacci retracement level with targets at previous swing lows, employing a strict stop-loss above the recent swing high.
Important Di
SHIBUSDT.1DBased on the market data provided, the SHIB/USDT pair is currently trading at 97.0. The Relative Strength Index (RSI) over a 4-hour, 1-day, and 7-day period are 58.81, 60.11, and 55.90 respectively. These figures suggest that the pair is neither overbought nor oversold in the short, medium, and long-term.
The Moving Average Convergence Divergence (MACD) for the 4-hour, 1-day, and 7-day periods are 2.0, 12.0, and 23.0 respectively. This indicates a bullish trend in the short, medium, and long-te
#SHIB → Waiting for the corner pattern to breakIt has a corrective structure in daily and H4 time frames. In a support strip with a corner pattern, it can have two movement paths. If the blue bar is formed by one or more confirmation candles, it can break the dynamic resistance trigger and have a temporary rise to the specified supply area. Otherwise, with the failure from the bottom and confirmation below the blue band, there will be a possibility of continuing the correction to the previous floor.
-----------------
Please support this idea
S
SHIBA INU Trade IdeaSHIBA INU has faced downward pressure and is evidently in a downtrend as we can see on this 4H time frame. We are exploring the Fibonacci retracement levels of 50-61.8% to pinpoint a potential entry point for a short position. It's important to note that this trade idea is purely speculative and not intended as a trade signal. This information should be viewed strictly for educational purposes and not construed as financial advice.
$SHIB - Up or down? Bias leans up.This chart is a tossup for me. However, I lean bullish here.
To me, it looks like CRYPTOCAP:SHIB has 1 more leg higher to go before turning bearish over the short term.
As you can see on the chart, price has held that bullish trend line. RSI is completely bottomed out on lower timeframes which to me indicates a move higher needs to happen before price can fall lower here.
I lean towards a move higher to that $.00001074 area to mark off a high on the short term.
The bearish scenario would b