Trade the Range with BABAAlthough the technicals for BABA seem to be bearish, we don't have a lot of conviction.
BABA is trading at $178.49, at the moment.
We will find resistance from levels from above including the following:
178.90 from volume profile over the past 14 periods
179.53 from volume profile over the past 14 periods
180.38 from volume profile over the past 14 periods
181.95 from gaps
182.38 from volume profile over the past 14 periods
182.90 from gaps
183.54 from volume profile over the past 14 periods
183.96 from gaps
184.51 from volume profile over the past 30 periods
185.46 from sma 50
Levels from below will provide support, including:
177.00 from gaps
176.20 from gaps
174.79 from gaps
174.20 from gaps
173.85 from gaps
172.41 from gaps
172.05 from gaps
171.29 from gaps
170.77 from gaps
169.85 from gaps
Technical analysis for BABA is as follows. Volatility is higher than usual, but still has room to go. The RSI is 48, indicating that we are in a bear trend, but not yet oversold. The MACD is above the signal line, but not to an extreme. This suggests we may have more room to appreciate. The 50 period SMA indicates that we are in a bear trend. Additionally, BABA is below the 100 period SMA, which indicates a bear trend, but not oversold yet. Finally, the 50 period SMA is below the 100 period SMA, which is a longer term confirmation of bearishness. The ADX does not indicate a trend, i.e. we are ranging.
Sma

AAPL Extremely Bullish, Don't Buy on FOMO!AAPL shows multiple signs of a strong bull trend. Be careful when looking to buy lest you get caught in a retracement.
At the time of this writing, AAPL was trading at $222.98.
We will find resistance from levels from above including:
222.99 from volume profile over the past 14 periods
223.49 from highs and lows over the past 14 periods
We will find support from levels from below including the following:
222.48 from volume profile over the past 14 periods
221.89 from volume profile over the past 14 periods
220.55 from volume profile over the past 14 periods
219.20 from volume profile over the past 14 periods
218.70 from volume profile over the past 14 periods
218.02 from volume profile over the past 14 periods
217.10 from volume profile over the past 14 periods
216.43 from volume profile over the past 14 periods
215.40 from volume profile over the past 30 periods
213.85 from volume profile over the past 30 periods
Lets look at some technical analysis for AAPL. Volatility has narrowed a bit, but may continue more before a breakout. The RSI is 81, indicating that we are overbought. A bear pullback or trend reversal can be expected. The MACD is above the signal line, but not by too much, suggesting that we are in a bull trend which may continue. We are well above the 50 period SMA, which suggests that we are overbought. Also, AAPL is above the 100 period SMA by quite a bit, suggesting that we are overbought. Finally, the 50 period SMA is above the 100 period SMA, indicating longer term bullish confirmation. The ADX indicator reads 68, which is indicative of a strong bull trend.

MU Somewhat BearishMU shows bearish signs, but they're not overwhelmingly strong. Read further for more technical analysis.
At the time of this writing, MU was trading at $51.83.
Levels from above will provide resistance, including:
51.98 from volume profile over the past 14 periods
52.09 from volume profile over the past 14 periods
52.36 from gaps
52.80 from gaps
53.21 from gaps
54.17 from gaps
54.58 from gaps
54.83 from gaps
55.48 from gaps
55.64 from gaps
We will find support from levels from below including:
51.80 from volume profile over the past 14 periods
51.51 from volume profile over the past 14 periods
51.33 from volume profile over the past 14 periods
51.17 from gaps
51.03 from gaps
50.82 from gaps
50.68 from volume profile over the past 14 periods
50.39 from volume profile over the past 14 periods
50.25 from volume profile over the past 14 periods
50.01 from gaps
Lets look at some technical analysis for MU. Volatility has consolidated quite a bit, expect a breakout soon. The RSI is 51, indicating that we are in a bull trend, but not yet overbought. The MACD is above the signal line, but not to an extreme. This suggests we may have more room to appreciate. MU is below the 50 period SMA, which indicates a bear trend, but not oversold yet. The 100 period SMA indicates that we are in a bear trend. Finally, the 50 period SMA is below the 100 period SMA, indicating longer term bearish confirmation. The ADX indicator, 7 confirms that MU is ranging, that is, no significant trend is observed.

Stocks Looking BullishThe technical analysis for SPY is very strong. We see many indications of a strong bull trend. It would be wise to buy on a dip.
Currently, SPY is trading at $291.54.
We will find resistance from levels from above including the following:
291.65 from highs and lows over the past 14 periods
Levels from belowwill provide support, including:
289.47 from Volume profile over the past 14 periods
288.38 from Volume profile over the past 30 periods
286.77 from Volume profile over the past 14 periods
285.92 from Volume profile over the past 30 periods
282.69 from Volume profile over the past 100 periods
281.54 from Volume profile over the past 100 periods
280.16 from Highs and lows over the past 14 periods
278.71 from Volume profile
277.14 from Volume profile over the past 100 periods
275.93 from Volume profile
274.82 from Volume profile
274.08 from Volume profile
259.05 from Highs and lows over the past 100 periods
254.67 from Highs and lows
The technicals for SPY are as follows. Volatility is much lower than average, so a breakout can be expected. The RSI is 73, indicating that we are in a bull trend, but not yet overbought. The MACD is above the signal line, suggesting the bull phase may continue. SPY is well above the 50 period SMA, which is 281 at the moment, suggesting that we are overbought. Also, SPY is above the 100 period SMA by quite a bit, suggesting that we are overbought. Finally, the SMA(50) is above the SMA(100), a long term bullish confirmation. The ADX indicator shows a bull trend.

EURUSD TESTS KEY RESISTANCEThe euro currency continues to advance against the greenback, due to improving market sentiment and broad-based weakness in the US dollar. The EURUSD pair is only intraday bullish while trading above the key 1.1681 level, it also worth noting that the pair may be creating a bullish inverted head and shoulders pattern across various time frames.
The EURUSD pair is strongly bullish while trading above the 1.1681 level, key resistance is found at the 1.1700 and 1.1740 levels.
If the EURUSD pair trades below the 1.1650 level, sellers will likely target the 1.1630 and 1.1600 support levels.

USDJPY TRADES BACK TOWARDS NECKLINE SUPPORTThe US dollar has fallen below the 111.00 level against the Japanese yen on Thursday after US equity markets experienced heavy losses over fears of a slowdown in the Chinese economy. Bearish intraday pressure is placed back on the USDJPY pair while price trades below the 111.00 level. Sellers will look to hold price below the 110.55 level, while buyers need to push price back above the 111.37 level.
The USDJPY pair is bearish while trading below the 111.00 level, key support is found at the 110.55 and 110.10 levels.
If the USDJPY pair trades above the 111.00 level, key resistance is located at the 111.37 and 112.05 levels.

LTCUSD INTRADAY BULLISH ABOVE $50.00 LEVELLitecoin, the seventh largest cryptocurrency by market capitalisation is starting to trade back above the $50.00 level, after suffering double-digit losses on Tuesday. The LTCUSD pair retains a bullish intraday trading bias while holding above the $50.00 level and may correct back towards $70.00 area. The MACD indicator is also starting to turn higher across the lower time frames.
The LTCUSD pair is only intraday bullish while trading above the $50.00 level, further upside towards the $58.00 and $64.00 resistance levels remains possible.
If the LTCUSD pair falls below the $50.00 level, sellers will likely test towards the $47.00 and $45.00 support levels.

EURUSD MEDIUM TERM SELLERS BACK IN CONTROLThe corrective move higher in the EURUSD pair is now appearing over and sellers are targeting the 1.1300 level as the US dollar index soars towards to new 2018 trading highs.
A bearish double-top price pattern is also putting further selling pressure on the EURUSD on Wednesday. If the price break below the 1.1300 support level, heavy technical selling is expected towards the 1.1220 level.
The EURUSD pair is intraday bearish while trading below the 1.1365 level, key support is now found at the 1.1300 and 1.1220 levels.
If the EURUSD pair moves above the 1.1365 level key resistance is found at the 1.1400 and 1.1430 levels.

[Red Apple] "Rebound points. "_BTC/USD_18.08.11BTC failed to break many resistances and then falling down,, down,,,,
Let's check rebound points~
A. Monthly Chart
There's rebound points such as 20EMA, 20SMA, trend lines, previous low level.
a. Trend line I : $5860
b. 20SMA : $5790
c. Previous low level : $5755
d. Trend line II : $5600
B. Weekly Chart
Possibility for Eve&Adam pattern (Double bottom)
C. Daily Chart
Now, rebound like above chart and then, it can be dropped again later because BTC is falling down along 20EMA on 4H.
D. Summary
There's still lots of resistances up there. to breakout, we need a huge bullish candle. maybe it will appear from one of rebound points.
a. For previous briefing : There was no Buy signal (no bullish engulfing candle, failed to stay over 20EMA on 4H)
b. For this briefing :
a) Aggressive Traders : Buy from expected rebound points -> set short stop-loss
b) Conservative Traders : At least, wait until BTC stay over 20EMA on 4H and find BUY signal.
Thanks. hope you got help from my idea.

EURUSD STRONGLY BEARISH BELOW 1.1553 LEVELThe euro currency has weakened considerably against the US dollar on Friday, with price falling back towards the 1.1500 support level after the greenback found strong buying demand.
The recent corrective-move towards the 1.1600 level appears over and further intraday weakness seems likely while the EURUSD pair trades below the 1.1553 level.
The MACD indicator on the daily time frame also suggests further downside appears likely.
The EURUSD pair is intraday bearish while trading below the 1.1553 level, key support is now found at the 1.1507 and 1.1430 levels.
If the EURUSD pair moves above the 1.1553 level key resistance is found at the 1.1580 and 1.1600 levels.

GBPUSD BEARS TARGETING BELOW 1.2800The British pound is edging closer to the 1.2800 level against the US dollar on Friday, as the bearish head and shoulders pattern nears completion.
GBPUSD weakness can also be attributed to strength in greenback, with the US dollar index moving towards the highest levels of 2018.
Sellers will continue to target the 1.2770 region, while buyers need to stabilise price above the 1.2850 level.
The GBPUSD pair is strongly intraday bearish while trading below the 1.2850 level, key support is found at the 1.2740 and 1.2770 levels.
If the GBPUSD pair moves above the 1.2850 resistance level, key intraday resistance is then found at the 1.2900 and 1.2930 levels.

[Red Apple] "Bullish?? Not yet. "_BTC/USD_18.08.10As i expected, the expected line was supported. if you not see, check previous briefing. ( )
It is going up now, but...
If you are busy, you can just read below briefly
'1. Briefing '
'4. Etc_lots of resistances'
'5. Summary and Strategy'
before read, click '+Thumb up, +Follow' :-)
1. Briefing
# Piercing Candle
# Dead Cross on Daily chart
# lots of resistances
2. Daily Chart
1) Trend
Still under up-trend line
2) Candle
Piercing
3) EMA
'Dead Cross' between 20EMA and 50EMA
4) Sum.
there's piercing candle and the down slope of EMAs become gentle but i feel lack of energy for Bullish. if it had gone up more, the candle would have been 'Bullish Engulfing Candle' which is more clearly indicated 'Bullish'.
2. 4H Chart
1) EMA
a. EMAs are arraying in reverse order
b. candle is staying under 20EMA -> staying under 20EMA for over 10 days
2) Pattern
a.
in process
b.
upload this as last comment in previous comment and completed the target.
c.
breakout symmetrical -> throwback -> penetrate upward again -> complete the target.
3) Elliott Wave
4) Fibonacci
Blocked by 0.786
5) Sum.
Need to breakout of 20EMA
4. Etc. _ lots of resistances
introduce from low frame to high frame
1) 1H
a. 100EMA : $6670
2) 4H
a. 20EMA : $6600
b. 50EMA : $6950
c. 100EMA : $7200
3) 1D
a. 20EMA : $7130
b. 50EMA : $7170
c. 100EMA : $7425
d. up trend line and down trend line for Short : $6820
e. up trend line and down trend line for Long : $7600
4) 1W
a. 50EMA : $7370
b. 20EMA : $7600
5) Sum.
there are lots of resistances. in short, $6600, $6800, $6900, $7200, $7400, $7600,, $8400,,,, to breakout of all those we need huge bullish candle.
5. Summary and Strategy
a. About previous briefing : rectangle and symmetrical triangle was completed its target. if you bought BTC using those pattern, recommend take profits partially or all. if you bought BTC using Crab pattern, hold and keep stop-loss.
b. About this briefing : As i explained, there're lots of resistances. it will move zigzag or huge bullish candle to breakout of the lines or it can retest bottom or 20SMA($5800) due to many resistances. in this reason, if you not buy BTC, recommend just watch and check my comment.
Trade with your standards.
If you think my idea is helpful for you, Click ' +Thumb up, +Follow'
Also, if found something special, i will comment in real time.

USDJPY SELLING EXPECTED BELOW 111.00 LEVELThe US dollar has fallen below the key 111.00 level against the Japanese yen, as Sino-US trade tensions continue to escalate on Thursday. Now that the 111.00 to 111.50 range has been broken, sellers are now in control of the price action over the short term.
The 110.55 support level is the key area bears now need to break, while buyers will look to push price back above the 111.37 level.
The USDJPY pair is bearish while trading below the 111.00 level, key support is now found at the 110.55 and 110.00 levels.
If the USDJPY pair trades above the 111.00 level, buyers will likely test towards the 111.37 and 111.50 resistance levels.

GBPUSD YET TO REACH EXTREME OVERSOLD CONDITIONSThe British pound continues to slump lower against the US Dollar on Thursday, as the fundamentals and technicals surrounding sterling become more bearish. The GBPUSD pair still has scope to fall below the 1.2800 level as the bearish head and shoulders pattern plays-out.
The MACD and RSI indicators across the lower-time frames have still not reached extreme oversold conditions.
The GBPUSD pair remains strongly bearish while trading below the 1.2955 level, key support is found at the 1.2810 and 1.2750 levels.
If the GBPUSD pair moves above the 1.2900 resistance level, key intraday resistance is now found at the 1.2922 and 1.2955 levels.

[Red Apple] "Very Importance level on Monthly "_BTC/USD_18.08.09This idea will show you shortly the position of BTC on Monthly chart.
Let's start~
1. Short briefing
# Touch 20EMA on Monthly
# Going up after fall down around 0.886 Fib.
2. Monthly Chart
1) EMA & SMA
Candle has not been stayed under 20EMA(red) and 20SMA(red pot) since Nov. 2015
2) Now~
Touch 20EMA and then go up.
3) Summary and Scenario
a. Sum.
20EMA(about $6100) and 20SMA(about $5800) on Monthly are very importance level for BTC. Due to this, i expect it cannot be broken those levels. In this reason, these levels can help you to set stop-loss line.
b. Scenario
b.1 Rebound from 20EMA
b.2 Breakout 20EMA -> Supported 20SMA and then rebound
b.3 Breakout 20SMA -> in stagnation (in past, it took 1 year to stay over 20EMA, 20SMA)
Therefore, these levels have to be supported for BTC. if it break, Monthly candle can be 'Bearish Engulfing Candle'.
3. LTF analysis
1) Daily
all EMAs are in reverse order.
there's Hidden Bullish Divergence in RSI, CCI. if the price goes under $6079, bullish divergence will be gone.
2) 4H
0.786 Fib. becomes resistance line after breakout
4. Strategy and Summary
if you bought BTC from prz of Crab, keep your stop-loss.
if you are conservative trader, trade after buy signal(candle or pattern)
if it keep falling down, check the line of 20EMA, 20SMA on Monthly chart.
Trade with your standards.
If you think my idea is helpful for you, Click '+Thumb up, +Follow'
Also, if found something special, i will comment in real time.

BTCUSD STRONGLY BEARISH BELOW $6,730The BTCUSD pair has tumbled below key support, after the US Securities and Exchange Commission delayed a major decision on a Bitcoin ETF until September.
The recent decline in the BTCUSD pair means that the world’s number one cryptocurrency has now erased July’s trading gains. Bitcoin is likely to come under heavy selling pressure while price trades below the key $6,730 level.
The BTCUSD pair is strongly bearish while trading below the $6,730 level, key technical support is located at the $6,250 and $5,700 levels.
If the BTCUSD pair moves above the $6,730 level, price may correct back towards the $6,838 and $6,990 resistance levels.

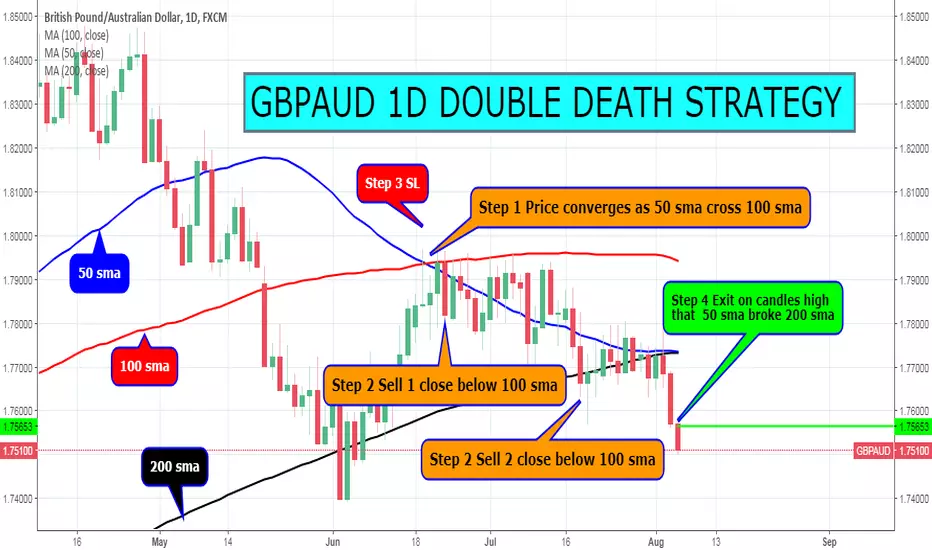
GBPAUD 1D DOUBLE DEATH STRATEGYStep #1: Wait for the 50-day EMA to cross below the 100-day EMA. The two moving averages also need to converge with the price action.
If we get the crossover of the 50-day MA (blue line) and 100-day MA (orange line) at the same time the price is testing those moving averages like it’s doing on the GBP/USD chart below, that’s the best-case situation for a trade because we can define the risk.
The rule you need to keep in mind is that when the MAs converge with the price you have to get ready for the ride because it is going to get BUMPY!
Step #2: Multiple entry strategy: Buy1 when we close below 50-day MA and 100-day MA. Buy2 when we break and close below 200-day MA.
Using multiple entries to improve your average entry price can be the best way to approach the death cross signal. Scaling in to a position is our preferred trading method when looking to capture large price move in a currency pair.
The fact that the price was near the death cross signal, it created a tension in the market that eventually will lead to a sharp move to the downside.
We pull the trigger on the first half of the trade once we close below the 50-day and 100-day moving averages.
If at the moment when the death cross developed we’re already trading slightly below the two moving averages, sell at the market the moment we close below.
The second half of our position is entered once we break and close below the 200-day moving average.
Note* it’s important to remember that the success of the death cross signal relays on this simple trade secret that price and the two moving averages needs to converge.
Keep it simple stupid is not just a simple aphorism, but it’s an old truth that can make the difference between losing and making money trading.
Step #3: Hide your protective Stop Loss above 50-day MA and 100-day MA
The most important thing we need to define when trading is our risk. If you want to be a profitable trader you really need a limited risk. This is the type of death cross trades that we want to pull the trigger on.
If the price were to move back above those moving averages, we can safely assume this is yet another false trade signal. In this trade case scenario, we’re risking a little and our reward is potentially much bigger.
So, the best place to hide your protective stop loss is above the 50-day MA and 100-day MA.
tep #4: Two-step process for the take profit strategy: Mark on your chart the high of the candle when the 50-day MA crossed below 200-day EMA. Take profit when this high is broken.
Our take profit strategy might seem a little bit complex, but once we break down the steps you need to follow it will make more sense why we’ve chosen this approach.
The first thing you have to do is to remember what we said in the beginning of the article which is that when the price doesn’t converge with the two MAs this is a death cross false signal.
In our example below, we can observe this type of price action. Now all you have to do is to mark the high of the candle when the death cross happened and take profit as soon as the high gets broken.
Note** the above was an example of a SELL trade using the death cross strategy. Use the same rules for a BUY trade – but in reverse, in which case we have the golden cross trading strategy.
GBPUSD STRONGLY BEARISH BELOW 1.3070The British pound has come under heavy selling pressure against the US dollar, after the Bank of England raised interest rates, but stated that any future rate hikes would be gradual and limited. The GBPUSD pair is now strongly bearish below the 1.3070 level, as represents the pairs 100-week moving average and the neckline of a bearish head and shoulders neckline break. Sellers will try to break the 1.3000 support level, while buyers attempt to stabilise price above the 1.3070 resistance level.
The GBPUSD pair is strongly bearish while trading below the 1.3070 level, key support remains at the 1.3000 and 1.2958 levels.
If the GBPUSD pair moves above the 1.3070 level, buyers will likely target the 1.3101 and 1.3150 resistance levels.

EURUSD - Possible bearish outlookLooking at the 1hr chart the EURUSD has a few setups that look increasingly bearish:
1. Triple top reversal earlier in the session
2. Failure to create bullish break of longer term consolidation triangle
3. MA cross into bearish
4. Previous redbound on 4hr 100 MA being testing - awaiting confirmation
5. 'Threes a crowd' - Price down test into MA bearish cross
6. Testing 38.2 retracement from the low to triple top high area
6. MA on daily crossed into bearish earlier in the week
A lot of arguements for the bearish position, keeping the risk to minimum and trading what is seen with a logical stop location. If all the technicals are right theis should setup a limit risk opportunity with high reward.
Note this is only my personal opinions and NOT trading advice - I do not endorse any use of the above, it is for information only

LTCUSD BEARISH TRADING BIAS BELOW $80Litecoin, the sixth largest cryptocurrency by market capitalisation continues to drift lower alongside the broader digital currency market on Tuesday. The LTCUSD pair is likely to continue to weaken further intraday while trading below the key $80 level.
The LTCUSD pair also looks to be creating a bearish head and shoulders pattern, while the MACD indicator is also moving lower, pointing to more weakness ahead.
The LTCUSD pair is bearish while trading below the $80 level, key technical support below Is located at the $78 and $75 levels.
If the LTCUSD pair trades back above the $80 level, buyers may test towards the $83 and $85.50 resistance levels.

EURUSD STILL BULLISH ABOVE 1.1681 LEVELThe euro continues to hold above the 1.1700 level against the US dollar, following a sharp decline in the value of the US dollar on Monday.
The EURUSD pair currently retains a bullish intraday bias while price trades above the key 1.1681 technical level. Traders now look to Jobs and Retail Sales data from the German economy and the release of US Core PCE data later today, which is the Federal Reserve’s preferred measure of inflation.
The EURUSD pair is bullish while trading above the 1.1680 level, key resistance is found at the 1.1730 and 1.1790 levels.
If the EURUSD pair falls below the 1.1680 level, key technical support is found at the 1.1650 and 1.1630 levels.

GBPUSD ONLY INTRADAY BULLISH ABOVE 1.3177 LEVELThe British pound trades back towards the 1.3100 level against the US Dollar, after traders sold the GBPUSD pair from the 1.3150 level on Monday.
GBPUSD is likely to remain under selling pressure while trading below the 1.3177 level, as it marks a pivotal technical area bulls must break.
Sellers will once again attempt to target sustained losses below the 1.3080 level, while buyers will need to break above Monday's daily-high for further bullish advancement.
The GBPUSD pair is bearish while trading below the 1.3080 level, key support is now found at the 1.3050 and 1.3030 levels.
If the GBPUSD pair holds above the 1.3177 level, buyers are likely to test towards the 1.3205 and 1.3245 resistance levels.

GBPUSD UNABLE TO MOVE AWAY FROM 1.3100 LEVELThe British pound continues to trade on the back-foot against the US dollar on Monday, with price currently trapped around the 1.3100 level.
The British pound has also received more bearish Brexit news this morning, with the European Court of Justice being given the final say in a number of important Brexit issues.
Sellers will try to target a sustained break below the 1.3080 support level, while buyers will need to hold price above the 1.3177 level to regain bullish momentum.
The GBPUSD pair is bearish while trading below the 1.3100 level, key support is now found at the 1.3080 and 1.3030 levels.
If the GBPUSD pair holds above the 1.3177 level, buyers may test towards the 1.3205 and 1.3245 resistance levels.
