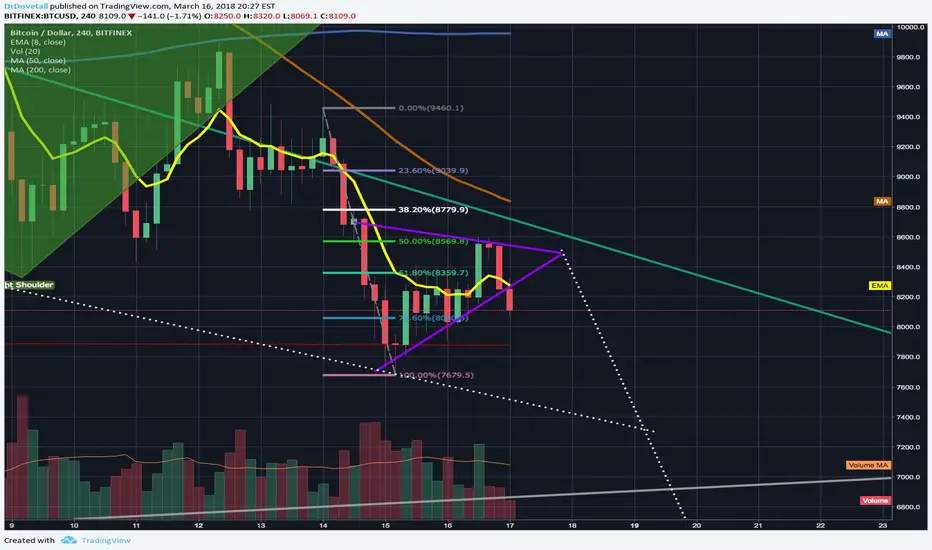
Ascending wedge possible hinting at further downside?Lots of short signals here. The first one is that wre now have yet another 1 day candle closing below the 200 MA. The second big one is on the 4 hour chart where a day or 2 ago the 100 SMA did a death cross under the 200 SMA and is currently continue to trend donward from it, leaving us with the 100SMA under the 200SMA and the 50SMA under both of those..all strong sell signals. We also just closed the last 4 hour candle back below the tline which is usually a good sell signal....and finally we have now an ascending wedge which tends to break bearishly downward especially when compounded with all these other sell signals. I think we could very well break downward form the wedge and diop as low as the 00% fib retrace extension level at around 76...to ensure I buy back in before any bounce abck up though I'm not gonna try to catch the bottom and instead have set 7749 as my arbitrary limit buy back in number. Hopefully this time it actually hits that...my previous limit buy order was $100 too low of the last recent dip and I missed out on the profit taking of the recent temporary bull flag.
Sma
AUDCAD 15M long | morning Star PatternCandle Pattern: Morning Star
Trend: up
Trend Entry: with
TP/SL Ratio Target: 2 to 1
Target TP PIPs: 40
SL PIPS: 20
Fib Entry: .764
Fib TP: .236
Stochastic: over-sold
MACD Histogram: contracting up
200SMA: slightly below
Inside EMA/SMA zone: no
BB: bottom
Pivot Point: S1
Elliot Wave:
possible bottom zone of the wave 4 in upside elliot wave.
hoping this is the start of wave 5
Notes:
Late post, Entry made overnight. Already in profit at posting.
morning stars formed around the 764 fib retracement and at the 200 sma. I set my entry at the .764 and waited for the second retry to the low for entry.
stochastic showing oversold
macd still showing decrease in downside momentum
Looking for a TP around wave 3 high
What can go wrong:
its possible this is actually an ABC correction for a very short wave 5 and might see a small upside move to create point B with a final move to create point C in my SL zone.

EURCHF 15M long | morning Star PatternCandle Pattern: Morning Star
Trend: up
Trend Entry: with
TP/SL Ratio Target: 2 to 1
Target TP PIPs: 40
SL PIPS: 20
Fib Entry: .764
Fib TP: 1
Stochastic: over-sold
MACD Histogram: contracting up
200SMA: slightly below
Inside EMA/SMA zone: no
BB: bottom
Pivot Point: Pivot && S1
Elliot Wave:
Just completed Correction C. If this is a new uptrend extension Im expecting to see a retest to the low but not go past the point C.
1HR stoch showing oversold and MACD showing loss of downside momentum.
Notes:
double bottom morning stars formed around the 764 fib retracement. I set my entry at the .764 and waited for the second retry to the low for entry.
stochastic showing oversold
macd still showing decrease in downside momentum
Going to try and get at least 40 pips, but will see how momentum is going to the upside and if it looks like we will crack the last swing high
What can go wrong:
could be an elliot wave to the downside or continued C point Correction low, especially if we break currenct C point

USDJPY 15M long | morning Star PatternCandle Pattern: Morning Star
Trend: up
Trend Entry: with
TP/SL Ratio Target: 2+ to 1
Target TP PIPs: 40
SL PIPS: 20
Fib Entry: .764
Fib TP: .382
Stochastic: over-sold
MACD Histogram: contracting up
200SMA: slightly below
Inside EMA/SMA zone: no
BB: middle
Pivot Point: Pivot && S1
Elliot Wave:
just completed wave 4 to the downside of wave 3
looking for an uptick to the 107.40 zone long term
Notes:
morning star formed around the 764 fib retracement. I set my entry just below the .764 and waited for the second retry to the low for entry.
stochastic showing oversold
macd still showing decrease in downside momentum
What can go wrong:
breaking below wave 1 zone would indicate we are not actually in an elliot motive wave to the upside and instead in some form of ABC corrective pattern and throwing my bias completely out the window.
SL at a conservative 20 pips which put me just below the wave 1 zone which it shouldnt enter and below the last swing low.

EURUSD 15M long | morning Star PatternCandle Pattern: Morning Star
Trend: up
Trend Entry: with
TP/SL Ratio Target: 2 to 1
Target TP PIPs: 40
SL PIPS: 20
Fib Entry: .764
Fib TP: 1+
Stochastic: over-sold
MACD Histogram: contracting up
200SMA: above
Inside EMA/SMA zone: no
BB: bottom
Pivot Point: Pivot && S1
Elliot Wave:
looks like we might be starting a new elliot wave to the upside and just completed wave 2.
Looking for a push beyond wave 1 high point.
TP set just above wave 1 but expecting a long term upside move above the last elliot wave 5 point high to the upside.
Notes:
morning star formed around the 618 fib retracement. I set my entry at the .764 below the morning star to allow for better entry
stochastic showing oversold with a divergence to the upside
macd still showing decrease in downside momentum
What can go wrong:
TP could be set too high at 40 pips and will consider a smaller TP if we struggle to break wave 1 high point.
A move to the downside past point C correction would indication we are actually in a wave 3 to the downside from the previous elliot wave 5 completion.

USDCHF 15M short | Evening Star PatternCandle Pattern: Evening Star
Trend: down
Trend Entry: with
TP/SL Ratio Target: 2 to 1
Target TP PIPs: 30
SL PIPS: 15
Fib Entry: .764
Fib TP: 1+
Stochastic: over-bought
MACD Histogram: contracting down
200SMA: below
Inside EMA/SMA zone: yes
BB: top
Pivot Point: At Pivot
Elliot Wave:
looking for an ABC C point final termination closer to the wave 3/4 zone of the last elliot wave uptrend and close to the 200sma on the hourly chart.
Notes:
Evening star formed around the 618 fib retracement. I set my entry at the .764 above the morning star to allow for better entry
stochastic showing overbought with a sligh divergence to the downside
macd still showing decrease in upside momentum
What can go wrong:
SL is set above elliot wave A point correction low. I could be wrong about C point making a final low closer to the 200sma and we could be at a new uptrend elliot wave extension at which point the current C point would be the starting point of the new elliot wave to the upside and A correction would be broken closing out my trade.

USDJPY 15M short | Evening Star PatternCandle Pattern: Evening Star
Trend: down
Trend Entry: with
TP/SL Ratio Target: 2 to 1
Target TP PIPs: 40
SL PIPS: 20
Fib Entry: .764
Fib TP: .236
Stochastic: over-bought
MACD Histogram: contracting down
200SMA: above
Inside EMA/SMA zone: no
BB: top
Pivot Point: R1 && R2
Elliot Wave:
looks like the start of wave 5 in the uptrend. Hourly starting to show overbought.
Im looking for a retracement down before completing the final leg to the upside above wave 3 on the hourly
Notes:
morning star formed around the 618 fib retracement. I set my entry at the .764 above the morning star.
stochastic showing overbought and second wave into the overbought zone.
macd still showing decrease in upside momentum
What can go wrong:
SL set just above wave 3 last high and price could end up going straight for the completion of elliot wave 5 and blow past wave 3 last high point, at which point I would get stopped out.

USDJPY 15M short | Evening Star PatternCandle Pattern: Evening Star
Trend: up
Trend Entry: against
TP/SL Ratio Target: 3 to 1
Target TP PIPs: 60
SL PIPS: 20
Fib Entry: 1+
Fib TP: .50
Stochastic: over-bought
MACD Histogram: contracting up
200SMA: above
Inside EMA/SMA zone: no
BB: top
Pivot Point: R2 && R3
Elliot Wave:
Completion of wave 5
final wave 5 completion of the upside wave, terminating in the wave 3/4 zone of the previous wave down
this also completed a giant ABC correction from the previous downtrend wave.
this may be the start of a new long term downtrend. Looking forward to an ABC correction down to the wave 3/4 area of the current wave.
Notes:
Posted late since position was opened while I was asleep waiting for NFP.
morning star formed after a big upswing.
stochastic showing oversold and having trouble moving to the downside to fully correct
macd still showing upside momentum slowing down.
With NFP coming up at 530am, I have placed an entry 10 pips above the highest swing, looking for a downside retracement around the .50 fib level and above the 200sma
What can go wrong:
NFP is a dangerous play and could completely blow past the SL or have such great volatility that it triggers the SL even though it goes in the correct direction.

AUDUSD 15M Long | Morning Star PatternCandle Pattern: Morning Star
Trend: down
Trend Entry: against
TP/SL Ratio Target: 1 to 1
Target TP PIPs: 20
SL PIPS: 20
Fib Entry: .764
Fib TP: .50
Stochastic: over-sold
MACD Histogram: contracting up
200SMA: Below
Inside EMA/SMA zone: no
BB: bottom
Pivot Point: S1 && S2
Elliot Wave:
finishing the completion of wave 4
Looking for final move up to complete wave 5
Notes:
posted a little late, trade opened while away from computer
Morning star forming under 200SMA. Going against the new trend, however I think its still uptrend on higher time frame and final completion of elliot wave 5 1HR
Morning star almost at 100% fib from previous swing low
stochastic showing oversold with a double dip
macd showing slowed downside momentum
What can go wrong:
might see price completely go past the swing low and that would invalidate the upside elliot direction.
would have to reconsider downtrend and wave 3 as the start of downside elliot

EURUSD 15M long | Morning Star PatternCandle Pattern: Morning Star
Trend: down
Trend Entry: against
TP/SL Ratio Target: 3 to 1
Target TP PIPs: 60
SL PIPS: 20
Fib Entry: 1
Fib TP: .236
Stochastic: over-sold
MACD Histogram: contracting down
200SMA: below
Inside EMA/SMA zone: no
BB: bottom
Pivot Point: Pivot && S1
Elliot Wave:
Completion of correction wave C.
If we are starting a new upside wave, this should be a the start of a new bottom.
Looking for an upswing to the upside with a correction around 618 fib as validation
www.tradingview.com
Notes:
Posted late since position was opened while I was asleep waiting for NFP.
several morning stars formed over several hours after a big swing to the downside.
stochastic showing oversold on both the 15M and 1HR.
macd still showing downside momentum on the 15M but slowing momentum to the upside on the 1HR
With NFP coming up at 530am, I have placed an entry 10 pips below the lowest swing for an upside move of 60 pips shy of the 200sma
What can go wrong:
NFP is a dangerous play and could completely blow past the SL or have such great volatility that it triggers the SL even though it goes in the correct direction.

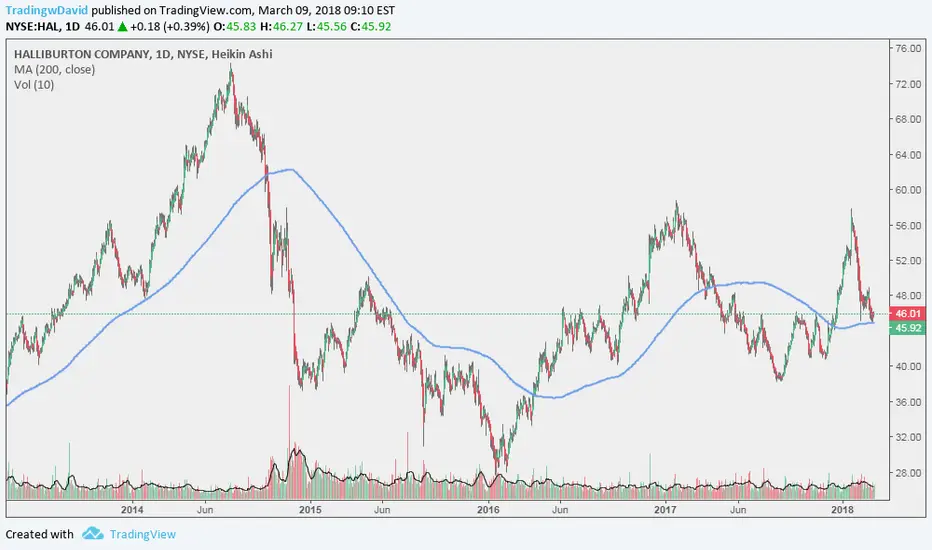
Hulliburton interesting situationHulliburton Company (HUL) has reached the 200-day Simple Moving Average, and this happens about one time a year. In last five years, the price has almost always broken the SMA (5 breakouts vs 2 bounces) resulting in big movement over the next few weeks. Will it be the same this time as well?
USDCAD 15M long | Morning StarCandle Pattern: Morning Star
Trend: down
Trend Entry: against
TP/SL Ratio Target: 2 to 1
Target TP PIPs: 40
SL PIPS: 20
Fib Entry: .764
Fib TP: .382
Stochastic: over-sold
MACD Histogram: contracting down
200SMA: below
Inside EMA/SMA zone: no
BB: bottom
Pivot Point: Pivot && S1
Elliot Wave:
Possibly completion of wave 2 for a move to the upside
Looking for a long term upside to validate wave 3
Notes:
Evening star formed below 764 fib retracement of last swing low.
stochastic showing oversold, second dip to the low and moving above the 20
macd showing low momentum to the down side
What can go wrong:
if price dips bewlow the last swing it will invalid a new uptrend elliot wave and many
either its another ABC correction or the formation of an elliot wave to the downside instead
going against the trend which breaks a rule of mine, however there is strong reason to believe an upside move considering the elliot wave and 1HR at the 200sma

EURCHF 15M short | Evening StarCandle Pattern: Evening Star
Trend: up
Trend Entry: against
TP/SL Ratio Target: 1 to 1
Target TP PIPs: 15
SL PIPS: 15
Fib Entry: .618
Fib TP: .382
Stochastic: over-bought
MACD Histogram: contracting down
200SMA: above
Inside EMA/SMA zone: no
BB: top
Pivot Point: Pivot && R1
Elliot Wave:
this may be point B of the ABC correction of the previous Wave 5
Looking for a long term drop between wave 3 and wave 4
Notes:
terrible looking Evening star, more like massive dojis, formed at the 618 fib retracement of last swing high.
stochastic showing overbought and dipping below 80
macd showing momentum to the down side
What can go wrong:
might see price still retrace the to 764 level, SL place above that point
if price goes beyond last swing high, it will be the new wave 5 high point

AUDCAD 15M Short | Evening StarCandle Pattern: Evening Star
Trend: down
Trend Entry: With
TP/SL Ratio Target: 1 to 1
Target TP PIPs: 20
SL PIPS: 20
Fib Entry: .618
Fib TP: .236
Stochastic: over-bought
MACD Histogram: contracting down
200SMA: Above
Inside EMA/SMA zone: yes
BB: top
Pivot Point: Pivot && S1
Elliot Wave:
Looks like we just completed ABC correction of previous elliot wave
If if this is the start of a downside elliot wave we should see a push past C point low to create a new low
If C is the start of new upside elliot wave, we should see a retracement to around the .236 fib of C point before contuniation upside
Notes:
Evening star forming inside ema/sma zone, under 200sma at fib .618 level and just under elliot wave 1 zone
stochastic showing overbought
macd starting to show decrease in upward momentum
What can go wrong:
Might see price enter .764 fib before actual reversal to the downside
might see price stop shy of .236 if this is an upside elliot wave

AUDCAD 15M Long | Morning Star PatternCandle Pattern: Morning Star
Trend: up
Trend Entry: With
TP/SL Ratio Target: 1 to 1
Target TP PIPs: 15
SL PIPS: 15
Fib Entry: .764
Fib TP: .5
Stochastic: over-sold
MACD Histogram: contracting up
200SMA: Above
Inside EMA/SMA zone: no
BB: bottom
Pivot Point: Pivot
Notes:
morning star formed on the 200SMA, Daily Pivot and at the .764 fib of last swing low
stochastic showing oversold, second dip below 20
MACD now contracting to the upside
Might be in the ABC correction phase of last elliot wave.
Possibly point A and looking to create point B just shy of previous swing high which should be around the .382 to .236 fib level

USDJPY 15M Short | Double Evening Star Pattern / Double TopCandle Pattern: Evening Star
Trend: Down
Trend Entry: With
TP/SL Ratio Target: 1 to 1
Target TP PIPs: 20
SL PIPS: 20
Fib Entry: .618
Fib TP: .382
Stochastic: overbought
MACD Histogram: contracting
200SMA: Above (just barely)
Inside EMA/SMA zone: no
BB: top
Pivot Point: Pivot && R1
Notes:
double top evening stars at the .764 fib level of previous swing high
stochastic showing overbought and divergence to the down side
MACD showing decreased momentum to the top side and should make some good downside momentum.
TP set just shy of last inner swing low however this may be the starting wave 3 in an elliot wave to the down side

AUDUSD 15M LONG | Morning Star PatternCandle Pattern: Morning Star
Trend: Up
Trend Entry: With
TP/SL Ratio Target: 1 to 1
Target TP PIPs: 30
SL PIPS: 30
Fib Entry: .618
Fib TP: .764
Stochastic: oversold
MACD Histogram: contracting
200SMA: Above
Inside EMA/SMA zone: no
BB: bottom
Pivot Point: Pivot && S1
Notes:
morning star just shy of the last downside swing and just above Elliot wave 1 zone
Possibly a wave 4 correction with long term outlook to 1.3 to 1.6 fib extension level to complete wave 5 before trend change to a correction

Until the price is below MA and not out of the cloud, we should Until the price is below MA and not out of the cloud, we should not expect a price hike.
SL = 12000$
TP = 7200$

USDCAD 15M Short | Evening Star PatternCandle Pattern: Evening Star
Trend: Down
Trend Entry: With
TP/SL Ratio Target: 2 to 1
Target TP PIPs: 40
SL PIPS: 20
Fib Entry: .618
Fib TP: .618
Stochastic: overbought
MACD Histogram: contracting
200SMA: Above (just barely)
Inside EMA/SMA zone: no
BB: top
Pivot Point: Pivot && R1
Notes:
morning star just shy of the last upside swing
I believe this is completing correction point B following a full Elliot wave 5
Long term outlook to 1.2812 downside price range

USDCAD daily dojiDaily doji formed below 200 sma line followed by bearish confirmation which is also bigger than the previous bull bars. Stochastics in overbrought area. My only concerns are that there is no fib support/resistance suggesting that the trend is still going to continue up rather than dropping. Will look for 4hr and hourly bearish action to enter short provided the high of the bearish bar is not violated.

ETC SMA50 crossing SMA200! growth expectedWhy buying ETHEREUM CLASSIC is a good opportunity now?
- Last time SMA50 crossed SMA200 we saw a huge drop. This time SMA50 is crossing SMA200 in the otherway, could expect huge growth.
- Airdrop on 5th march. This kind of thing make the chart crazy, in the good way.
- Investors are in the place, huge volumes.
- We are expecting a lot from ETC since a while, the sleeping giant is waking up.
Buy at your own risk, I'm not pro at all.
OPINIONS ARE WELCOME! Thankss

If Bitcoin 'closes' below the 200: FUNDAMENTALS!?! If Bitcoin closes below the 200 day MA for more than a couple days we may see a rapid sell off to the 6500 level.
The question is after we find support will BTC consolidate sideways for half a year or will we see another bull run into double digits again.
One thing for certain is that the energy consumption of the Bitcoin network is unsustainable by any metric.
Network consuming as much energy as Singapore.
Consuming approx 550 KWh per transaction (not per block, per transaction).
550 KWh is enough to charge a Tesla P100D (the bad boy) up 5 and a half times (you see that math).
The Fundamentals are saying SELL!
...wait what fundamentals...

Bitcoin in falling wedge and reacting to SMA-26The price is following a clear falling wedge and has recently bounced back from the bottom support of the channel. For the past few days, it has been bouncing off of the SMA line which is even more clear when you replay the chart.
Price will likely rise to hit the SMA, retrace a little bit, then continue to rise to the top of the channel. When this happens, RSI will show overbought conditions, go back down to around 50, then continue again to overbought conditions.
MACD is showing a strong uptrend.
My price target will first be around $10000 with a stop-loss at $9000. After that, I may or may not short the retracement that will likely follow. Finally, I will enter long and go to the top of the channel.
