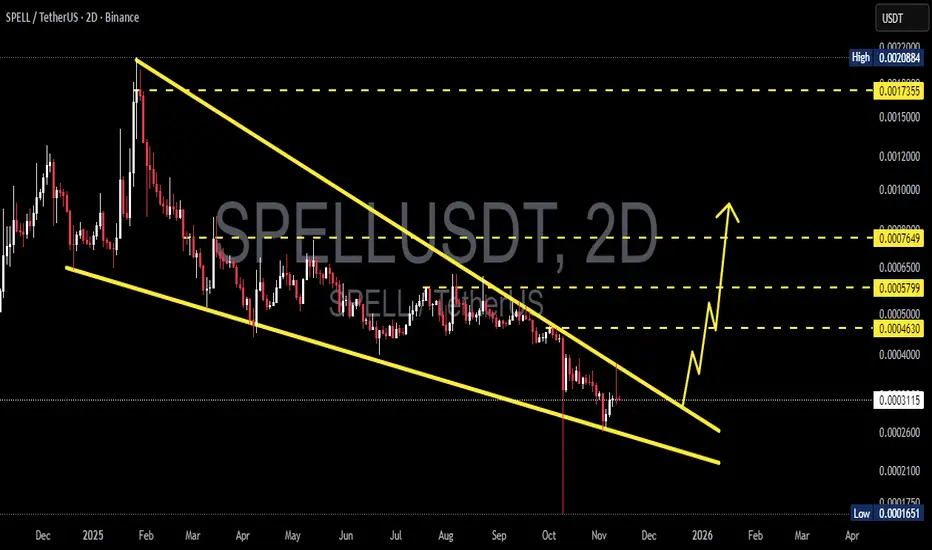
SPELL/USDT — Falling Wedge: Is a Big Reversal on the Horizon?The SPELL/USDT (2D – Binance) pair is currently forming a large Falling Wedge pattern, a classic technical formation that often signals the end of a prolonged downtrend and the potential beginning of a bullish reversal.
Since the early-year peak, SPELL has been locked inside a downward-sloping channel, consistently printing lower highs and lower lows. However, each drop toward the wedge’s lower boundary has triggered buying reactions, hinting that accumulation may be taking place quietly among strong hands.
Now, as price moves closer to the apex of the wedge, volatility is compressing — setting the stage for a decisive breakout or breakdown.
This is the make-or-break zone for SPELL.
---
Pattern & Key Levels
🔹 Main pattern: Falling Wedge (potential bullish reversal setup).
🔹 Current price: Around 0.0003138 USDT.
🔹 Critical support: Lower wedge boundary and the historical low at 0.0001651 (strong invalidation level).
🔹 Key resistance / breakout targets:
0.0004630 → initial breakout target
0.0005799 → structural shift confirmation
0.0007649 → mid-term target
0.0017355 → extended target if momentum accelerates
---
Bullish Scenario
1. Breakout Confirmation:
A strong 2D candle close above the descending resistance line with a clear rise in volume would confirm a potential trend reversal.
2. Retest for Validation:
After the breakout, a retest of the former resistance (now turned support) could offer a low-risk entry opportunity.
3. Progressive Targets:
Target 1: 0.0004630 — first reaction zone
Target 2: 0.0005799 → 0.0007649 — continuation targets
Extended Target: 0.0017355 — possible in a strong altcoin rally
4. Momentum Confirmation:
Sustained volume growth + higher closes above the wedge will reinforce bullish sentiment.
---
Bearish Scenario
1. Rejection at Upper Wedge:
Price fails to break the upper resistance and faces rejection → potential retest of the lower wedge line.
2. Breakdown Below Support:
If SPELL closes below the wedge and loses 0.0001651, it would confirm continuation of the macro downtrend.
3. Downside Targets:
Initial support zone between 0.00022 – 0.00018, then down to 0.0001651 if selling pressure intensifies.
4. Bearish Confirmation:
Rising sell volume and strong candles below support would indicate distribution and further downside risk.
---
Conclusion
SPELL has been trapped in a multi-month descending wedge, and now approaches a critical decision point. Historically, such wide wedge formations often precede explosive reversals when breakout confirmation is supported by volume.
However, if the price fails to break out and instead closes below support, the bearish continuation remains in play.
This is the decisive moment for SPELL:
📈 Breakout → potential trend reversal.
📉 Breakdown → extended bearish continuation.
---
Technical Notes
Wait for 2D candle confirmation and volume validation before acting on a breakout.
Use multi-timeframe confluence (4H + 1D) for better entry confirmation.
Apply strict risk management due to SPELL’s volatility and low liquidity nature.
---
#SPELL #CryptoAnalysis #Altcoin #TechnicalAnalysis #FallingWedge #BullishSetup #BreakoutWatch #PriceAction #MarketStructure #SwingTrade #CryptoChart #AltcoinReversal
Spellsignals
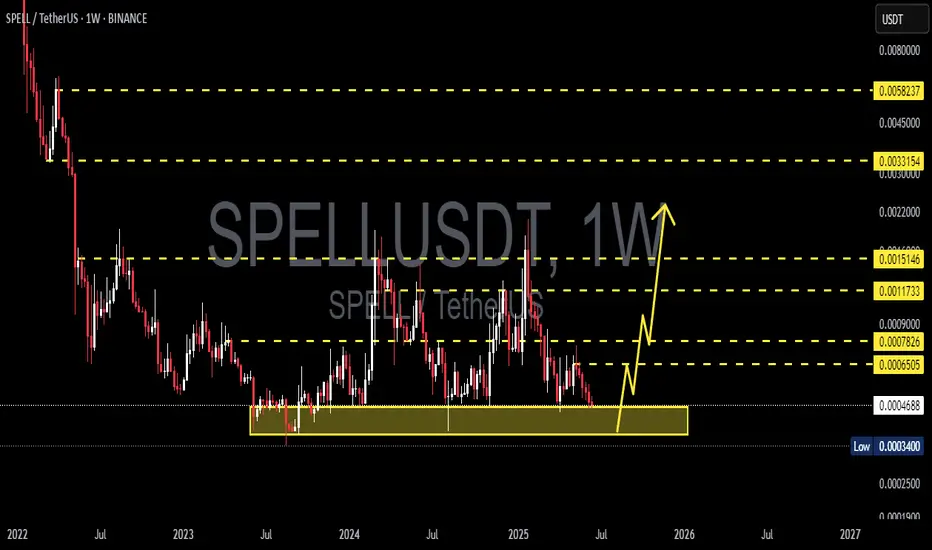
SPELL/USDT — Long-Term Accumulation or Final Breakdown?Since early 2022, SPELL has been in a strong downtrend, followed by a multi-year consolidation. Right now, the price is once again sitting inside the critical accumulation zone (0.00034 – 0.00047), which has been tested multiple times over the past 2+ years. This area represents a major battleground between long-term buyers looking for undervaluation and sellers maintaining downward pressure.
---
🔎 Chart Structure & Pattern
Macro Downtrend: clear series of lower highs and lower lows since 2022, showing dominant selling pressure.
Rectangle Accumulation: since 2023, price has been moving sideways inside the yellow support box (0.00034 – 0.00047).
Repeated Rejections: every dip into this zone was met with sharp wicks upward, showing demand.
But... if this zone fails, it may confirm exhaustion of buyers and open the door for deeper downside.
---
🚀 Bullish Scenario (Rebound & Reversal)
For SPELL to flip bullish, these conditions must be met:
1. Support Holds: weekly close remains above 0.00034.
2. Breakout Confirmation: price must break and hold above resistance levels at 0.00065 → 0.00078 → 0.00117.
3. Volume Expansion: strong volume on the breakout to confirm real demand.
🎯 Bullish Targets:
Short-term: 0.00065 – 0.00078
Mid-term: 0.00117 – 0.00151
Long-term (major reversal): 0.00331 – 0.00582
---
⚠️ Bearish Scenario (Breakdown & Continuation)
If SPELL closes below 0.00034 on the weekly, it will confirm a major breakdown:
Long-term holders may cut losses, adding further selling pressure.
With no strong historical support below, price may seek psychological levels lower.
This could trigger a capitulation phase, creating new lows before a potential cycle reset.
🎯 Bearish Targets:
Psychological support at 0.00020 – 0.00025 or even deeper levels due to lack of structure below.
---
🧩 Conclusion & Narrative
SPELL is at a make-or-break zone:
If 0.00034 – 0.00047 holds, we could see a significant rebound with multi-level rally potential.
If it breaks, we may enter a new bearish leg with much lower prices ahead.
For traders, this area can be approached two ways:
Aggressive Strategy: accumulate inside support with a tight stop below 0.00034.
Conservative Strategy: wait for a confirmed breakout above 0.00078 and enter on the retest.
📌 Bottom line: This zone is not just numbers — it’s the cycle-defining area for SPELL in the coming months and possibly years.
---
#SPELL #SPELLUSDT #Crypto #Altcoin #TechnicalAnalysis #SupportResistance #PriceAction #CryptoAnalysis #Accumulation

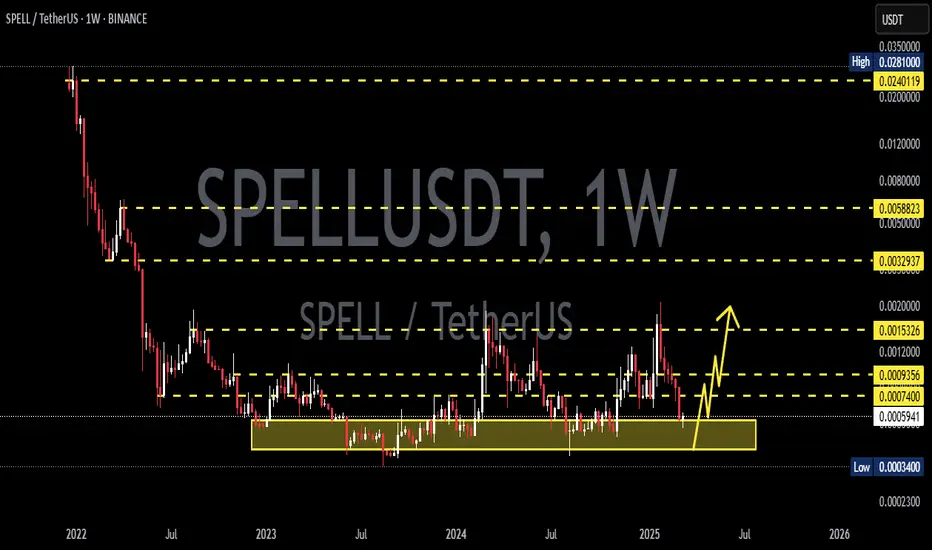
SPELLUSDT 1W AnalysisSPELL ~ 1W Analysis
#SPELL This is the lowest support for now. Buy from here if you still have faith in this coin with a short term target of at least 20%+.
SPELLUSDT 1WSPELL ~ 1W Analysis
#SPELL Buy gradually from here if you still have a Conviction on this coin with a short -term target of at least 15%+.

SPELLUSDT 1WSPELL ~ 1W Analysis
#SPELL Buy gradually from here if you still have a Conviction on this coin with a short -term target of at least 20%+.
#SPELL (SPOT-INVEST) IN(.00051- .00070)T.(.0120) SL( .0004663)BINANCE:SPELLUSDT (DEFI)
Entry (.00051- .00070)
SL 1D close below 0.0004663
T1 .0020
T2 .0028
T3 .0044
T4 .0120
Extra Target .0200
1 Extra Targets(optional) in chart, if you like to continue in the trade with making stoploss very high.
______________________________________________________________
This trade advices.
********************
1- this coin may give you more than 10X in the end of bull market if you could hold it with market volatility
2- after crossing .002 nothing will stop this coin to achieve all the targets
______________________________________________________________
Golden Advices.
********************
* collect the coin slowly in the entry range.
* Please calculate your losses before the entry.
* Do not enter any trade you find it not suitable for you.
* No FOMO - No Rush , it is a long journey.
Useful Tags.
****************
My total posts
www.tradingview.com
1Million Journey
www.tradingview.com
www.tradingview.com
**********************************************************************************************
#Manta #OMNI #DYM #AI #IO #XAI #ACE #NFP #RAD #WLD #ORDI #BLUR #SUI #VOXEL #AEVO #VITE #APE #RDNT #FLUX #NMR #VANRY #TRB #HBAR #DGB #XEC #ERN #ALT #IO #ACA #HIVE #ASTR #ARDR #PIXEL #LTO #AERGO #SCRT #ATA #HOOK #FLOW #KSM #HFT #MINA #DATA #SC #JOE #RDNT #IQ #CFX #BICO #CTSI #KMD #FXS #DEGO #FORTH #AST #PORTAL #CYBER #RIF #ENJ #ZIL #APT #GALA #STEEM #ONE #LINK #NTRN #COTI #RENDER #ICX #IMX #ALICE #PYR #PORTAL #GRT #GMT #IDEX #NEAR #ICP #ETH #QTUM #VET #QNT #API3 #BURGER #MOVR #SKL #BAND #ETHFI #SAND #IOTX #T #GTC #PDA #GMX #REZ #DUSK #BNX #SPELL

SPELLUSDTSPELL ~ 1W
#SPELL If you have Conviction on this coin., this support block would be a very good buy for now.

#SPELL/USDT#SPELL
The price is moving in a descending channel on the 12-hour frame, about to break upward
With a strong support area in green at 0.0007000, the price has already bounced from it
We have a trend to touch the Moving Average 100
We also have a downtrend on the RSI that has been breached upward
A moderate rise is expected over 3 levels
Entry price is 0.0008440
The first goal is 0.0009613
The second goal is 0.001150
The third goal is 0.001274

SPELLUSD strong bullish break-outThe Spell token (SPELLUSD) has recently broken above the Channel Down pattern that it's been trading in since December 27 2021. Yesterday it made another big bullish break-out as it broke above the 1D MA100 (green trend-line) for the first time. Ideally we would like to see a 1D candle close above it and the 0.382 Fibonacci retracement level as well but with the 1D MACD invalidating a Bearish Cross that was previously seen on the Channel's Lower Highs, we expect this to be the decisive move to start a long-term bullish trend. We are targeting the 1D MA200 (orange trend-line) on the short-term.
--------------------------------------------------------------------------------------------------------
Please like, subscribe and share your ideas and charts with the community!
--------------------------------------------------------------------------------------------------------
