
Spysignals
$SPY Neutral Prediction--Traders Eye BreakoutDaily AI-powered trade ideas, SPY 0DTE plans, NLP news signals, weekly option alerts & live trading updates. Trade smarter, every day. 🚀📈
🚀 AMEX:SPY Intraday Prediction – Neutral Trend, Breakout Loading?
📊 Market Status
Price: $660.77
Data Quality: ✅ Strong
Timeframe: 1-Min K-Line Precision
🎯 Price Forecasts
30-Min Target → $661.18 (+0.06%)
2-Hr Target → $659.75 (-0.16%)
End-of-Day → $662.85 (+0.31%)
📈 Extended Outlook
Final Target: $662.85 (+0.31%)
Volatility: 3.4%
Range: $659.46
Short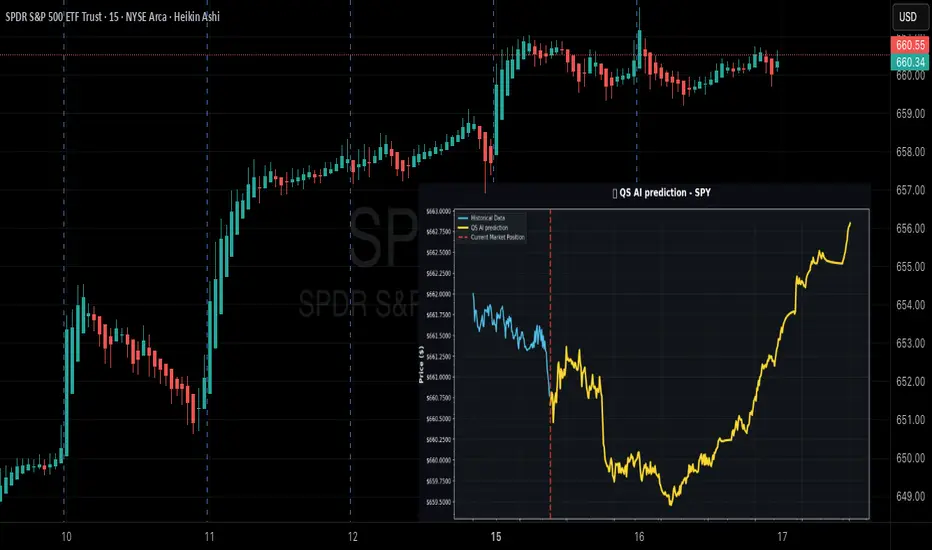
SPY 0DTE Bearish Setup – Max Pain in Play (Aug 7)## ⚠️ SPY 0DTE Bearish Setup – Max Pain in Play (Aug 7)
**Low-Conviction Market = Short-Term Put Opportunity?**
### 🧠 Summary of Consensus:
All major models (Grok, Gemini, Claude, Llama, DeepSeek) flag the **lack of bullish momentum**.
💡 **Key Bearish Signals**:
* 📉 Price below VWAP
* 📊 Weak volume
* 📉 RSI & flow: neutral to bearish
* 🎯 Max pain hovering near current price
---
### 🤖 AI Model Breakdown:
| Model | Bias | Action |
| -------------
Short
SPX 0DTE TRADE IDEA – JULY 25, 2025
⚠️ SPX 0DTE TRADE IDEA – JULY 25, 2025 ⚠️
🔻 Bearish Bias with Weak Volume – Max Pain Looming at 6325
⸻
📊 Quick Market Snapshot:
• 💥 Price below VWAP
• 🧊 Weak Volume
• 📉 Max Pain @ 6325 = downside pressure
• ⚖️ Mixed Options Flow = no clear bullish conviction
⸻
🤖 Model Breakdown:
• Grok/xAI: ❌ No trade – weak momentum
• Claude/Anthropic: ✅ Bearish lean, favors PUTS near highs
• Gemini: 🟡 Slightly bullish bias, BUT agrees on caution
• Llama: ⚪ Neutral → No action
• DeepSeek: ❌ Beari
 Short

SPY Options Analysis Summary (2025-07-22)
🔻 AMEX:SPY Weak Bearish Put Setup (0DTE) – 07/22/25
All models agree: price is weak, momentum is limp, and VWAP is above.
But conviction? Not unanimous. High-risk, high-reward 0DTE scalpers only.
⸻
📉 Trade Setup
• 🟥 Direction: PUT
• 🎯 Strike: $626.00
• 💵 Entry: $0.57
• 💰 Target: $1.70 (+200%)
• 🛑 Stop: $0.28 (–50%)
• 📅 Expiry: Today (0DTE)
• ⚖️ Confidence: 65%
• ⏰ Entry Timing: Market Open
⸻
🧠 Multi-AI Consensus
Model Bias Action
Grok/xAI Weak Bearish ⚠️ No Trade
Claude Weak Bea
Short
SPY Breakout Watch: Triangle Pressure Builds Above 590SPY has surged in a strong V-shaped recovery from the March low of ~480 to testing major resistance around 595–600. The daily chart shows sustained higher highs and higher lows, but price now stalls at a key supply zone with multiple doji candles—signaling indecision. A rising trendline provides strong support near 570.
Zooming into the 60-minute chart, SPY forms an ascending triangle with flat resistance at 590 and rising support from 584. Volume contraction suggests accumulation, priming a po
Long
SPY Technical Outlook – Bullish Continuation Favored Above $584SPY remains in a strong uptrend, confirmed by a bull flag breakout on the daily chart, with price currently testing the $588–590 resistance zone. A rising channel on the hourly chart has guided price since early May, with repeated bounces off the lower trendline around $578–582. Recent volume expansion on breakouts reinforces bullish conviction.
On the 15-minute chart, a breakout and retest setup around $585–586 suggests a low-risk intraday long opportunity. The intraday VWAP and moving average
Long
SPY in Focus: Tactical Day Trading Amid a Bullish RecoveryAs of early May, SPY consolidates around $560–$570, testing former support-turned-resistance.
On the daily chart, the market is pausing after a rapid rally, with $610 as major resistance and $540–$485 as key support. The 1-hour chart reflects a solid uptrend with recent consolidation between $555–$568, while the 15-minute chart shows intraday weakness with critical support at $560.
Three trading strategies emerge: (1) Bullish breakout, buying above $564–$568 with targets up to $580;
(2) Beari
Long
Expired SPY Weekly outlook. 1st WK DEC 2024Expired SPY Weekly outlook. 1st WK DEC 2024
> BULLISH 📈 HIT
Prior Week Closed Price: 598.79
This Week Target Price: 605
Strike Price: 606.26 on DEC 4, 2024
Upper Range: 612
Lower Range: 597
Long
Expired SPY Weekly outlook. 3rd WK NOV 2024Expired SPY Weekly outlook. 3rd WK NOV 2024
> BULLISH 📈 HIT
Prior Week Closed Price: 585.75
This Week Target Price: 587
Strike Price: 590.30 on NOV 19, 2024
Upper Range: 600
Lower Range: 574
Long
Expired SPY Weekly outlook. 2nd WK NOV 2024Expired SPY Weekly outlook. 2nd WK NOV 2024
> BEARISH 📉 HIT
Prior Week Closed Price: 600.05
This Week Target Price: 597
Strike Price: 594.57 on NOV 12, 2024
Upper Range: 610
Lower Range: 584
#weekly2ndNOV2024 #spy AMEX:SPY #putiq
Short
SPY S&P 500 ETF End of the Year Price Target If you haven`t bought the recent dip on SPY:
Now with Goldman Sachs lowering U.S. recession odds from 20% to 15% and raising their 2024 year-end S&P 500 target to 6000 from 5600, the outlook for the market appears increasingly optimistic.
The reduced recession risk suggests stronger economic stability, and the upward revision in the S&P target points to continued growth potential.
Given these factors, I agree that a year-end price target of 600 on SPY is achievable.
Long
Comprehensive Technical Analysis: SPX 10-Minute ChartThis SPX 10-minute chart shows a clear intraday shift from a bearish to a bullish trend, accompanied by multiple technical signals. Let’s break down the analysis across different technical components:
1. Trend Analysis:
Initial Downtrend: The session started with bearish momentum as indicated by Put Signals and declining price action. The lower lows created a brief bearish trend that ended with a strong reversal.
Bullish Reversal: The reversal is confirmed by a series of Call Signals after a s
Long
Expired SPY Weekly outlook. 4th WK OCT 2024Expired SPY Weekly outlook. 4th WK OCT 2024
> BULLISH 📈 HIT
Prior Week Closed Price: 584.59
This Week Target Price: 587
Strike Price: 586.12 on OCT 24, 2024
Upper Range: 599
Lower Range: 575
Long
Expired SPY Weekly outlook. 1st WK OCT 2024Expired SPY Weekly outlook. 1st WK OCT 2024
> BULLISH 📈 HIT
Prior Week Closed Price: 571.47
This Week Target Price: 573
Strike Price: 574.36 on SEP 30, 2024
Upper Range: 582
Lower Range: 564
Long
Expired SPY Weekly outlook. 4th WK SEP 2024Expired SPY Weekly outlook. 4th WK SEP 2024
> BULLISH 📈 HIT
Prior Week Closed Price: 568.25
This Week Target Price: 571
Strike Price: 574.02 on SEP 26, 2024
Upper Range: 580
Lower Range: 563
Long
Expired SPY Weekly outlook. 3rd WK SEP 2024Expired SPY Weekly outlook. 3rd WK SEP 2024
> BULLISH 📈 HIT
Prior Week Closed Price: 561.96
This Week Target Price: 564
Strike Price: 565.97 on SEP 17, 2024
Upper Range: 587
Lower Range: 541
Long
Oops SPY Bear dance might have just begun.We are seeing some really impulsive moves coming up and at this point it really important to trade with the trend. A complete analysis coming in soon.
Short
Is this the Beginning of the Flip? Just KiddingFrom what we can see it appears that we are just at the beginning of a bear move here and that might be quite an aggressive move. pay attention to the $550 level here and if we stay at that or below it, we should a steep curve to the bears in the next few days here.
Short
SPY 10-Minute Chart Analysis - September 3, 2024AMEX:SPY The SPY has been trading in a well-defined range over the past few sessions, bouncing between support and resistance levels like a pinball. Right now, we’re seeing a key moment where SPY is testing the lower boundary of its trading range.
Current Setup:
Resistance Zone: The upper boundary around 5,641 has consistently acted as a ceiling for SPY. Every time the price reaches this level, it gets knocked back down, indicating strong selling pressure.
Support Zone: On the other end, the
Long
Why ORB and VWAP Have a High Success Rate - Part 2Previously in the Opening Range Breakout (ORB) and the Volume Weighted Average Price (VWAP). In Part 1, we dove into the basics and all the important aspects of the ORB, but now let's explore why these strategies often lead to high win rates.
The Psychology Behind ORB
The ORB is powerful because it captures the market's initial reaction to overnight news and pre-market sentiment. Think of it like the opening scene of a movie: it sets the tone for what’s to come. When the market breaks above o

SPY 2-Hour Chart Analysis - August 28, 2024Double Trouble is the name of the game here, and it’s no joke. As you can see SPY just dipped below a critical support level, and things could get tricky if buyers don’t step in soon.
What’s Happening?
SPY has been bouncing around within a tight range for the past few days, but today’s action saw it break below the 554.93 support level (highlighted by the yellow dashed line). This level has been key in holding the price up, and now that it’s breached, we could be in for a rough ride.
Why Doubl
Short
Expired SPY Weekly outlook. 3rd WK AUG 2024Expired SPY Weekly outlook. 3rd WK AUG 2024
> BULLISH 📈 CORRECT
Prior Week Closed Price: 554.31
This Week Target Price: 559.79
Strike Price: 562.72 on AUG 22, 2024
Upper Range: 569.59
Lower Range: 549.99
Long
SPY Analysis Across Multiple Timeframes | AugustLike we have seen from the video above lets have some talks on these timeframes and see whar the analysis says.
Weekly Timeframe:
SPY is currently hovering around 533.27, which is near the top of its long-term uptrend. We’ve seen a slight pullback from the recent highs, which isn’t surprising given how strong the rally has been. If the pullback deepens, keep an eye on 523.97 as the first line of support. Should the price drop further, 514.09 could come into play as a stronger support. On the up
Short