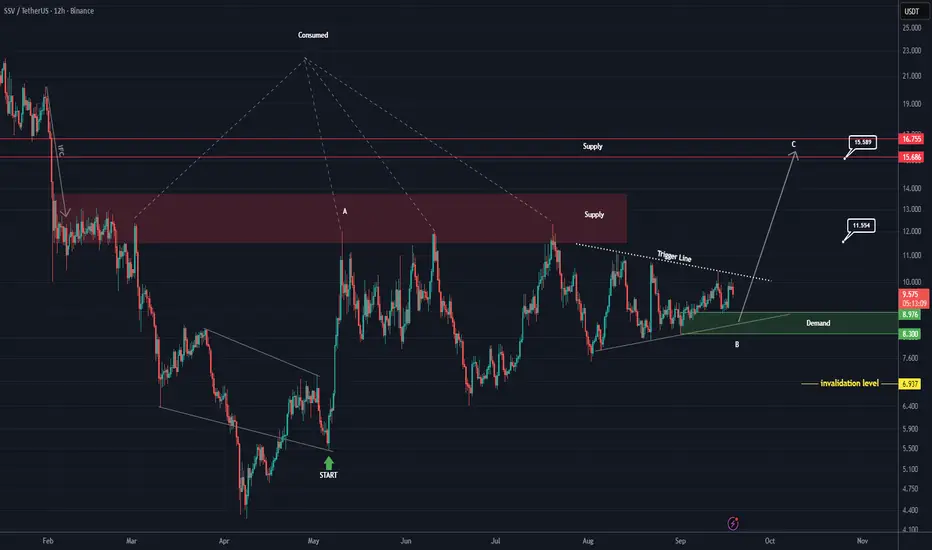
SSV Looks Bullish (12H)A supply zone has been highlighted on the chart. This supply has been consumed many times, yet no lower low has been formed. Also, from the point where we marked it on the chart, a bullish move started. After this bullish move, the price is currently forming a range. It seems that the initial move is wave A of the new pattern, and the ranging move is wave B.
As long as the green zone holds, the price can move toward the targets. Once the trigger line is broken, we will have further confirmations.
A daily candle closing below the invalidation level will invalidate this analysis.
For risk management, please don't forget stop loss and capital management
When we reach the first target, save some profit and then change the stop to entry
Comment if you have any questions
Thank You
Ssvanalysis
SSV (SPOT)BINANCE:SSVUSDT
#SSV/ USDT
Entry range (8.60- 9.19)
SL 4H close below8.35
T1 11.90
T2 15.00
_______________________________________________________
Golden Advices.
********************
* collect the coin slowly in the entry range.
* Please calculate your losses before the entry.
* Do not enter any trade you find it not suitable for you.
* No FOMO - No Rush , it is a long journey.
