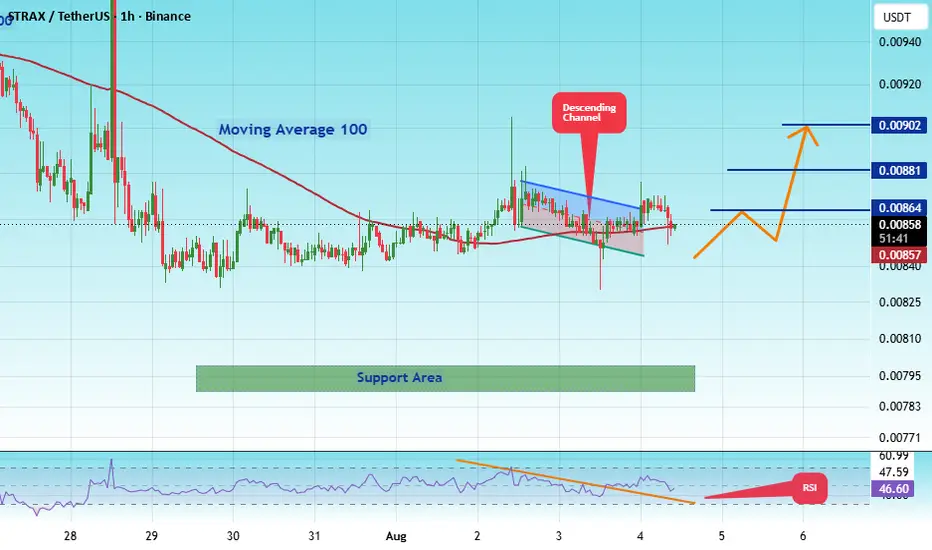
#STRAXUSDT — Descending Triangle at Demand Zone!#STRAX
The price is moving within a descending channel on the 1-hour timeframe and has reached the lower boundary. It is now poised for a bounce and is expected to retest this boundary.
The Relative Strength Index (RSI) indicates a downward trend, which is likely to continue given the overbought conditions.
There is a key support zone in green at 0.00790. The price has bounced off this zone several times, making it a strong support level.
The price is trending towards the 100-period moving a
STRAXETH
#STRAXUSDT — Descending Triangle at Demand Zone!#STRAX
The price is moving within a descending channel on the 1-hour timeframe and has reached the lower boundary. It is now poised for a bounce and is expected to retest this boundary.
The Relative Strength Index (RSI) indicates a downward trend, which is likely to continue due to overbought conditions.
A key support zone has been identified in green at 0.00785. The price has bounced off this zone several times, making it a strong support level.
The price is trending towards the 100-period
#STRAXUSDT — Descending Triangle at Demand Zone!#STRAX
The price is moving within a descending channel on the 1-hour timeframe and has reached the lower boundary. It is now poised for a bounce and is expected to retest this boundary.
The Relative Strength Index (RSI) indicates a downward trend, which is likely to continue given the overbought conditions.
There is a key support zone (in green) at 0.01150. The price has bounced off this zone several times, making it a strong support level.
The price is trending towards the 100-period moving