#STRAXUSDT — Descending Triangle at Demand Zone!#STRAX
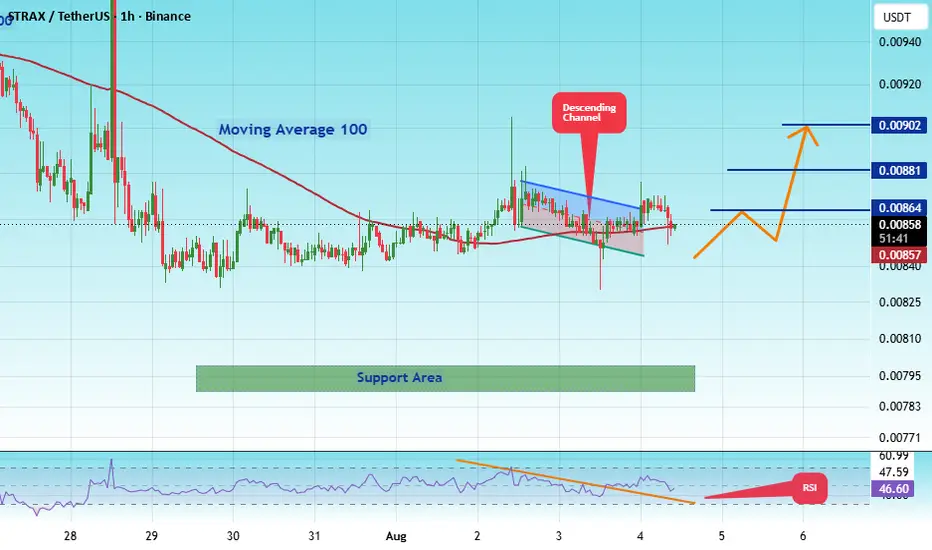
The price is moving within a descending channel on the 1-hour timeframe and has reached the lower boundary. It is now poised for a bounce and is expected to retest this boundary.
The Relative Strength Index (RSI) indicates a downward trend, which is likely to continue given the overbought conditions.
There is a key support zone in green at 0.00790. The price has bounced off this zone several times, making it a strong support level.
The price is trending towards the 100-period moving a
STRAXUSDT
#STRAXUSDT — Descending Triangle at Demand Zone!#STRAX
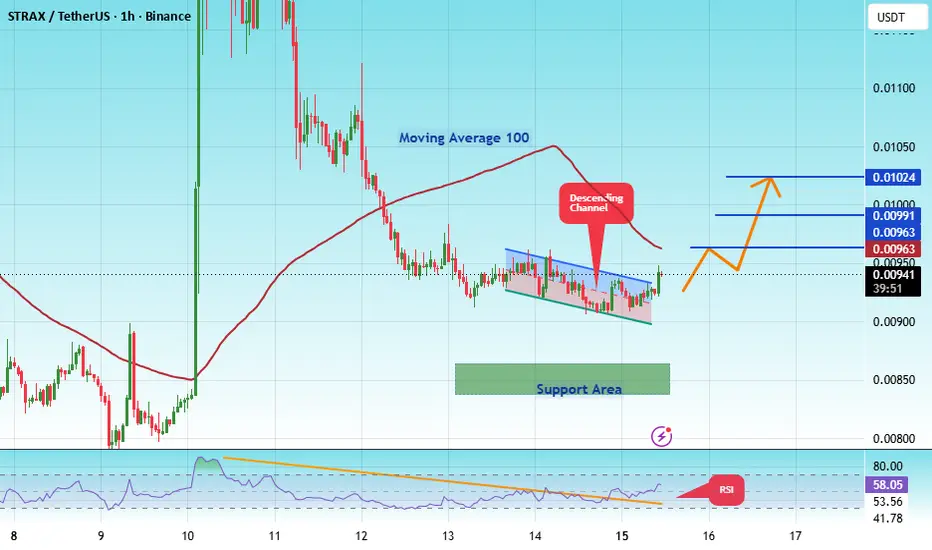
The price is moving within a descending channel on the 1-hour timeframe and has reached the lower boundary. It is now poised for a bounce and is expected to retest this boundary.
The Relative Strength Index (RSI) indicates a downward trend, which is likely to continue due to overbought conditions.
A key support zone has been identified in green at 0.00785. The price has bounced off this zone several times, making it a strong support level.
The price is trending towards the 100-period
#STRAX/USDT — Descending Triangle at Demand Zone!#STRAX
The price is moving within a descending channel on the 1-hour timeframe and has reached the lower boundary. It is now poised for a bounce and is expected to retest this boundary.
The Relative Strength Index (RSI) indicates a downward trend, which is likely to continue given the overbought conditions.
There is a key support zone in green at 0.00840. The price has bounced off this zone several times, making it a strong support level.
The price is trending towards the 100-period moving a
#STRAXUSDT — Descending Triangle at Demand Zone!#STRAX
The price is moving within a descending channel on the 1-hour timeframe and has reached the lower boundary. It is now poised for a bounce and is expected to retest this boundary.
The Relative Strength Index (RSI) indicates a downward trend, which is likely to continue given the overbought conditions.
There is a key support zone (in green) at 0.01150. The price has bounced off this zone several times, making it a strong support level.
The price is trending towards the 100-period moving
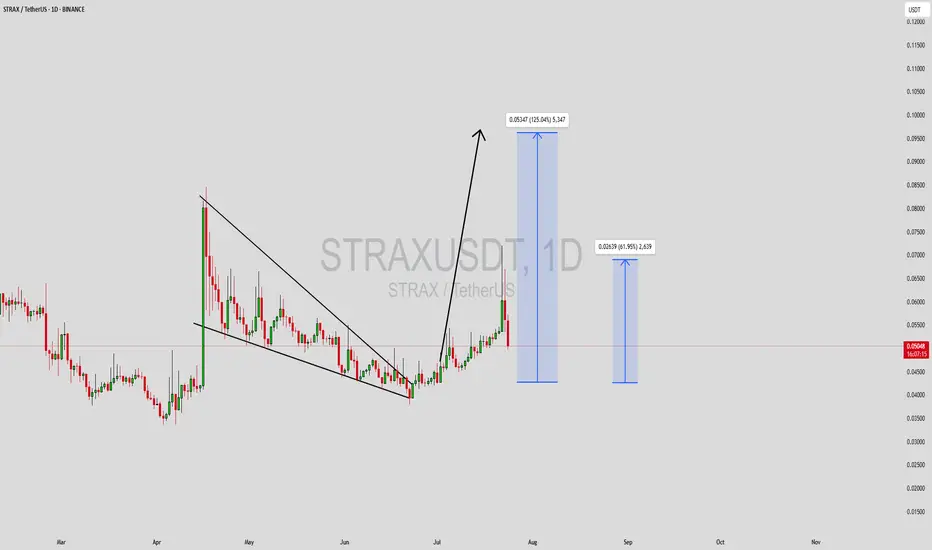
STRAXUSDT Forming Falling WedgeSTRAXUSDT is forming a clear falling wedge pattern, a classic bullish wave signal that often indicates an upcoming breakout. The price has been consolidating within a narrowing range, suggesting that selling pressure is gradually weakening while buyers are beginning to regain control. With consistent volume confirming accumulation at lower levels, the setup hints at a potential bullish breakout in the near future. The projected move could lead to an impressive gain of around 70% to 80% once the
#STRAX/USDT — Descending Triangle at Demand Zone!#STRAX
The price is moving in a descending channel on the 1-hour timeframe. It has reached the lower boundary and is heading towards breaking above it, with a retest of the upper boundary expected.
We have a downtrend on the RSI indicator, which has reached near the lower boundary, and an upward rebound is expected.
There is a key support zone in green at 0.02060. The price has bounced from this zone multiple times and is expected to bounce again.
We have a trend towards consolidation above
STRAXUSDT Forming Falling WedgeSTRAXUSDT is forming a clear falling wedge pattern, a classic bullish reversal signal that often indicates an upcoming breakout. The price has been consolidating within a narrowing range, suggesting that selling pressure is weakening while buyers are beginning to regain control. With consistent volume confirming accumulation at lower levels, the setup hints at a potential bullish breakout soon. The projected move could lead to an impressive gain of around 140% to 150% once the price breaks above
STRAXUSDT Forming Descending WedgeSTRAXUSDT is showing strong technical potential as it forms a classic descending wedge pattern on the chart. This pattern is typically viewed as a bullish reversal signal, suggesting that the downtrend may be nearing exhaustion and a breakout to the upside is likely. With the price compressing within the wedge and volume remaining steady, STRAX appears to be coiling for a major move. The current market structure indicates a high-probability setup with an expected gain of 90% to 100%+ if a breako
#STRAX/USDT#STRAX
The price is moving within a descending channel on the 1-hour frame and is expected to break and continue upward.
We have a trend to stabilize above the 100 moving average once again.
We have a downtrend on the RSI indicator that supports the upward move with a breakout.
We have a support area at the lower limit of the channel at 0.04263, acting as strong support from which the price can rebound.
Entry price: 0.04262
First target: 0.04311
Second target: 0.04311
Third target: 0.04426
Stratis Reveals A Bullish Bias Across The AltcoinsThe market is set to resume growing, the proof is in the charts. Stratis (STRAXUSDT) was one of the first projects to move strongly after its 7-April low. Here you can see a 150% jump within 10 days.
This type of move always reveals two things. The start of the next bullish cycle and the fact that the bottom is in. Both are one and the same.
Once the bottom hits, only growth is possible or else the bottom is not in. Once a new bullish cycle starts, then there can't be any new lows so the last
STRAXUSDT Forming Falling Wedge STRAXUSDT is displaying a textbook falling wedge pattern on the daily chart, a formation widely recognized for its bullish reversal potential. After an explosive move upward earlier this quarter, the price has been consolidating in a downward-sloping wedge, tightening near a crucial support level. This type of market structure typically precedes a breakout, and the chart currently projects a potential move of 90% to 100% or more to the upside. This setup is attracting growing interest from trade
#STRAX/USDT#STRAX
The price is moving within a descending channel pattern on the 4-hour frame, which is a retracement pattern
We have a bounce from a major support area in the color EUR at 0.0600
We have a tendency to stabilize above the Moving Average 100
We have an upward trend on the RSI indicator that supports the rise and gives greater momentum, upon which the price depends
Entry price is 0.0610
The first target is 0.0670
The second target is 0.0749
The third goal is 0.0832
Stratis: The Altcoins Bull Market Is HereLet me show you this price pattern and dynamic because it is great, it reveals what is coming to all of the Altcoins available for trading within the Altcoins market.
» Stratis (STRAXUSDT) peaked in December 2024. The same as with the rest of the market.
» After this high a correction developed. This is true for 99% of the trading pairs.
» There was a major low in February 2025. Another low mid-March 2025. Finally, an All-Time Low happened on the 7th of April. This is true for many other Altc
#STRAXUSDT Bullish Breakout: Aiming for 220% Gain!#STRAX is currently breaking out above the 35 EMA and the resistance trendline. With only 8 hours and 28 minutes left until the daily candle closes, STRAX must close above the resistance trendline for bullish confirmation.
The price is within the accumulation range, and a rally toward the primary resistance at $0.573 is likely.
In a bearish scenario, accumulating STRAX between $0.0345 and $0.0436 could be considered a worthwhile buying opportunity.
Key levels:
- Confirmation: A breakout abov
#STRAX/USDT#STRAX
We have a bearish channel pattern on a 12-hour frame, the price moves within it and adheres to its limits well
We have a green support area at 0.0700 after the price touched it and bounced from it
We have a tendency to stabilize above moving average 100
We have an uptrend on the RSI indicator that supports the price higher
Entry price is 0.0800
The first target is 0.0886
The second goal is 0.0976
the third goal is 0.1068
#STRAX/USDT#STRAX
The price has been trading in a descending triangle since January 2022
And the descending triangle was broken strongly.
Powered by Moving Average fraction 100.
And overselling on MACD
We are now at the first goal 1.277.
Expects a correction to 1.06 before completing the growth.
For the second goal 1.645
#STRAX/USDT#STRAX
The price is moving in a downward channel on a 1-day frame
We have a trend of breaking moving average 100 to the upside
We have a major support area at the 0.800 level
We have a positive divergence on RSI
Entry area 0.917
The first goal is 0.974
The second goal is 1.087
Fourth goal 1.20
STRAXUSDTSTRAXUSDT is in strong bullish trend.
As the market is consistently printing new HHs and HLs.
currently the market is retracing a bit after last HH, which is 50% Fib retracement level and local support as well. if the market successfully sustain this bullish confluence the next leg high could go for new HH.
What you guys think of this idea?
STRAX: Building Momentum for a Breakout! 🚀💹Introduction: 🌐 STRAX is under the spotlight as the trader strategically accumulates for potential gains! The coin has been consolidating within the historical resistance zone of $1.19 - $1.27 for the past two months. With substantial accumulation and significant volumes, the trader anticipates an impending breakout, projecting bullish momentum in the coming weeks.
Trade Plan: ✅ The trader has acquired a mid-term position on STRAX, observing the coin's consolidation near the historical resistan
S
Stratis (STRAX) forming a bullish Gartley for the next pumpHi dear friends, hope you are well and welcome to the new trade setup of Stratis (STRAX) coin with US Dollar pair.
Recently we caught almost 190% pump of STRAX as below:
Now on a 4-hour time frame, STRAX has formed a bullish Gartley move for the next bullish reversal.
Note: Above idea is for educational purpose only. It is advised to diversify and strictly follow the stop loss, and don't get stuck with trade.
STRAXUSDT|Trying to buy back the fallHello trader! Today I have a new idea for you. Like and subscribe to the channel, there is a lot of useful information there.✅
After a strong strait, you can try to enter Long with a small volume! 1-2% of the deposit with a leverage of 2-3X.
Deal plan:
Entrance - 0.908/888$
Stop - $827, taking into account the good there will be less stop!
Take - 0.987, fix 50% of the position, stop in used!
Guys, the coin is extremely volatile, be careful and follow your risk management!
Spotting the Highs and LowsSTRAX on the 1-hour chart has shown signs of consolidation post a significant upward rally. The juxtaposition of various technical indicators suggests a mix of bullish and bearish cues, making it imperative to keep an eye on established levels.
Technical Indicators Overview:
Bollinger Bands: The price nearing the upper band often implies strong bullish momentum. However, it can also suggest a potential pullback or consolidation in the near term.
Parabolic SAR : Its position above the pri