EUR/USD: Dollar pressure, but support is close.EUR/USD starts October under pressure from a stronger US dollar. Rising US Treasury yields, higher oil prices and inflation concerns are currently influencing the currency market, while traders are also waiting for fresh US labor market data. The dollar has moved to a 17-month high, while the euro is trading close to its lowest level since May 2025. At the same time, stronger eurozone manufacturing data is providing some support for the euro, keeping the broader picture mixed.
On the daily char
Supllyanddemand
Bitcoin: Recovery Is Testing the Key Resistance ZoneBitcoin is showing a strong recovery after holding the $66.8K–69.2K support area, with price now trading around $75K and moving back above the short-term moving averages. The technical structure on the daily chart suggests that the correction may be developing into a new recovery leg, but BTC is approaching an important resistance area around $82K.
This level coincides with the marked supply/resistance zone and the previous breakdown area, making a breakout and daily close above $82K important
TQQQ: Key Level for Further UpsideTQQQ is a 3x leveraged ETF tracking the Nasdaq-100, which means market moves are amplified while volatility and risk are significantly higher than with a standard ETF.
Fundament:
TQQQ is highly dependent on the Nasdaq-100 and the performance of the U.S. technology sector. Because of daily leverage and rebalancing, its long-term performance can differ significantly from simply multiplying the Nasdaq-100 return by three.
Technique:
1D. After the correction, price formed support around $69–70 a
Gold: Bullish Breakout SetupGold is holding above the 4H EMA 20/50/100/200 structure, confirming a bullish trend after the strong breakout from the 4,200–4,240 accumulation zone. Price is now consolidating below the 4,439 resistance, while the recent CCI structure shows signs of bullish divergence. The key buy zone is 4,321–4,378, with a deeper pullback toward 4,226 remaining valid for the bullish scenario. A confirmed breakout and retest above 4,439 could open the way toward 4,546 and 4,645, with 4,670 as the Fibonacci ex
USDJPY Long-Term Uptrend Still IntactThe USDJPY daily chart continues to respect its long-term ascending channel despite the recent correction from the 163–164 resistance zone. Price has reached one of the strongest technical support areas around 156.10–152.10, where multiple confluences come together. This zone is supported by the lower boundary of the rising channel, Fibonacci retracement levels, previous swing highs, and dynamic moving averages. At the same time, the CCI has reached deeply oversold territory, a condition that ha
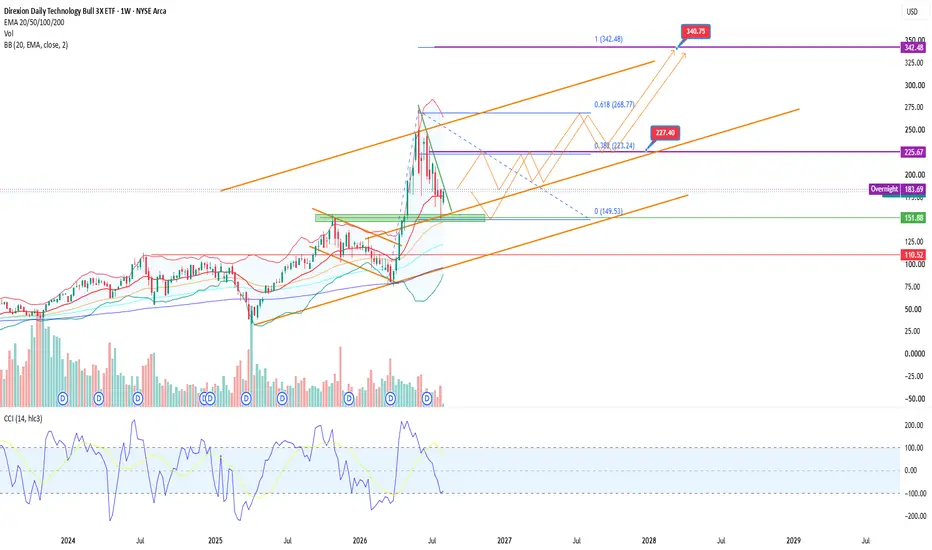
TECL: Is the correction creating a new opportunity?The Direxion Daily Technology Bull 3X ETF remains one of the most volatile ways to gain leveraged exposure to the U.S. technology sector. Long-term fundamentals continue to be supported by investment in artificial intelligence, cloud computing, semiconductors, and strong earnings from major technology companies. If the sector maintains its momentum, these factors could fuel the next bullish leg.
Technically, price is holding the key $150-152 support zone, where buyers previously stepped in. Aft
XAUUSD Buyers Continue to Defend Key SupportFollowing the recent correction, gold continues to hold above the important 4093–4100 support zone where buyers previously stepped into the market. Price is now consolidating inside a tightening range, suggesting that a larger directional move may be approaching. As long as this support remains intact, the probability of a bullish continuation remains higher than the bearish alternative. From a fundamental perspective, gold continues to benefit from expectations of future Federal Reserve rate cu
RKLB: Rocket Lab Ready for the next move?Rocket Lab continues to strengthen its position in the space industry. The company is increasing launch activity, expanding its space systems business, and developing the Neutron rocket, which could become a major long-term growth driver. If investor interest in the sector remains strong, the fundamentals continue to support the bullish outlook.
From a technical perspective, price is holding a strong demand zone at $57-65, where buyers have stepped in again. CCI is turning higher after a bullis
AMBQ | Consolidation Before the Next Move Higher?After a strong rally, price has entered a consolidation phase and is building a base around the 72-75 demand zone. As long as this area holds, the overall bullish trend remains intact. Price is trading above the EMA 100 and EMA 200, while the EMA 20 and EMA 50 continue to provide dynamic support. CCI is turning higher after recovering from oversold territory, which could become an early signal of renewed momentum. A breakout above 86.7 may open the way toward 95.5, 108.5 and 131. Losing the 72 s
Gold:Market Prepares for the Next Upside MoveGold:Buyers Defend Support as the Market Prepares for the Next Upside Move
After several corrective swings, gold continues to consolidate above the key support zone at $4,092–4,095. Price remains above the rising trendline, while the overall structure suggests that the current correction may be approaching completion before another bullish impulse. As long as this support holds, buyers maintain the technical advantage.
The first resistance is located near $4,131. A confirmed breakout above thi
SOXL: Pullback Within a Strong UptrendSOXL has entered a correction phase after a powerful rally and is currently testing the 225.50–226.74 support zone. Despite short-term selling pressure, the overall market structure remains bullish as long as price holds above 178.38. The current pullback may serve as a setup for the next upward leg. If support holds and buyers regain control, the main upside targets are 282.92, 343.93, and 412.76. A breakdown below 225.50 would increase the probability of a deeper correction toward 178.38. For
Smart Money Is Looking at Gold AgainGold remains one of the world's primary safe-haven assets and continues to attract capital during periods of uncertainty. Despite the recent correction, institutional interest remains strong due to expectations of future monetary easing, elevated government debt levels, and ongoing geopolitical risks. As a result, gold continues to be closely monitored by long-term investors and major hedge funds.
From a fundamental perspective, gold is supported by continued central bank purchases, growing dem
Micron: Memory Becomes the Key Growth DriverMicron Technology (NASDAQ: MU) is one of the global leaders in DRAM and NAND memory manufacturing, supplying products for servers, data centers, smartphones, and artificial intelligence systems. The company remains one of the primary beneficiaries of growing demand for computing power and AI infrastructure. As a result, Micron continues to attract significant attention from institutional investors and major Wall Street analysts.
From a fundamental perspective, the company is benefiting from str
XAIX: Buyers Remain in ControlThe Xtrackers Artificial Intelligence and Big Data ETF (XAIX) provides exposure to companies operating in artificial intelligence, big data, and digital infrastructure. The fund remains one of the most popular vehicles for investors seeking diversified exposure to the rapidly growing AI industry. As investment in artificial intelligence continues to accelerate, XAIX remains closely watched by both institutional and retail market participants.
From a fundamental perspective, the artificial intel
MIAX is building a new base for trend continuationAfter a strong impulsive rally, the stock entered a correction phase while continuing to hold above the key 46-44 support zone. The current structure appears to be an accumulation phase before another bullish move.
The trading plan is to consider long positions while price remains above 46-44 with potential upside toward 60 and later 73. The bullish scenario becomes invalid below 41.
From a technical perspective, price continues to trade above medium-term moving averages while the correction r
EURUSD shows potential for continued upside EURUSD shows potential for continued upside toward key resistance
The pair maintains a bullish structure after breaking out of a range and forming a strong upward impulse. The current pullback appears to be a retest of broken levels and the formation of a higher low, indicating continued buyer control.
The trading plan is to consider long positions in the 1.1650-1.1550 zone with a possible deeper pullback toward 1.1450. The scenario becomes invalid below 1.1400. The main upside target is locat
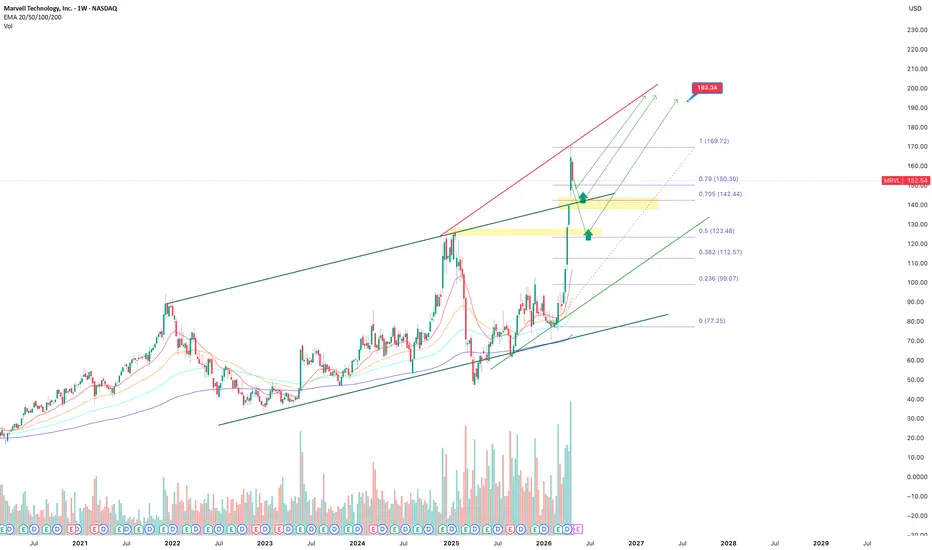
Marvell Technology maintains upside potential after correctionThe stock is forming a bullish structure following a strong upward impulse and a current pullback into a demand zone. Price is holding key levels and remains above long term trend support, indicating continued buyer control.
The trading plan is to consider long positions in the 145-140 zone with additional accumulation near 125. Upside targets are located around 170 and 190.
From a technical perspective, the asset is forming a higher low after the impulse, confirming trend continuation. Price
USDJPY Pullback into Demand Before Upside ContinuationUSDJPY is correcting after failing to sustain gains near the 158-159 resistance zone. The rejection from highs suggests temporary distribution, and price is now testing the 152 area. While this zone may provide short-term support, a deeper corrective move toward 149.0-150.0 remains possible, especially if bearish momentum accelerates. This area represents a stronger higher-timeframe support and liquidity zone.
From a structural perspective, the broader trend remains bullish, but the market may
DXY – H4 | Short-Side Technical ContextThe U.S. Dollar Index recently completed a corrective bullish channel following a strong impulsive decline. Price respected the rising channel structure but failed to sustain acceptance near the upper boundary, indicating weak continuation strength.
A decisive move lower has now occurred, with price breaking out of the bullish channel to the downside and revisiting a higher-timeframe Fair Value Gap (H4 FVG). This area is acting as a reaction zone rather than a continuation base.
🔍 Key Technica
XAUUSD: gold decides whether the impulse beginsGold remains in focus as markets reassess Fed rate expectations and macro uncertainty. Slowing economic signals and potential declines in real yields continue to support gold, while its safe-haven role persists without panic-driven flows. This creates consolidation phases before directional moves.
Technically, XAUUSD is trading within a bullish structure after a strong rebound from recent lows. Price holds above a key support zone aligned with former resistance and the 0.5 Fibonacci level. Vola
XAUUSD Price at Decision Point – Bounce or Breakdown?Gold (XAUUSD) is currently trading between two significant zones — a ⏫ 1H Order Block above and a 🛑 Major Support level at 3268.
At this stage, price action remains undecided, and we have a few key scenarios to monitor:
🔄 Potential Scenarios:
📌 Price taps into the 1H OB, then shows signs of rejection — this could trigger a move back down toward support.
⬇️ Price drops directly to 3268, where buyers may step in for a potential bounce.
🚀 If the price breaks through the OB, it may continue push
DXY (Dollar index) Shorts from 1hr supply zone My general outlook on the DXY this week leans bearish, as I expect price to continue trending lower. I’ve identified a nearby 1H supply zone, where we could see price react and begin pushing lower. There is also a larger supply zone further above, but it’s currently out of reach unless price pulls back significantly.
Looking back, the 2-day demand zone I marked over a week ago has played out well, with a strong bullish reaction from that level — price is still rising from that zone. During this
NOT buying USDCADThe USDCAD price has moved into the Daily sell zone, which suggests the possibility of new sell positions entering the market, potentially driving the price down. In the case that the zone is broken, there is a high likelihood of further price increases (which, in my opinion, is less likely).
For those looking to short, I would recommend looking for a simple breakout pattern on lower timeframes and participating accordingly. BUT make sure to wait until after the NFT news and observe what market
Notcoin heading to a supply zoneThe last analysis I made, there was a chance that GETTEX:NOT would break the trendlin of the descending triangle. But it didn't, so we saw a bearish move coming from it.
Secondly there was an ascending channel which implies a bearish stance which happened over the past days already. The last line of defence for $Notcoin to pump again, is an old supply zone.
If broken, Notcoin could revist it's lowest prices.