XAU/USD 4H Analysis: Structural Demand Hold & Key BoundariesXAUUSD 4H | Smart Money Concepts (SMC) Market Structure & Liquidity Analysis
Educational Candle-by-Candle Description With Reasons
1. Initial Downtrend & Bearish Pressure (Left Side)
Price opened with sustained selling pressure, forming consecutive bearish candles with lower highs and lower lows.
Reason:
Sellers controlled the early market structure, clearing minor liquidity pools while driving price toward a major institutional value zone.
2. Demand Zone Absorption & Rejection Wicks
Small-b
Supply-and-demand
XAUUSD | Gold Market Structure & Liquidity AnalysisXAUUSD | Gold Market Structure, Liquidity & FVG Analysis
This 1D Gold analysis presents a complete price-action study, focusing on candle-by-candle market behaviour, structural shifts, liquidity, Fair Value Gaps (FVGs), support and resistance, and major reaction zones
The chart begins with a strong bullish expansion, where consecutive candles created higher highs and higher lows. Buyers maintained control as price continued to break previous swing levels, producing multiple BOS confirmations.
XAUUSD Gold 1H Demand zone Revarsal setupXAUUSD / GOLD – 1H Technical Analysis 📊
Gold is currently approaching a strong Demand Zone around 4,310–4,335 after a significant bearish move. I’m watching this area for a potential bullish reaction.
📍 Demand Zone: 4,310–4,335
🎯 Potential Target: 4,690–4,700
📈 Scenario: If price respects demand and confirms a bullish reversal, the next major move could target the Supply Zone near 4,690.
⚠️ Wait for confirmation before entering and always manage risk properly.
This is a technical analysis sce
XAUUSD 1H Market Outlook|4H Order Block Rejection & Price Action
Gold is currently trading near a significant 4H Order Block after a strong bullish expansion from the recent demand area. Price has reached a higher-timeframe supply zone where sellers may become active, making this an important area to monitor for the next market reaction.
The chart highlights the key 4H Order Block, recent price structure, and major reaction levels that may influence the next directional move. The current structure suggests that price may attempt a short-term push higher in
Bearish Continuation:Mitigatio Retest at 4,060Targets Sell-SideXAUUSD: 4HR Order Block Invalidation – Mitigation Retest for Drop to 3,960
Market Overview
Analyzing the latest structural movement on the 1H chart, Gold has officially invalidated the 4HR Order Block (4,040.00 – 4,065.00) by breaking below its support floor.
This structural break shifts the order block into a Bearish Breaker Zone. We are anticipating a minor pullback to retest the underside of this zone (mitigation) around 4,055.00 – 4,060.00, providing a high-probability short entry to target
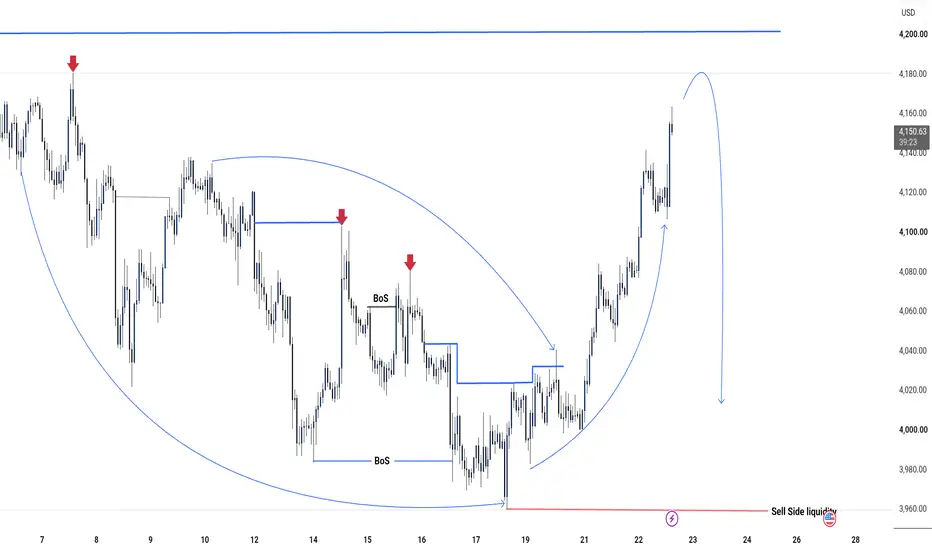
XAUUS MMBM ParabolicCurve Nears Completion at 4,200 Major supplyTechnical Breakdown
1. Accumulation & Curve Structure
The Sweep (Origin): The bottom of the curved formation marks the decisive raid on Sell Side Liquidity (3,960.00), which fueled the entire macro rally.
Buy-Side Curve: The large curved arrow illustrates the institutional shift from accumulation to aggressive expansion, systematically invalidating previous short-term resistance levels.
2. Target Supply & Liquidity Sweep (4,180 – 4,200)
Upcoming Sweep: The upward path points directly toward th
Bullish Expansion Setup: Lows Rejected + BoS!Technical Breakdown
1. The Liquidity Sweep & Accumulation Phase
Rejecting Lows: Price aggressively swept below previous lows (around the 3,960 level), indicated by the red horizontal line and the green arrow. This indicates institutional stop-hunting and liquidity collection.
Bullish Curve: Following the rejection, price formed a macro Bullish Curve, signaling a structural shift from selling pressure to steady accumulation.
2. Structural Shifts (The Bullish Confirmation)
Breaking Highs: Price
1HR FVG Rebalance + Liquidity Sweep: High-Probability Long Setup1. Sell-Side Liquidity Sweep (The Manipulation Phase)
BoS & Markdown: The structural break to the downside forced the market into a deep discount.
Rejection Low Sweep (~3,960.00): Price dipped below $3,960.00 to raid sell-side liquidity before printing a sharp rejection wick, confirming institutional absorption.
2. 1HR FVG Test & Liquidity Engineering
1HR FVG: The yellow shaded box marks a 1HR Fair Value Gap between 4,000.00 – 4,025.00. Price pulled back into this imbalance zone, reacting clea
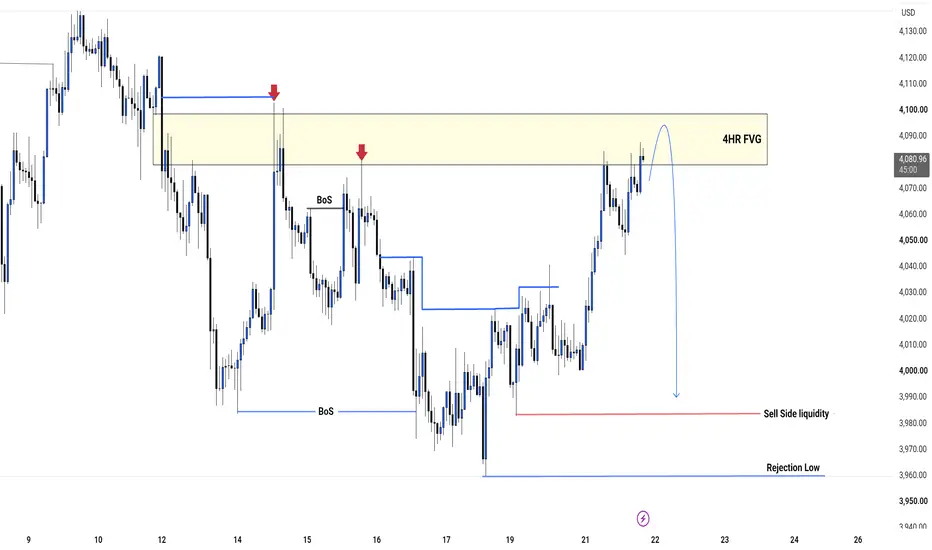
4HRFVG Mitigation Complete:Target Unlocked Sell-Side Liquidity 1. 4HR FVG Premium Mitigation
The Supply Zone: The yellow box highlights a dominant 4HR Fair Value Gap between 4,075.00 and 4,098.00.
Previous Rejections (Red Arrows): Notice how historical pushes into this zone (~4,095 and ~4,070) resulted in aggressive distribution down. Current price action is tapping the lower boundary of this major imbalance for a deep premium rebalance.
2. Buy-Side Completed & Structural Setup
Completed Expansion: The previous leg swept all internal buy-side stops on the
Market Structure Shift 1HR OB Mitigation Sets Up Next Drop 39501. Highs Swept & Institutional Distribution
The Red Arrows: The two red arrows highlight clear institutional distribution phases where liquidity was taken out at the local highs (~4,100 and ~4,070) before aggressive sell programs were initiated.
Liquidity Build-up: Minor trendline and internal buy-side liquidity were cleared on the way down, leaving clean structural targets below.
2. Structural Invalidation & The Supply Zone
1HR Order Block: The yellow highlighted zone (4,025.00 – 4,045.00) ma
2H): Premium Mitigation at 2HR OB Sets Up Next Drop to 28,865!1. The Bearish Shift (ChoCh & Rejection)
ChoCh (Change of Character): Early in the structure, price broke minor swing lows, confirming a shift from bullish to bearish sentiment.
The Red Arrow Rejection: A sharp rejection from the 30,018 liquidity level showed initial institutional selling presence, driving price down swiftly to hunt sell stops.
2. The 2HR Order Block & Mitigation
The Premium OB: The prominent yellow shaded box marks a crucial 2HR Order Block acting as a heavy supply zone betwe
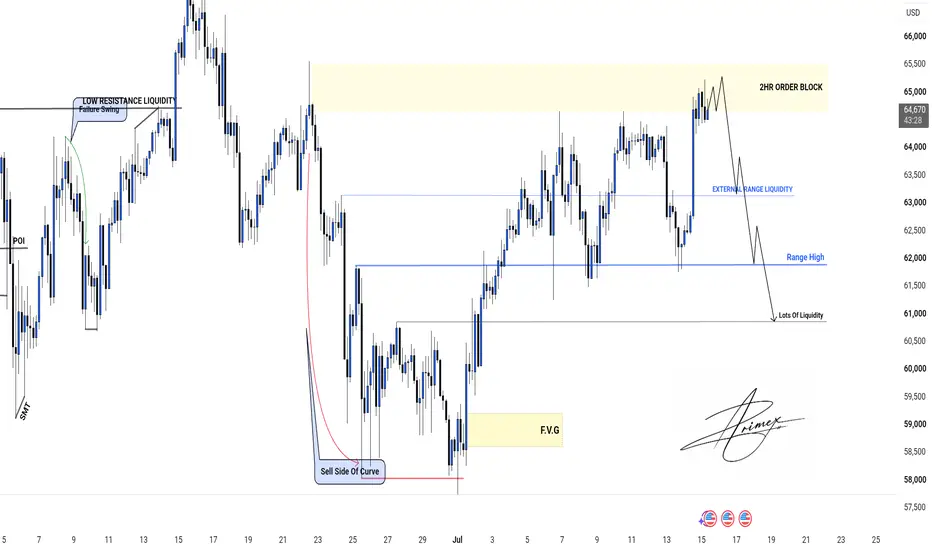
BTCUSD: Market Maker Sell Model (MMSM) Activated at 2HR OB!Technical Breakdown
1. Left Side of Curve (Origin of the Move)
SMT & POI: The initial phase started with a Point of Interest (POI) and SMT (Smart Money Technique) divergence at the lows, signaling institutional accumulation.
Low Resistance Liquidity / Failure Swing: Late sellers were trapped here, creating a pool of relatively clean highs that acted as a magnet for the subsequent rally.
Sell Side Of Curve: The market engineered a deep curve downward to clear out retail stops before starting the
SMC Structural Shift: Targeting Relative EQL HighsTechnical Breakdown
1. Liquidity Sweep & Displacement
The Sweep: Price aggressively took out the previous structural lows, dipping below 4,000 to hunt sell stops.
The Shift: Immediately after the sweep, a sharp, impulsive green candle pushed back upward, indicating strong institutional displacement and buying pressure.
2. The Dual 1HR Order Blocks
We have two high-probability demand zones highlighted in yellow:
First 1HR Order Block (Discount Zone): Located around the 4,020.00 – 4,035.00 range
The Flip is Real Market Structure Shifts Bearish Toward 3,959lowTechnical Breakdown
1. Liquidity Hunt & Double Rejection at Highs
The Red Arrows: Two prominent red arrows point out where institutions trapped late buyers. Price swept the liquidity near the Original Consolidation (~4,200) and created a lower high rejection around 4,175.
Distribution: This double rejection confirms that major sell orders were triggered at premium prices.
2. Aggressive Market Structure Shift
Price didn't hold the previous demand levels and melted straight through them, clearin
XAUUSD 30M: MBM Buy Curve | Target 4220 Macro Highs1. The Macro Market Maker Curve (Sell Side to Buy Side)
The Original Consolidation: The entire market structure originates from the premium yellow box at the top left (4,190 – 4,220), labeled "ORIGINAL CONSOLIDATEION". This is where institutional money heavily distributed short positions.
Sell Side Of Curve: The large red downward arc tracks the mechanical institutional markdown phase, completely sweeping internal retail support levels on its way down.
The Accumulation Floor: The markdown phase
BTC 1HR:MBM Buy Curve | Target 63K External Liquidity1. Sell Side of Curve Completed
The Markdown Campaign: The large red downward arc on the left tracks the complete "Sell Side Of Curve" phase. Institutional algorithms systematically stripped away internal support levels to deliver price into the lower ranges.
The Liquidity Sweep Floor: This aggressive sell-off terminated at the absolute structural floor around the $58,000 handle (marked by the solid red horizontal baseline). This represents the complete capture and purging of macro sell-stops.
Lowe's ($LOW) Retests Weekly Flip Zone — 3 Factors AlignedLowe's is trading at $220 — inside a weekly Flip Zone that the Blueprint system flagged as high quality. The former resistance at $219–$227 absorbed the sellers, converted to demand, and price has now returned to test it. This is a live entry.
What is a Flip Zone?
A Flip Zone is a former supply level that has been broken to the upside and retested from above. The logic: the same institutional players who defended supply are now defending demand at the same price. It is the highest-quality zon
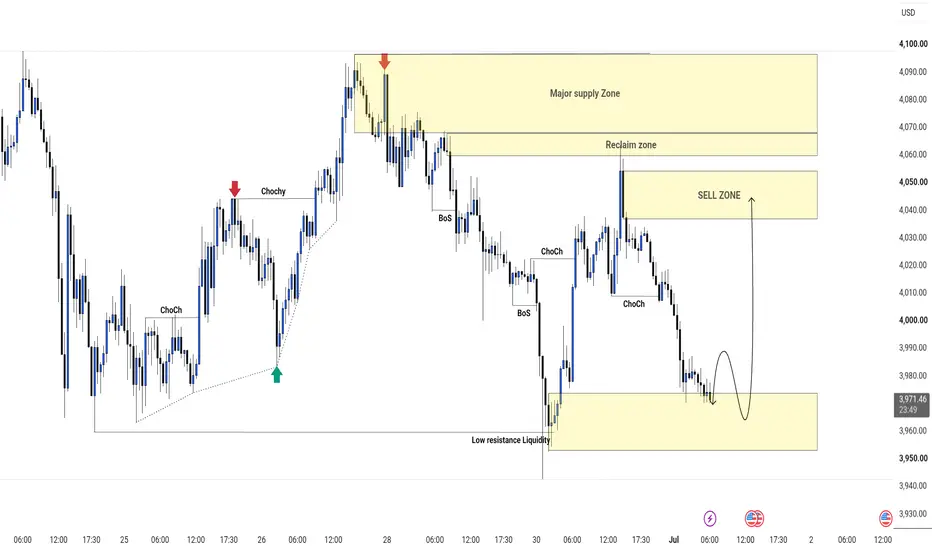
Gold 30M: Accumulation Floor After Sweep1. Structural Liquidity Purge & Floor Reclaim
The Markdown Cycle: Following a heavy distribution up in the Major supply Zone ($4,065 – $4,100) and a failure to hold the Reclaim zone, price initiated a sequence of lower lows and lower highs, clearly marked by consecutive BoS (Break of Structure) and internal ChoCh (Change of Character) points.
The Ultimate Target Cleared: The aggressive sell-off drove price straight down to take out the key historical floor. This swept the "Low resistance Liquidi
Market Structure Shift to Sell Side of Curve Completing the MMSM1. Market Maker Buy Curve Completed
The Accumulation Base: After driving lower to sweep historical sell-side liquidity, price established a structural floor around the 3,960 handle.
The Buy Side of Curve: A green arrow explicitly tracks the "Buy Side of Curve", marking the mechanical, higher-low bullish correction over the June 25th–26th sessions. This structural expansion served its institutional purpose: drawing retail buyers into the market and engineering a pool of counter-party liquidity
Gold:Sell Side of Curve Expansion Re-Shorting the 1HRFVG re-test1. Premium Distribution & Structural Breakdown
The Liquidity Trap: Price staged an aggressive expansion leg earlier in the week (marked by the green arrow), drawing in late breakout retail momentum buyers.
The Institutional Block: Once liquidity was gathered, price entered a massive distribution range labeled 1HR ORDER BLOCK (spanning roughly 4,035 to 4,060). The red arrow at the top confirms a sweeping rejection of the absolute highs (~4,095), pinning the institutional cap on the market.
The Sh
30M: Base Re-Accumulation Matrix – 30M OB Entry Under 60.1K1. Macro Framework & Structural Ranges
The Accumulation Base: The absolute low of the macro structure remains anchored by the "Weak low" sweep at the $58,000 floor, with the local range discount midline marked at 58,591 (0.5 Fib).
The Immediate Structural Ceiling: The key liquidity target for this current expansion leg is marked at the local swing-high resistance shelf of 62,332 (1 Fib).
The Premium Magnet: Farther up, the macro premium target remains the unfilled 30 MINT FVG resting right aroun
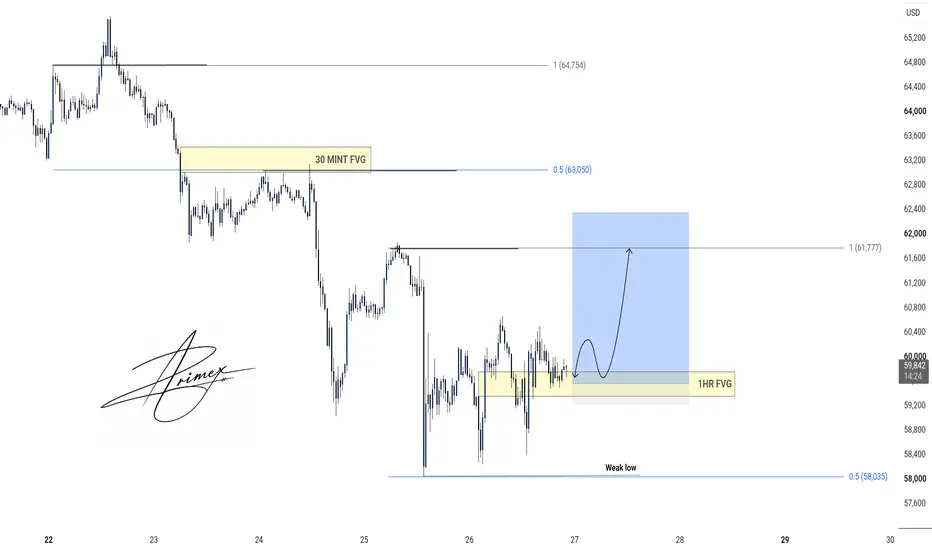
BTC30M:Tapping 1HR FVG Re-Accumulation Active for a Run to 61.7k1. Macro Liquidity Anchors & Structural Framework
The Weak Low Base: The absolute floor of the recent capitulation is clearly anchored at 58,035 (marked as a Fibonacci level 0.5). This level is explicitly labeled "Weak low", confirming that the heavy sell stops beneath it have been completely purged by institutional algorithms.
The Local Ceiling: The immediate swing high of this recovery phase is capped at 61,777 (marked as Fibonacci level 1).
The Overarching Efficiency Clues: Higher up on the c
30M: CISD Reclaim & Discount Dip | Long Matrix Active to 4140+ 1. Structural Reclaim & Premium-Discount Grid
The Liquidity Floor Confirmed: The absolute bottom of the structural expansion is anchored at 3,962.65 (marked as Fibonacci level 0), which successfully swept the major macro sell-side liquidity pool.
The Change in Character (CISD): Price violently rejected the lows, slicing through the CISD (Change in Institutional Market Structure Direction) level and breaking above a minor internal descending trendline. This explosive displacement confirms that in
2H: HTF Demand Tap & Sell-Side Liquidity Purge – Long Matrix1. The Liquidity Raid (The "Weak Low" Purge)
The Markdown Target Met: The prolonged decline from the mid-June trendline traps has extended lower, liquidating all remaining longer-term retail buyers.
The Weak Low Sweep: Price aggressively extended down to pierce the $3,960 – $4,000 key psychological handle. A rounded box explicitly marks the bottom of this structural purge as a "Weak low", confirming that this level was engineered by market makers strictly to act as a sell-side liquidity pool bef