#TAO/USDT ranges for long term break out#TAO
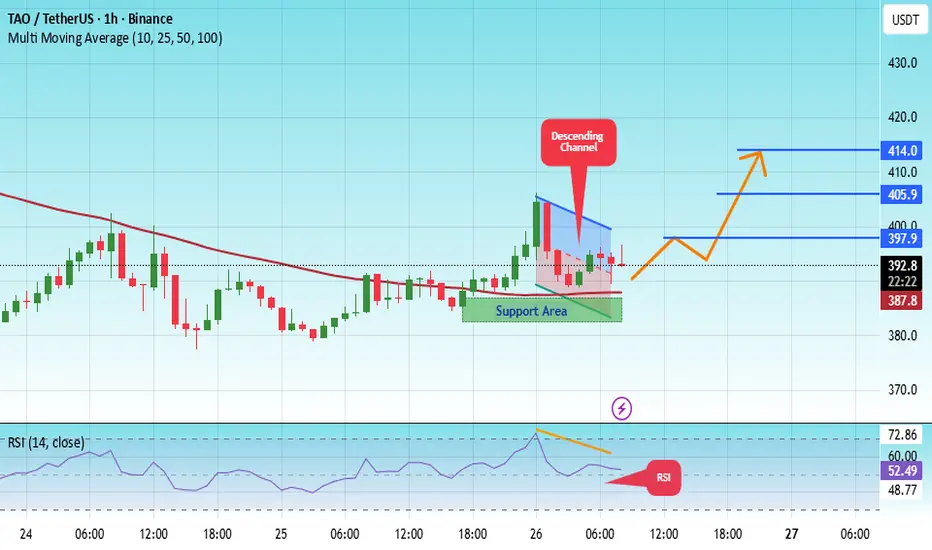
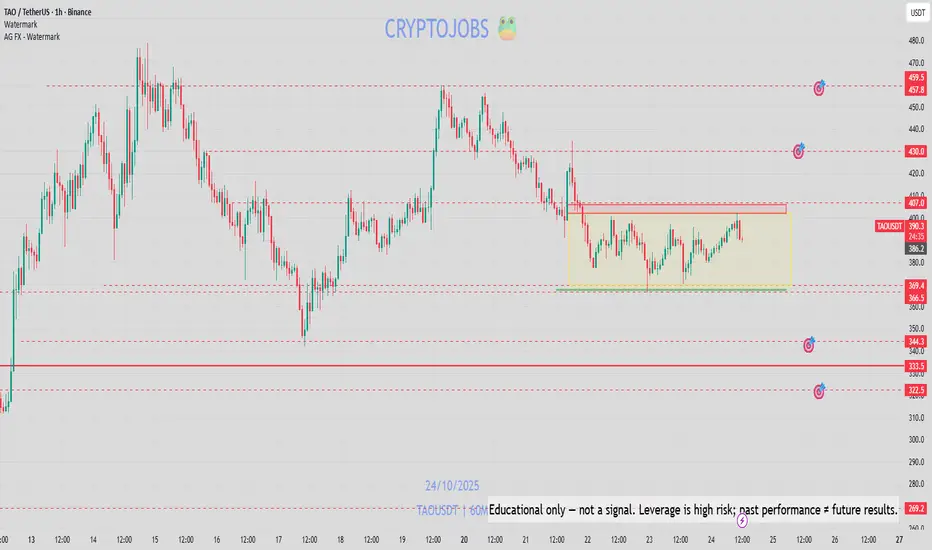
The price is moving within a descending channel on the 1-hour frame, adhering well to it, and is heading for a strong breakout and retest.
We have a bearish trend on the RSI indicator that is about to be broken and retested, which supports the upward breakout.
There is a major support area in green at 385, which represents a strong support point.
We are heading for consolidation above the 100 moving average.
Entry price: 393.3
First target: 397.90
Second target: 405.90
Third target: 414
Don't forget a simple matter: capital management.
When you reach the first target, save some money and then change your stop-loss order to an entry order.
For inquiries, please leave a comment.
Thank you.
TAOUSDT
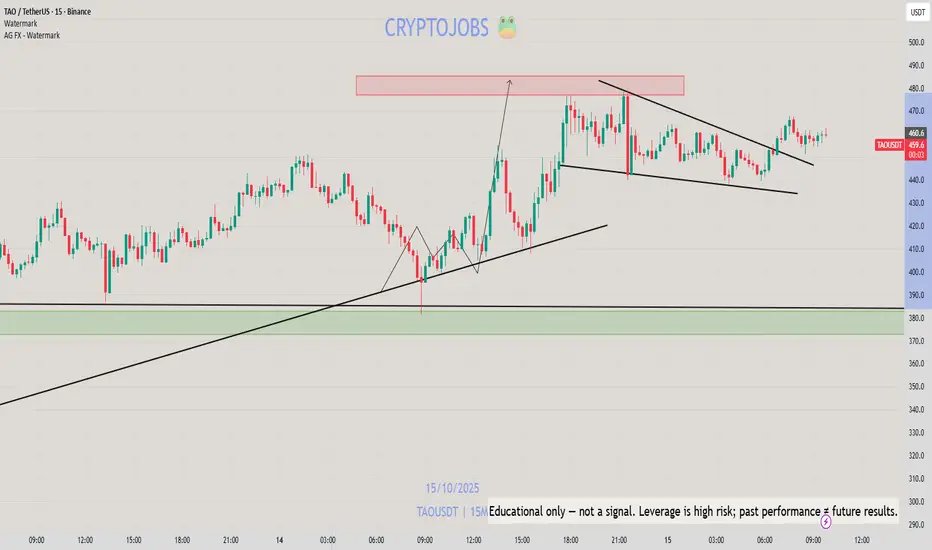
How to enter a successful futures tradeDrop everything and let me show you how to enter a successful long position with the lowest possible risk.
You need to understand that the market maker usually acts against us at major support areas on the chart — like the 100 EMA, 0.618 Fibonacci level, or a trendline.
To make this clearer, let’s take TAO as an example and I’ll explain why.
TAO has strong momentum and a large market cap,
so don’t apply what I’m about to say to meme coins, for example.
Now let’s go step by step on how to enter a futures position after choosing the coin 👇
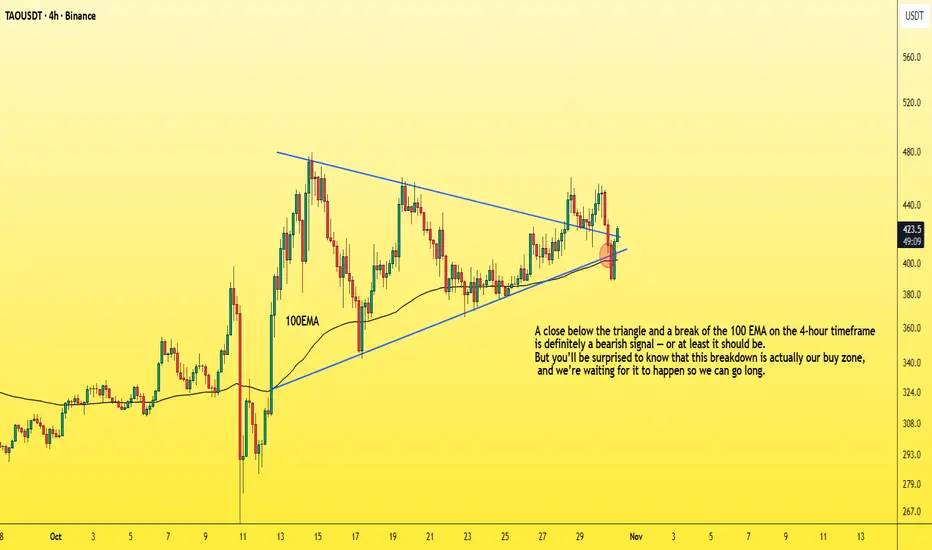
1. First, wait for a bullish pattern to form — like a triangle — and for the coin to break it upwards with increasing long momentum.
2. The price will then retest the trendline, encouraging people to enter with larger positions, and those who missed the first breakout will likely place buy orders at the retest zone.
3. Then, the market surprises them — it drops back inside the triangle, giving a small bounce at the lower side.
4. But it doesn’t stop there — it continues dropping, breaking below the triangle and closing below the 100 EMA on the 4-hour chart.
This makes you panic and close your long position.
Others start entering shorts thinking it’s a real breakdown.
5. That’s when the market reverses sharply upward,
trapping short traders in losses,
while long traders who exited too early also lose.
In the end, only those who placed buy orders slightly below the strong support level (not directly on it, like under the 100 EMA) — and of course the market maker — end up winning.
So basically, the long traders lose, the short traders lose,
and only a small percentage of smart traders and the market maker win.
Small things to pay attention to 👇
-Your entry point should be slightly below the support, not too far below it.
(That support could be the 100 EMA, below the triangle pattern, or the 0.618 Fibonacci level, as we mentioned.)
-Don’t use high leverage — x5 should be your maximum.
-Place your stop loss 5% below your entry zone,
which equals about 25% loss if you’re using x5 leverage.
And with that, you’ve got yourself a long setup with over a 90% success rate,
and you can apply the same logic in reverse when taking a short position.
Best Regards:
Ceciliones🎯
TAO/USDT — Triangle: Ready to Explode After Long Consolidation?TAO is currently standing at one of its most critical crossroads since forming a large structure earlier this year. The 2D chart reveals a Symmetrical Triangle pattern, a classic formation that signals the market is coiling energy for a major move ahead.
Each swing low keeps climbing higher, reflecting growing buying pressure — while the sequence of lower highs shows sellers are still defending strongly. These two forces are now colliding right around the key zone between ₮428 – ₮464.
---
Technical Structure Overview
Pattern: Symmetrical Triangle – pressure building toward an explosive breakout.
Key Resistance: ₮464 (confirmation once 2D candle closes above).
Bullish Targets: ₮563 → ₮614 → ₮701 → ₮744.
Dynamic Support: ascending trendline near ₮350–₮370.
Invalidation Level: daily/2D close below the rising trendline.
---
Bullish Scenario – “Pressure Before Expansion”
If TAO manages to break through the descending resistance and close above ₮464 with strong volume, it will confirm a breakout from this multi-month consolidation.
Such a breakout could trigger an impulsive rally, targeting ₮563 – ₮614, and potentially extending to ₮744, which is the previous major supply zone.
The strength of this setup lies in its duration — the longer the compression, the stronger the expansion.
---
Bearish Scenario – “Rejected and Retraced”
If TAO fails to break through the ₮428 – ₮464 confluence zone and gets rejected at the upper boundary, price may pull back sharply.
A breakdown below the rising support trendline could send TAO back toward ₮300 – ₮250, with extended downside risk to ₮167 if selling momentum accelerates.
This scenario gains validity only if a 2D candle closes below the ascending support with strong volume confirmation.
---
Conclusion
TAO is entering the final accumulation phase within this large triangle pattern — a period of calm that often precedes a powerful move.
At this stage, patience and confirmation matter more than prediction. Smart traders wait for the direction to reveal itself, then follow with discipline and tight risk management.
> “The bigger the base, the higher the breakout — or the harder the fall.”
TAO is now at the edge of its next major decision.
---
#TAO #TAOUSDT #CryptoBreakout #SymmetricalTriangle #TAOAnalysis #CryptoChart #TechnicalAnalysis #BreakoutSetup #TrianglePattern #CryptoTrading #PriceAction #Bittensor #AltcoinSetup #SwingTrade

TAOUSDT - simple and clean chart!TAO has formed a triangle pattern and just broke out on the 4-hour chart.
Don’t expect a major correction here — it’s showing strong momentum.
It’s likely heading above $600 soon, so keep a close eye on it — you’ll see what I mean.
Best regards :
Ceciliones🎯

TAOUSDT Forming Bullish MomentumTAOUSDT is showing a clear bullish momentum pattern on the charts, indicating a strong potential for upward continuation. The price structure suggests that buyers are steadily gaining control, with higher lows forming consistently — a sign of strength and accumulation. As the market maintains positive momentum, this setup could soon trigger a breakout toward higher resistance levels, confirming a strong bullish trend in the short to medium term.
The trading volume for TAOUSDT remains solid, showing that investors are actively engaging with this asset. Increased buying pressure alongside sustained volume often supports trend continuation and helps validate bullish setups like this one. If the momentum persists, the expected gain could range between 60% and 70%, aligning with key technical projections and market sentiment.
Investor confidence in the TAOUSDT project continues to grow, supported by recent positive developments and increased market exposure. With its strengthening momentum and favorable technical outlook, TAOUSDT is emerging as one of the promising pairs to watch closely. Traders may look for potential entry zones near support levels before the next upward impulse begins.
✅ Show your support by hitting the like button and
✅ Leaving a comment below! (What is You opinion about this Coin)
Your feedback and engagement keep me inspired to share more insightful market analysis with you!
TAO Could Explode if This Zone BreaksBINANCE:TAOUSDT has been repeatedly testing the resistance zone and is now making another strong attempt with solid momentum.
If the price manages to break and close above this zone, it could trigger a massive upside move. Keep a close eye, momentum is building up fast.
DYOR, NFA

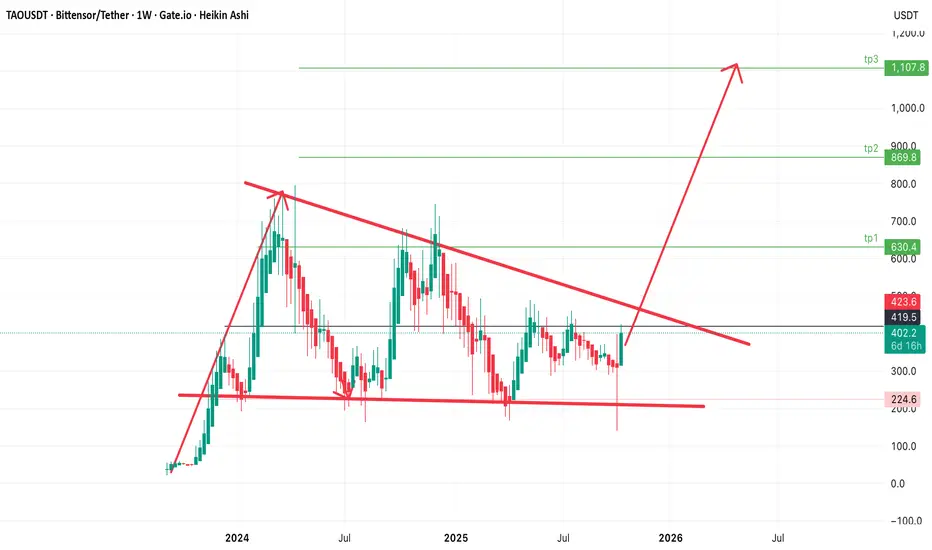
$tao TAO Bittensor Descending Triangle PatternGETTEX:TAO TAOUSDT Bittensor/Tether shows large descending triangle pattern forming on the Weekly timeframe— a classic setup for a major breakout when price breaks the downtrend line.
Current Price: $419
#TAO Chart Structure & Trend
Strong horizontal support between $224–230
Price recently bounced strongly from around $315 to $401, signaling momentum building toward a potential breakout of the triangle.
A decisive breakout above $450–470 would likely confirm a bullish reversal.
Key Levels
* Short-term: between $450–470 (trendline resistance and breakout zone)
* Medium-term: $630 (tp1)
* Extended: $870 (tp2) and $1,108 (tp3)
Invalidation of this Bullish bias is under $315
TAOUSDT: Bullish Breakout From Symmetrical TriangleTAO is showing a strong breakout setup on the 4H timeframe after consolidating within a symmetrical triangle pattern. Price has been forming higher lows while testing descending resistance multiple times - a classic sign of bullish pressure building up.
The breakout candle is now pushing above the trendline with increasing volume and EMAs (50/100/200) acting as dynamic support, indicating potential continuation to the upside.
Cheers
Hexa

TAO - WEEKLY NEUTRAL AREA...GETTEX:TAO - price analysis :
It looks like a clean triangle structure H4 here⏳
The current price area is very neutral. Difficult & unstable price zone.
Price could continue to move sideway between 420 - 368$ for a while.
🔴Bearish side:
Under 368 - 360$ ==> I'll keep an eye on the 330 - 320$ zone.
Technically, under 415$ (daily basis) , seeing a bearish rejection looks more possible 📉
🟢Bull side:
Weekly candle close above 455$ is required, to exit the HTF neutral area & trigger potential long term bullish move.
Overall, I think that above 360$ level, that's a bullish consolidation before the next big move HTF.

TAO - BORING CHART - NEUTRAL#TAO - price analysis:
Very neutral & weekly. 🤯
Level to watch:
480 - 463 - 412 - 370 - 348 - 310
Breakout points:
455 $ (weekly) for bulls
305$ (weekly) for bears.
Lower key demand zone: 335 - 320$ in case of dump.
I expect to see medium term sideway phase here... Boring chart.
TAOUSDT Forming Falling WedgeTAOUSDT is currently forming a falling wedge pattern, a classic bullish reversal setup that often signals the end of a downtrend and the beginning of a potential uptrend. This pattern indicates that bearish momentum is gradually weakening, while buying pressure is starting to build. With a good trading volume accompanying the setup, the breakout potential becomes stronger, suggesting that TAOUSDT could soon witness an upward surge. Based on the current technical outlook, an expected gain of 60% to 70%+ appears achievable once the breakout confirmation occurs.
The falling wedge pattern typically represents market consolidation before a significant breakout, where price action narrows down between converging trend lines. For TAOUSDT, this formation highlights a tightening price range with lower highs and lower lows, creating ideal conditions for a bullish breakout once resistance levels are breached. Traders are watching closely for a decisive candle close above the wedge line, which could confirm the reversal and trigger strong bullish momentum.
Investor interest in TAOUSDT is on the rise as accumulation patterns become evident across different timeframes. The improving volume profile adds further validation to the bullish setup, reflecting growing market confidence in this asset. With investors showing strong engagement and momentum indicators aligning positively, TAOUSDT could be positioned for a substantial breakout phase in the short to medium term.
✅ Show your support by hitting the like button and
✅ Leaving a comment below! (What is You opinion about this Coin)
Your feedback and engagement keep me inspired to share more insightful market analysis with you!
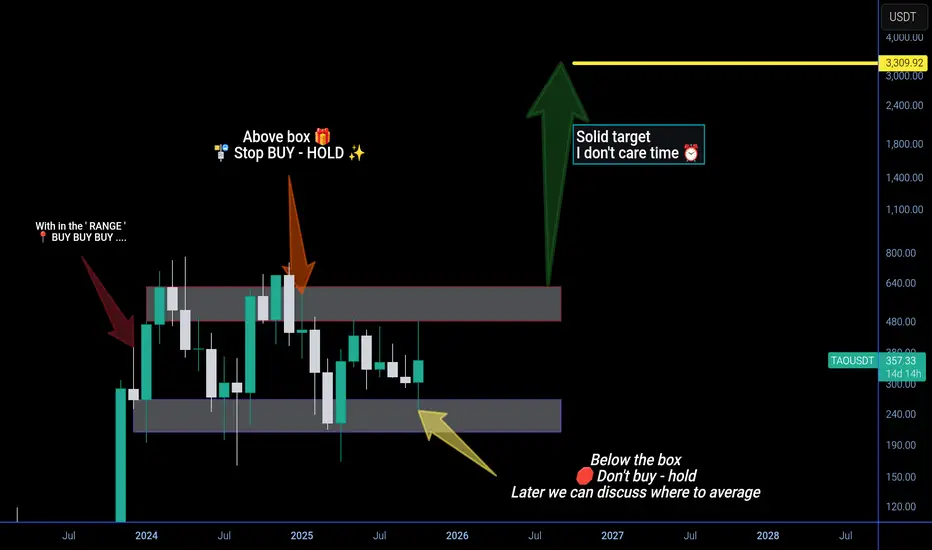
Future is AI - win or lose but I hold and support it upto $3k" DYOR / NFA " ⚠️
i support BINANCE:TAOUSDT for future strong project , i don't care about time but I care only one target $3000 above for one COINBASE:TAOUSD .
Note - time and future price candle change the price forecast ,
so pls be updated by following the post 📯 .
With in range always BUY
‼️ Stop buy above _&_ below the box ☑️
1TAO = $3000+
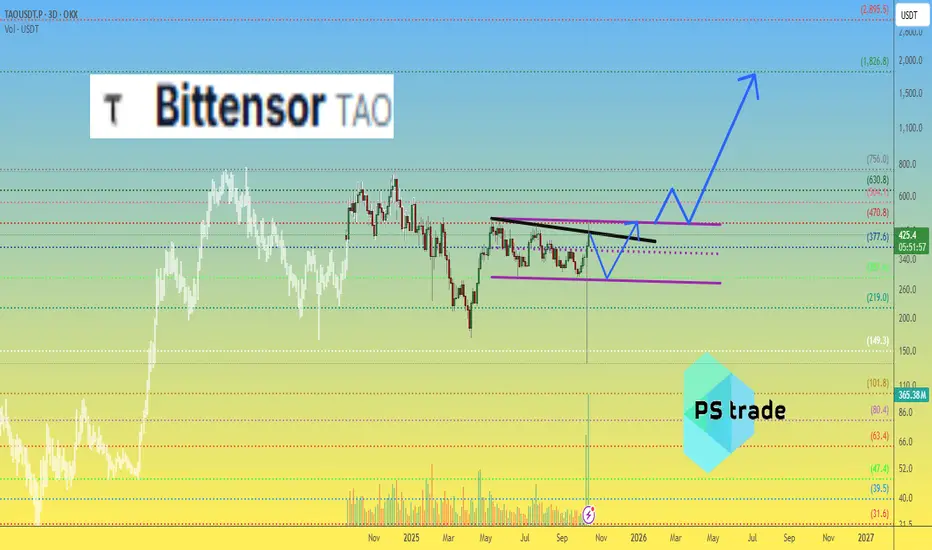
#Bittensor ( $TAO ) Technical Overview — October 2025After the sharp correction on Oct 10, #TAO found solid support and quickly recovered,
indicating strong buying interest. The OKX:TAOUSDT.P chart now shows a clear consolidation range between $290–490.
📊 Within this range, algorithmic and bot-driven strategies can operate efficiently
Key technical zones:
Accumulation: $280–290
Breakout confirmation: Above $470
Potential upside targets: $1800 → $2900
From a structural standpoint, maintaining support above $290 keeps the bullish scenario intact.
The upcoming sessions will reveal whether buyers are ready to push beyond resistance or reload for another dip.
🤔 What’s your outlook on #TAO — breakout soon or another retest first?
______________
◆ Follow us ❤️ for daily crypto insights & updates!
🚀 Don’t miss out on important market moves
🧠 DYOR | This is not financial advice, just thinking out loud
TAO - PERFECT SETUP SHARED AGAIN! GETTEX:TAO - perfect setup shared yesterday!
From the bottom to the top: +25%
Congrats fam.
TAO Eyes Next Leg Toward $700!BINANCE:TAOUSDT is breaking through a key resistance zone, signaling a strong shift in momentum.
This breakout not only confirms buyer strength but also opens the door for a potential move toward the $700 region, where the next major resistance lies.
As long as TAO holds above this breakout zone, the structure remains bullish and continuation toward higher levels looks likely.
DYOR, NFA
THANKS FOR THE READ

TAOUSDT Forming Falling WedgeTAOUSDT is currently displaying a strong falling wedge pattern, a bullish technical setup that often signals the end of a downtrend and the beginning of a major upward reversal. The price has been consolidating tightly within the wedge structure, suggesting that sellers are losing momentum while buyers are gradually stepping in. Volume remains steady and healthy, indicating growing accumulation and potential preparation for a breakout. With improving market sentiment, TAO could soon see a significant rally of around 60% to 70%+ once it breaks above the wedge resistance.
The structure of this falling wedge highlights a classic pattern seen before large bullish moves — declining highs and lower lows compressing toward a breakout point. This compression phase often precedes explosive upward movement, as traders and investors anticipate a reversal backed by solid technical signals. The recent market behavior and sustained volume further reinforce the bullish outlook for TAOUSDT in the short to mid-term.
Investor interest in this project is increasing as the broader market begins to recover and capital rotates toward fundamentally strong assets. TAOUSDT has shown resilience even during broader market corrections, making it a coin to watch for traders seeking breakout potential. A confirmed breakout with volume could mark the start of a new bullish leg, opening the door for higher price targets and strong momentum continuation.
✅ Show your support by hitting the like button and
✅ Leaving a comment below! (What is You opinion about this Coin)
Your feedback and engagement keep me inspired to share more insightful market analysis with you!
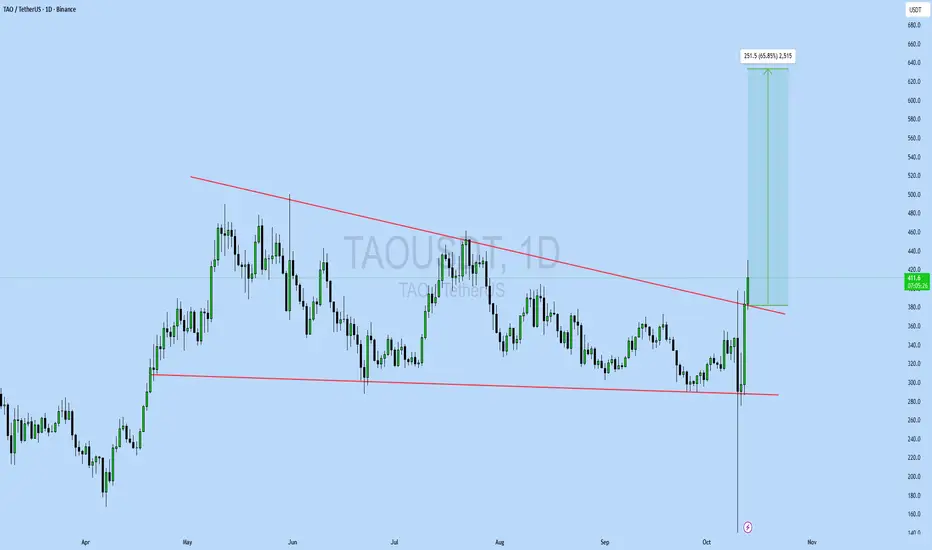
TAOUSDT UPDATE#TAO
UPDATE
TAO Technical Setup
Pattern: Bullish falling wedge pattern
Current Price: $412.2
Target Price: $663.7
Target % Gain: 65.85%
GETTEX:TAO is breaking out of a falling wedge pattern on the 1D timeframe. Current price is $412.2 with a target near $663.7, indicating around 65% potential upside. The breakout suggests renewed bullish strength and continuation potential. Always use proper risk management.
Time Frame: 1D
Risk Management Tip: Always use proper risk management.
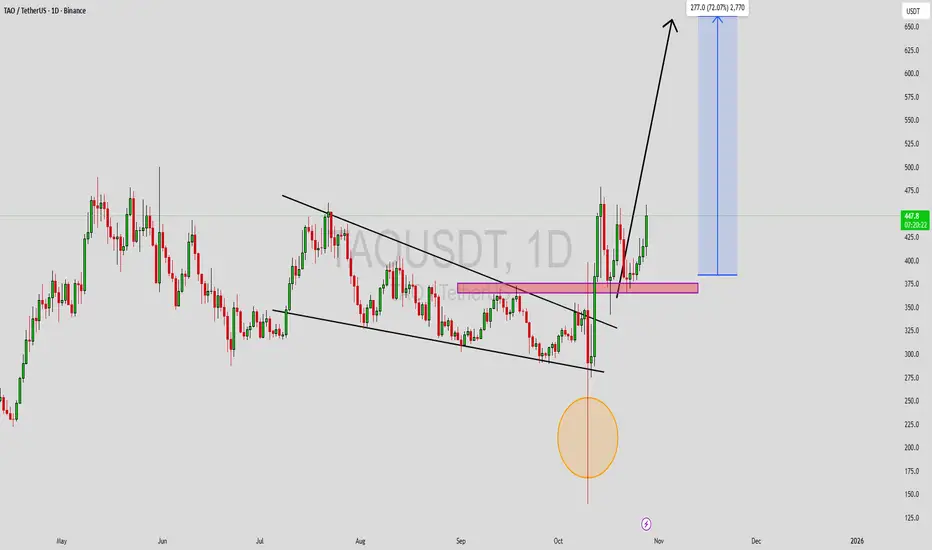
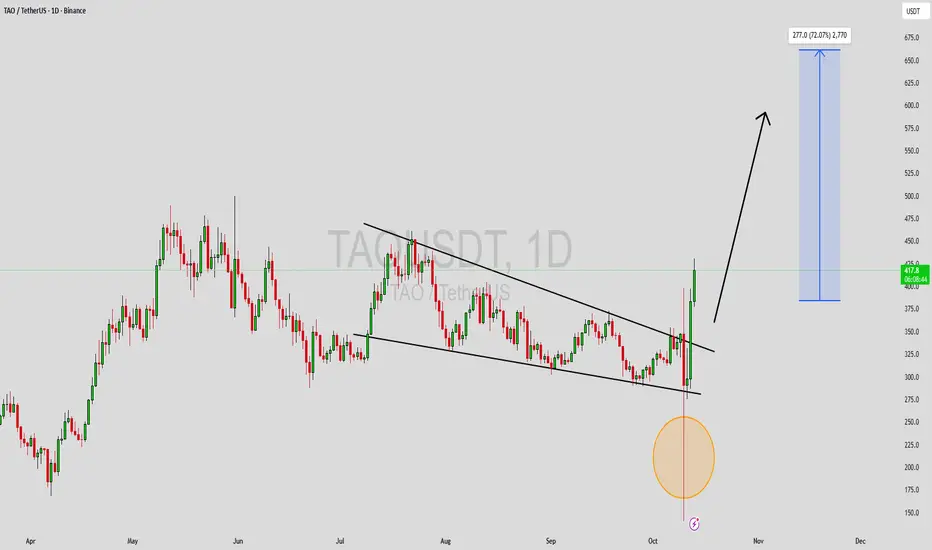
TAO Analysis – Strength After the DropIn my last week’s TAO analysis, I mentioned that the coin remains bullish, with the $300 zone being an excellent buy area.
Friday’s market-wide crash also hit TAO, but what followed was far more important.
________________________________________
1. Reaction After the Drop
• The decline stopped exactly at the previous support.
• Price quickly recovered the $300 level, turning it back into support.
• That support was retested and held again, confirming its strength.
• Finally, TAO broke above resistance and even made a high above Friday’s top.
________________________________________
2. Outlook
All these are bullish confirmations of strength and resilience.
If the broader market continues to stabilize, TAO could extend its move toward $500, followed by $700 as the next potential target zone.
The outlook stays strongly bullish as long as $300 remains intact.
________________________________________
Conclusion:
TAO continues to outperform and show real momentum.
Support respected, resistance broken, buyers in control. 🚀


TAO Surging Towards $415WRITE ANALYSIS
ChatGPT said:
TAO is approaching a critical resistance level near $415 after breaking above the descending trendline. This could lead to a test of the key zone, which has been a significant resistance in the past.
A successful break above this level might fuel further upside potential, while rejection could push the price back toward the support zone around $350–$375.
Keep an eye on price action around the key levels for potential breakout or pullback.
DYOR, NFA

TAO - BULLISH BREAKOUT AWAITED#TAO - Bullish 📈
Cup & Handle H4 & Daily wedge test 🚀
Key resistance: 378 - 380$.
Price is gonna fly if we break above 🚀
🎯400
🎯435
🎯440
🎯478+

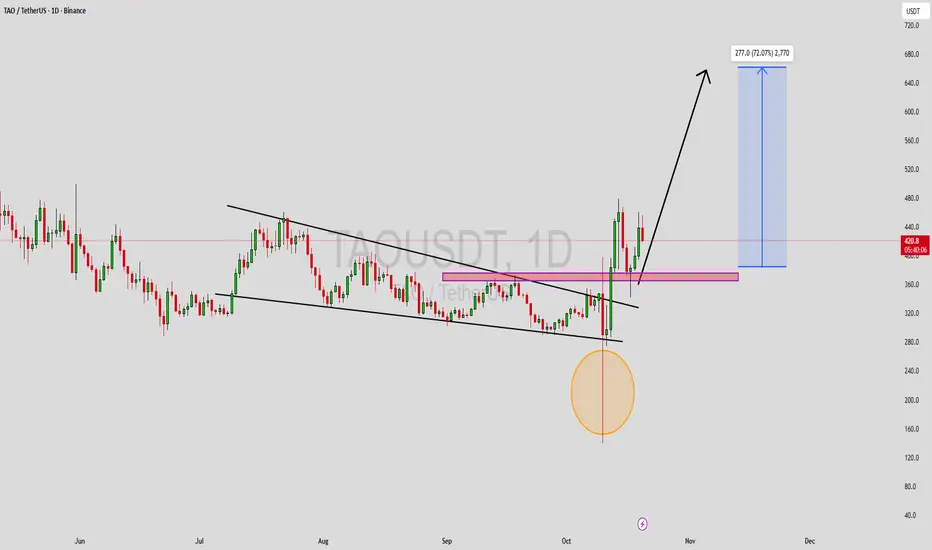
TAO – Constructive Recovery and Key Levels AheadTAO made a significant low in April, just like most crypto assets. Interestingly, this low is perfectly aligned with the one from August 2024, suggesting a strong structural base in the market. From that point, price started to rise in a very constructive and orderly manner, confirming a shift in sentiment.
After the initial rally, TAO touched the 500 zone, a key psychological and technical level. As expected, the market corrected from there, dropping just below 300. What’s notable is that the recent low sits precisely around this 300 area, now acting as a strong support level.
At the time of writing, the price is around 350, currently testing the falling trendline from previous highs. If we see a confirmed breakout above this line, I expect acceleration to the upside, with an initial and conservative target around 500.
However, if momentum continues to build, the next significant resistance lies near the 700+ area, which could translate into a 100% gain from current levels — a solid move if the trend structure holds.
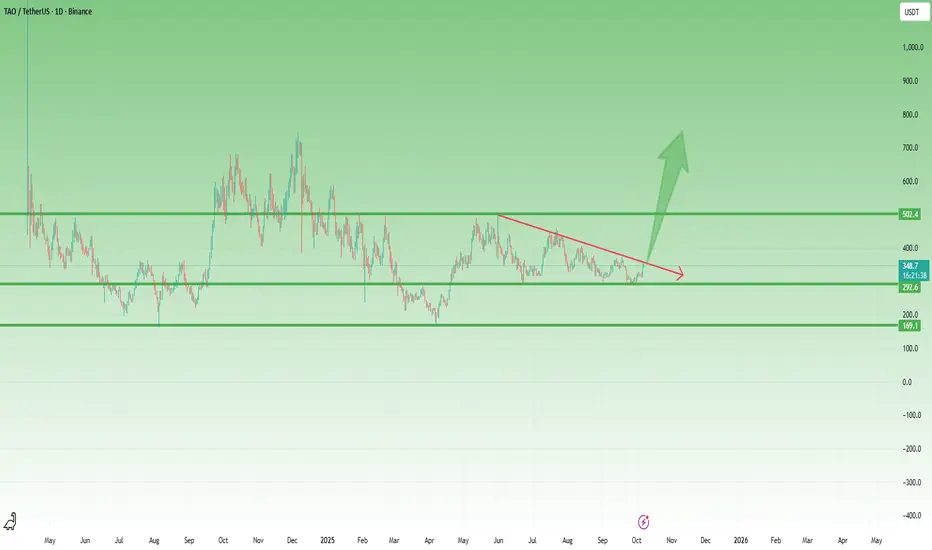
TAO Chart Analysis!!TAO Chart Analysis
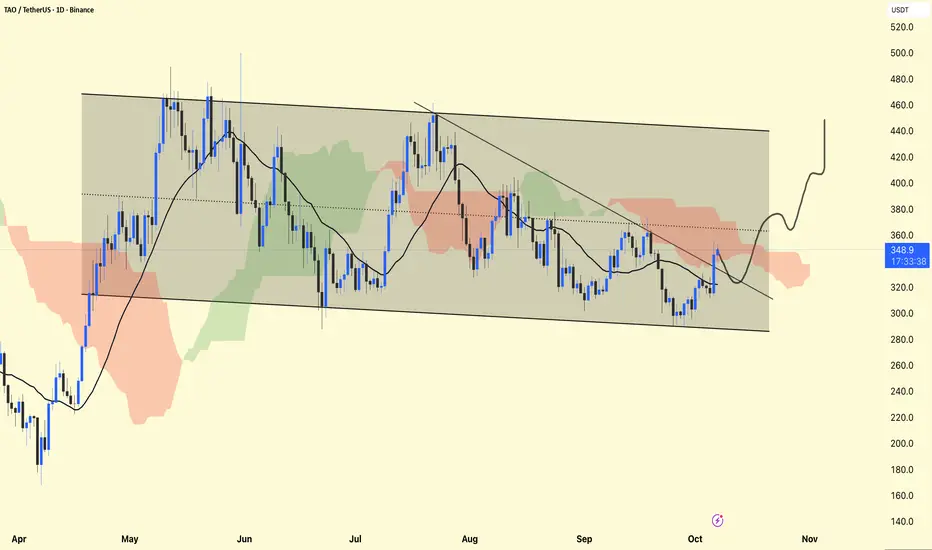
Overall Structure: The price is moving within a descending channel (marked by the shaded area). This reflects a broader bearish trend over the past several months.
Short-Term Momentum: Recently, the price has bounced off the lower channel boundary around $300 and is attempting to break the short-term downtrend line.
Support and Resistance
Support Levels:
~$320 (recent consolidation and channel bottom area)
~$300 (strong lower channel boundary)
Resistance Levels:
~$360 (current short-term downtrend line and Ichimoku Cloud resistance)
~$400 (upper channel boundary)
~$440–450 (previous highs, upper channel line)
Ichimoku Cloud:
Currently, the price is entering the red cloud – a potential resistance area.
If the price closes above the cloud (~$360–370), it could signal a trend reversal.
Moving Averages: The price is slightly above the short-term moving averages, which indicates a near-term uptrend.
The projection shown shows a potential breakout above the descending channel, initially targeting the $400–420 area.
A successful breakout accompanied by broad volume could shift the medium-term trend from bearish to bullish.
DYOR | NFA