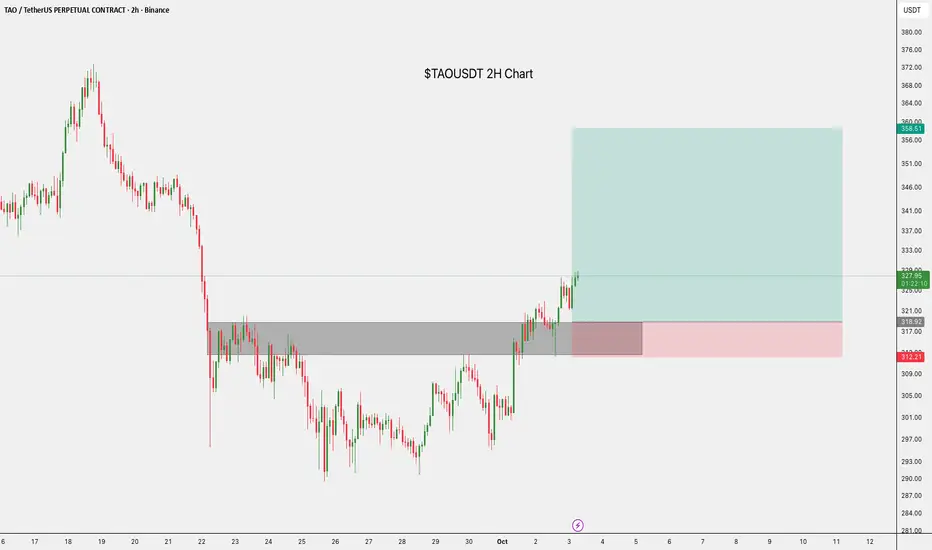
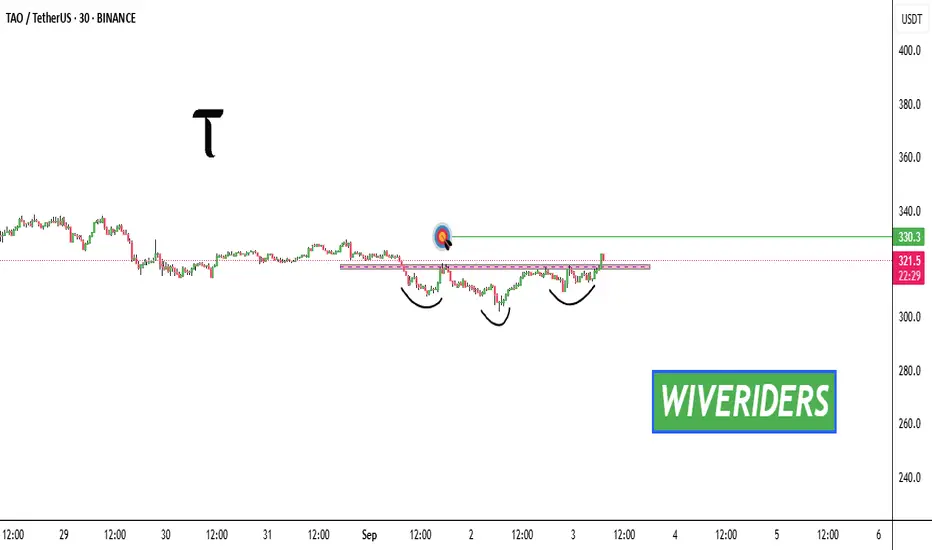
$TAOUSDT.P Trade Setup.$TAO/USDT 2H Trade Setup:
- Entry: CMP
- Stop Loss: $312.21
Target 1: $337.00.
Target 2: $358.61.
Price broke through key resistance, and we’re looking for a push up from this demand zone. Watch volume and structure for confirmation.
DYOR, NFA
TAOUSDT
TAO – Descending Triangle at Critical Levels
TAO is consolidating inside a descending triangle, with sellers pressing from above and buyers defending the $256–$242 support zone.
- Resistance: $265–$270
- Support: $242–$256
- Bullish case: Break and close above $270 could trigger a rally toward $800–$1700.
- Bearish risk: Losing $170 support would invalidate the setup and open deeper downside.
⚖️ TAO is at a make-or-break point — watch for a confirmed breakout before entering.
TAOUSD Bullish case scenario, DCA TAOUSDT Analysis (1D timeframe) Currently, TAO is trading around $298, showing a slight decline of -1.02%. On the chart, we can see a falling wedge / descending triangle pattern forming, with strong horizontal support around the $295-300 zone.
The projection indicates a potential breakout to the upside, with a measured move target of around +54.8%, which could bring the price toward the $460-480 range if momentum builds.
As long as TAO holds above the key support level, the bullish breakout scenario remains valid. However, a breakdown below support would invalidate this setup and may trigger further downside.
Key levels to watch:
Support: $295-300
Resistance: $365-425
Breakout target: $460-480

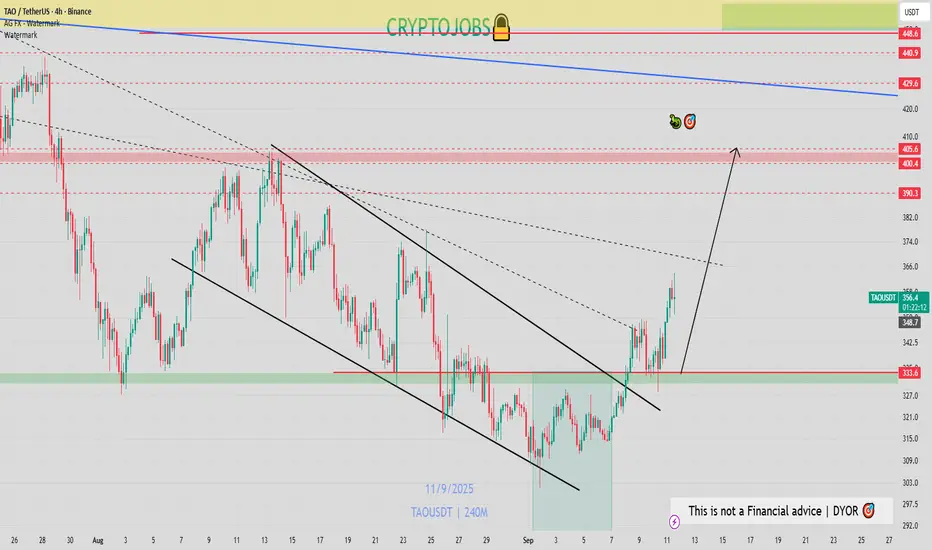
TAO 4H Analysis - Key Triggers Ahead💀 Hey , how's it going ? Come over here — Satoshi got something for you!
⏰ We’re analyzing TAO on the 4-Hour timeframe.
👀 On the 4-hour timeframe for Bittensor (TAO), we can see that this coin belongs to the AI category on CoinMarketCap and currently holds rank #35. TAO had been moving inside a continuation descending channel, but it has now successfully broken out of this channel. With a completed pullback and a proper setup candle confirmation in multi-timeframe analysis, this could present a trade opportunity.
⚙️ Key RSI levels for this coin are at 70 (overbought threshold) and 35 (near oversold). At the start of the current leg, during the holiday session, volatility increased strongly, and TAO managed to break through its swing resistances. If RSI pushes above 70 and enters the overbought zone, the coin could experience a solid bullish move.
🕯 The number of green candles has been increasing, and TAO also reacted well to the channel top. At the same time, a major resistance at $322 was broken, with all sell orders at that level fully absorbed.
🪙 Looking at the TAO/BTC pair on the 4-hour timeframe, we can see that after breaking through its previous resistance, the pair is currently consolidating and completing a pullback at this zone. Once the pullback is confirmed with a setup candle, we could have a strong trade confirmation.
💡 The key alarm zones for this coin are:
Around $322, where a reaction followed by a bounce can push the price higher.
With a successful breakout above $327, TAO could gain momentum and continue its bullish trend.
❤️ Disclaimer : This analysis is purely based on my personal opinion and I only trade if the stated triggers are activated .

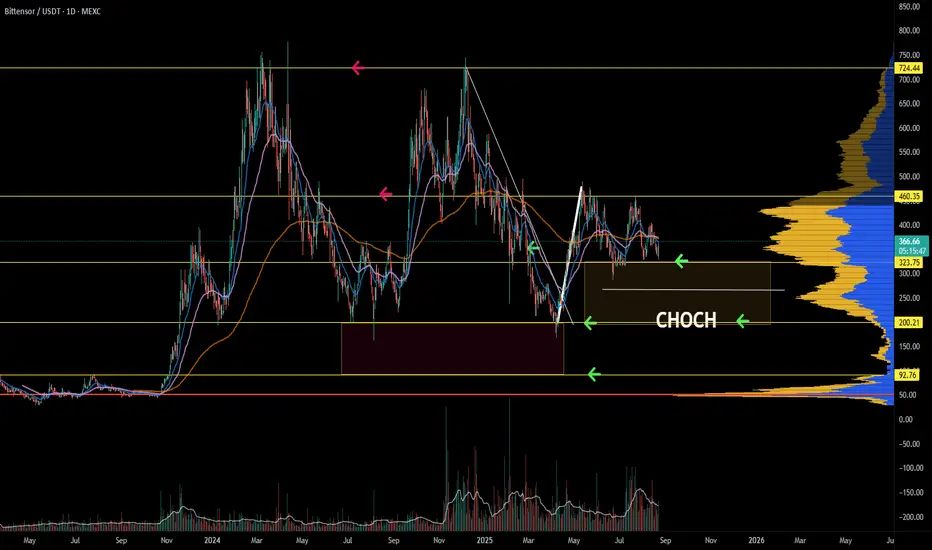
TAO - BEARISH WEEKLY VIEW! GETTEX:TAO - Price Analysis 🐸📉
🧭 Structure: attempted daily double bottom, but sellers still in control below former major supports now acting as resistance.
📊 Ichimoku (1D): price and lagging span remain under the cloud → bearish bias intact until a clean reclaim.
🪙 Next key downside: $280–$285 demand zone if supports crack.
🔄 Invalidation: sustained daily close back above broken supports and the cloud would neutralize the bearish thesis.
Market context
🧱 TOTAL Crypto MCap (Alts): watching a potential bearish H&S; a confirmed neckline break could extend alt mcap downside by ~8–10%. ⚠️ .
Positioning
📉 Caution with longs for now, especially on large/medium caps.
🧪 Expect occasional random spikes on low/micro caps as liquidity rotates and volume clusters.
The plan here: wait for the sweep into $280–$285 or only flip bias on a strong reclaim? Drop your chart below 👇

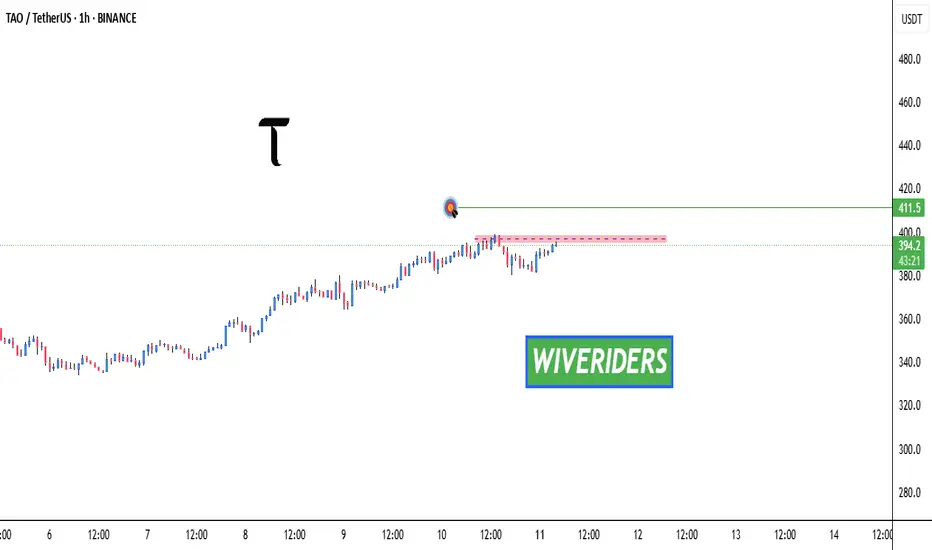
TAO - Bullish setup GETTEX:TAO might pump toward 400$ again next 📈
Neutral on the weekly basis, but a consolidation above 340$ would be good.
Lower key support: 315 - 305 - 300$ & 580$
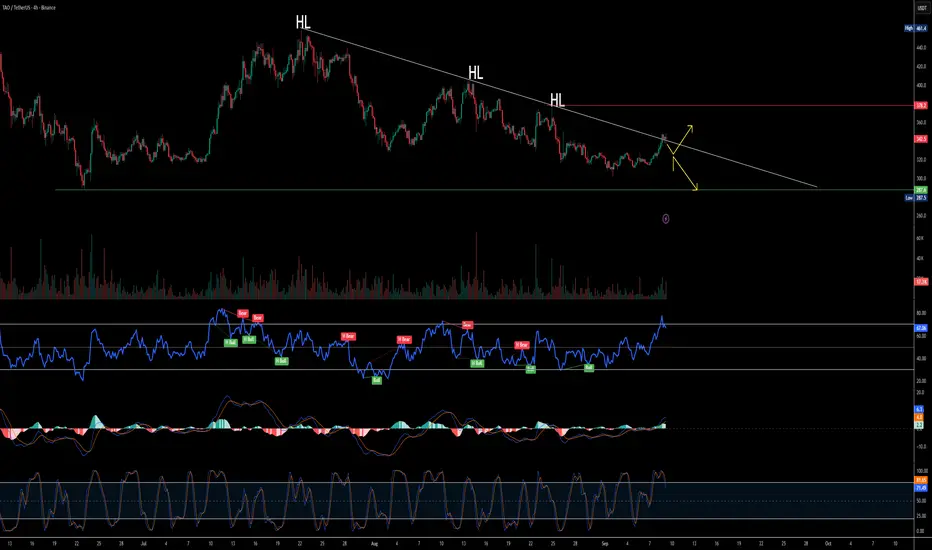
$TAO Higher Lows Forming but Overbought Signals Trigger SelliOn the 4-hour timeframe, TAOUSDT is consistently forming higher lows, but the structure still aligns with a bearish trend overall. For a clear breakout confirmation, price needs to surpass the $380 resistance zone.
Currently, both the Stochastic RSI and RSI are in the overbought region, indicating that sellers have started booking profits. This explains the short-term selling pressure.
If the price sustains above the $320 support level, there is potential for a reversal move toward new highs. However, failure to hold this zone could lead to another retest of the critical support near $287.
Traders should wait for confirmation before positioning, as the next direction depends on whether $320 holds or breaks.
TAO Bullish Pattern Alert!🚨 GETTEX:TAO Bullish Pattern Alert! 🚨
GETTEX:TAO has formed an inverted Head & Shoulders pattern 🟢
👉 If it plays out, the first target will be the green line level 🎯
⚠️ Key point: Pattern confirmation is crucial — wait for breakout above the neckline.
👉 A confirmed move signals strong bullish continuation with buyers taking control ✅
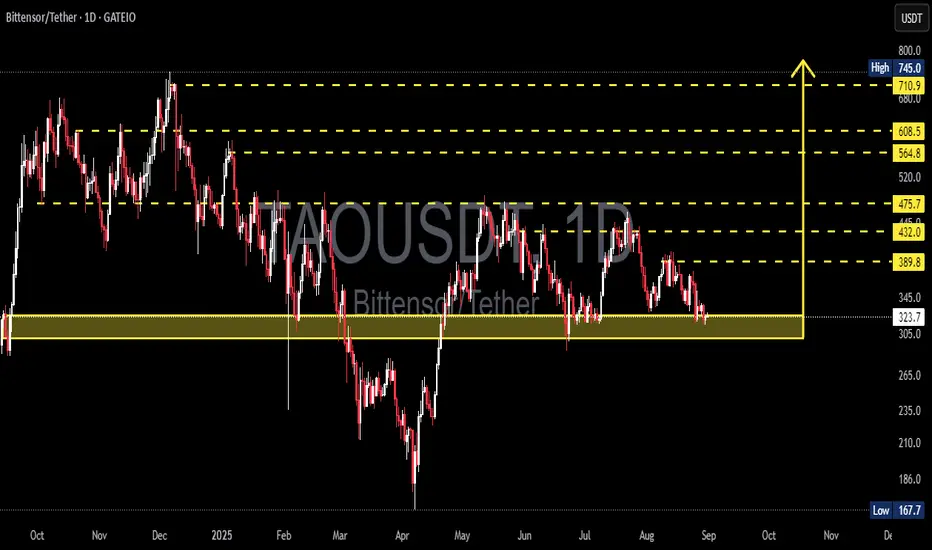
TAO/USDT – Demand Zone: Potential Double Bottom or Breakdown🔎 Market Overview
TAO/USDT is currently trading around 324 USDT, sitting right inside the key demand zone (305–345) that has been tested multiple times since late 2024. This area has repeatedly acted as a strong defensive wall for buyers, and once again the market is waiting for a big decision: bounce or breakdown.
From April to August 2025, the chart shows a series of lower highs, reflecting continued selling pressure. However, the repeated defense of this demand zone suggests accumulation is possible if a strong bullish reaction appears.
---
🧩 Price Structure & Pattern
Current pattern: Consolidation within the demand zone (305–345).
Key characteristics:
Buyers have successfully defended this level multiple times → potential accumulation area.
Larger structure still shows minor downtrend (lower highs).
A confirmed breakdown could trigger deeper sell-offs.
In short, this is the battle zone between bulls and bears that will determine the medium-term direction.
---
📈 Bullish Scenario
If price holds and bounces from the demand zone:
Confirmation: Daily bullish candle closing above 345–350 with strong volume.
Upside targets:
🎯 TP1: 389.8 (first resistance & short-term supply zone)
🎯 TP2: 432.0 (mid-term supply zone)
🎯 TP3: 475.7 (major resistance – key to shift medium-term trend)
🎯 Extensions: 564.8 – 608.5 – 710.9 – 745.0
➡️ A successful bounce could form a double bottom / base formation.
---
📉 Bearish Scenario
If price fails to hold the demand zone (daily close below 305):
Confirmation: Breakdown candle with strong volume + failed retest.
Downside targets:
🎯 265 – 235 (nearest supports)
🎯 167.7 (historical low – potential final target if strong selling pressure continues)
➡️ This would form a major support breakdown, potentially triggering a larger distribution phase.
---
⚖️ Technical Conclusion
Current bias: Neutral to Bearish – downtrend structure remains, but bulls are still defending.
305–345 is the make-or-break zone.
Bounce → potential rally towards 389–475.
Breakdown → possible drop to 235 or even 167.
---
🛡️ Risk Management Notes
Clear stop-loss levels:
Bullish setup: SL below 305.
Bearish setup: SL above 345–350 after breakdown.
Scale into positions rather than going all-in.
Watch for volume confirmation & momentum indicators (RSI/MACD) to avoid false breakouts.
---
📌 Extra Insights
The 305–345 zone is not only a technical level but also a psychological price floor, tested multiple times.
The structure of lower highs vs. strong support often resolves with a major breakout — meaning the next move could be very aggressive.
Patience is key: traders should wait for a clear daily close confirmation before entering to avoid being trapped in a fake move.
#TAO #Bittensor #TAOUSDT #CryptoAnalysis #TechnicalAnalysis #SupportResistance #Breakout #CryptoTrading #SwingTrading #PriceAction
TAO flagging out. TAO is forming a playable structure. A flag here will likely turn into a continuation. If not, invalidation his clear. The accumulation zone below is a BTD opportunity. Accumulation time is now.
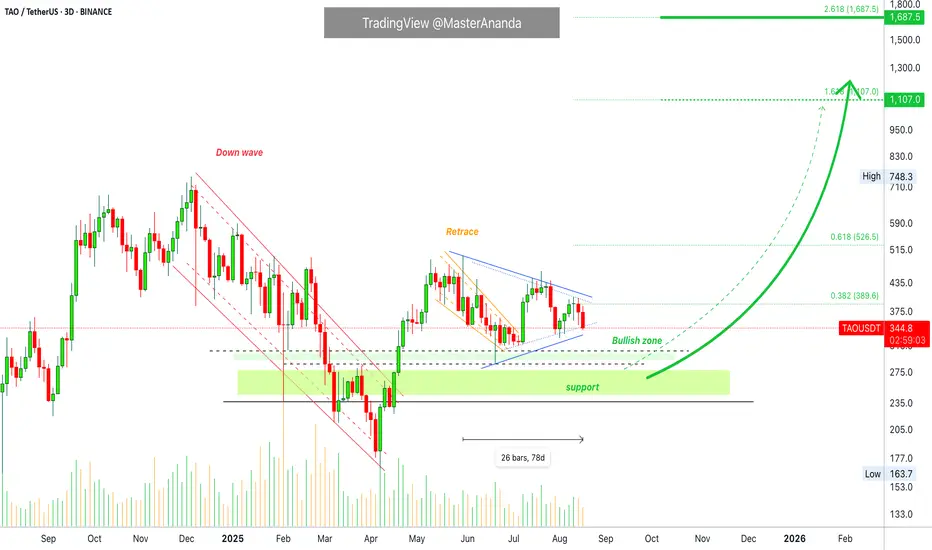
Bittensor (TAO) Update · Bullish Zone, Retrace & Higher HighBittensor peaked 31-May. This means the project has been sideways now for 78 days. First a retrace and now sideways.
The chart setup overall looks good. The main low happened in April and here the bulls enter the game. We see the end of the downtrend, no new lows. The current retrace has no bearish force and it seems to be running its end. When volume stars to dry and the action becomes flat, a strong breakout follows.
The breakout can be in any direction. We are bullish because the main move is the recovery from April and this recovery is being consolidated. When the consolidation ends we get a continuation which is an advance from my vantage point.
There can be a drop. The drop can be mild or small before growth. There is room for prices to fluctuate. Even with a small drop, or large, TAOUSDT will remain above support and within the bullish zone.
A sudden drop would signal the end of the sideways period and the start of the next bullish wave. If there is no drop the market starts to turn slowly and prints a very big green after 3-5 days up.
We are getting very close now to the next breakout, I am thinking between 5-7 days. Next week for sure we will see the market grow. It is already growing based on the bigger picture, but the last advance is still being consolidated marketwide. This is the phase that is coming to its end. Some pairs did move forward but took a pause with Bitcoin's retrace. This is a small pause. Growth follows next.
Namaste.
TAO Breakout Watch – Red Resistance Being Tested!🚨 TAO Breakout Watch – Red Resistance Being Tested! 🔴⏳
TAO is testing the red resistance zone.
📊 If breakout confirms, next move could target:
🎯 First Target → Green line level
A breakout could trigger bullish continuation and upside momentum.
TaousdtThe volume profile on this chart along with other macro factors suggest we extend to the 1.618 at some point
(Probably q4)
~171%
There would be potential for price acceptance at these levels aswell and eventual continuation given the fundamentals of this one.. could easily be a multi cycle coin...

TAO - Time to buy again!The triangle pattern will break in the direction it is breached, and the price will move in that direction. In my opinion, the price could be bullish and may up to $600.
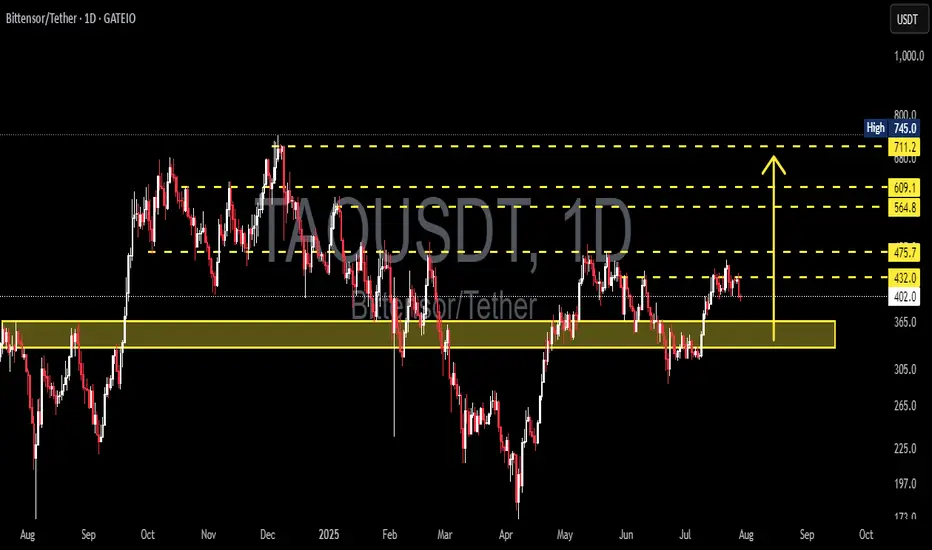
TAO/USDT: Price Likely to Retest Key Support Block 330–365 USDT?🟨 Key Zone: Yellow Support Block (330 – 365 USDT)
This zone has served as a major demand area since May 2025, acting as the base for the recent bullish move toward 475 USDT.
It represents a strong accumulation zone, where significant buying interest previously stepped in.
Given the current rejection from the 475 resistance, price is likely to revisit this block to test buyer interest and liquidity.
---
📉 Bearish Scenario: Breakdown Risk
After failing to break above 475.7 USDT, price shows signs of a short-term correction.
If bearish momentum continues:
🔽 A retest of the yellow support zone (330–365 USDT) is highly probable.
If this zone fails to hold:
📉 Next downside targets:
305 USDT – previous local low
265 USDT – next major demand level
A breakdown of the yellow block would invalidate the current bullish structure and open a new bearish leg.
---
📈 Bullish Scenario: Successful Retest and Bounce
If the price retests the yellow zone and forms a strong bullish reaction:
Confirmation signals:
Bullish reversal candles (hammer, bullish engulfing, etc.)
Increasing volume near the support zone
A successful retest could lead to:
✅ Continuation of the bullish trend
✅ Higher-low structure remains intact
Upside targets:
432 USDT – minor resistance
475.7 USDT – strong resistance zone
564.8, 609.1, and up to 711–745 USDT – extended targets
---
📌 Key Technical Levels:
Level Significance
330–365 USDT 🔲 Yellow Support Block / Demand Zone
432 USDT Minor Resistance / Previous Breakout
475.7 USDT Major Resistance (Recent Rejection)
564.8 USDT Mid-Term Resistance
609.1 USDT Next Key Resistance
711–745 USDT Long-Term Target / Supply Zone
305 USDT Support if Breakdown Happens
265 USDT Next Demand Zone Below
---
📊 Structure & Market Behavior:
No clear classic pattern (e.g., H&S or double bottom), but:
Current price is moving within a range-bound structure
Holding the 330–365 block would form a new higher low, strengthening the bullish outlook
Market is watching how price responds on retest of the yellow support
---
🧠 Notes for Traders:
Watch for volume and candle structure as price enters the 330–365 zone
This zone is a classic re-entry / reload area for institutional buyers
Conservative entry: Wait for bullish confirmation candle above 365
Aggressive entry: Ladder buys inside 330–365 with stop loss below 330
---
🏁 Conclusion:
TAO/USDT is undergoing a healthy pullback after rejection at 475.7 USDT. A retest of the yellow support zone (330–365 USDT) is highly likely. This area is crucial for the next move — either a bullish continuation with a strong bounce or a bearish breakdown signaling trend reversal.
#TAOUSDT #TAO #CryptoAnalysis #RetestSupport #DemandZone #BullishScenario #BearishScenario #AltcoinWatch #TechnicalAnalysis #PriceAction #TradingView #SupportAndResistance #GateIO #ReentryZone
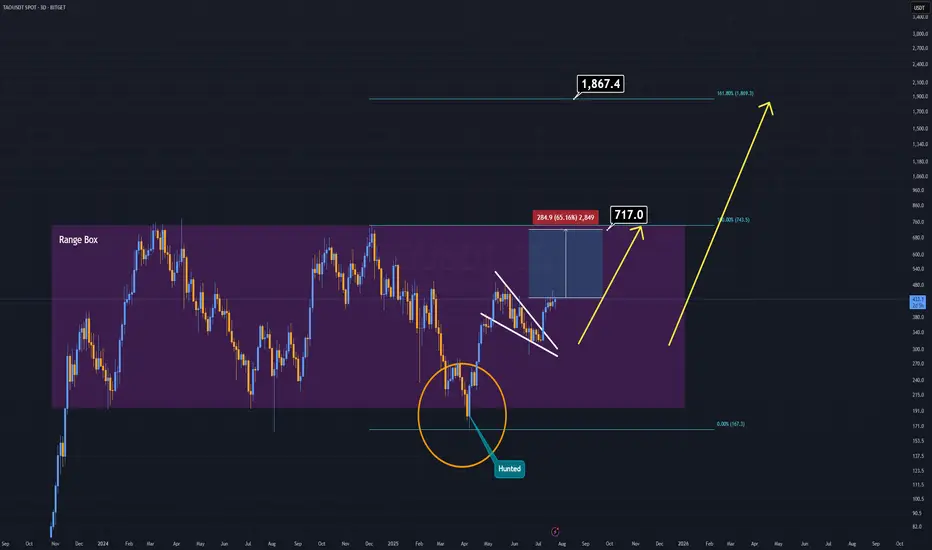
TAO Analysis (3D)Sometimes, there's no need for complex patterns or heavy indicators — and TAO is a perfect example of that.
For years, TAO has been consolidating inside a clearly defined accumulation box. Before the current bullish breakout, it liquidated all weak hands by sweeping the lows — convincing many that the project was dead.
Now, on the daily timeframe, we’re seeing a broken and active pennant formation, which is already being validated.
This structure alone is a strong technical buy signal.
With the upcoming AI-driven bull run, TAO has the potential to outperform many of its AI-sector peers.
This one might just fly ahead of the pack.
#TAOUSDT #4h (ByBit) Ascending trendline near breakdownBittensor printed an evening doji star deviation, a retracement down to 200 MA support seems next.
⚡️⚡️ #TAO/USDT ⚡️⚡️
Exchanges: ByBit USDT
Signal Type: Regular (Short)
Leverage: Isolated (5.0X)
Amount: 5.0%
Entry Targets:
1) 430.38
Take-Profit Targets:
1) 362.01
Stop Targets:
1) 464.64
Published By: @Zblaba
GETTEX:TAO BYBIT:TAOUSDT.P #4h #Bittensor #AI #DePIN bittensor.com
Risk/Reward= 1:2.0
Expected Profit= +79.4%
Possible Loss= -39.8%
Estimated Gaintime= 1 week

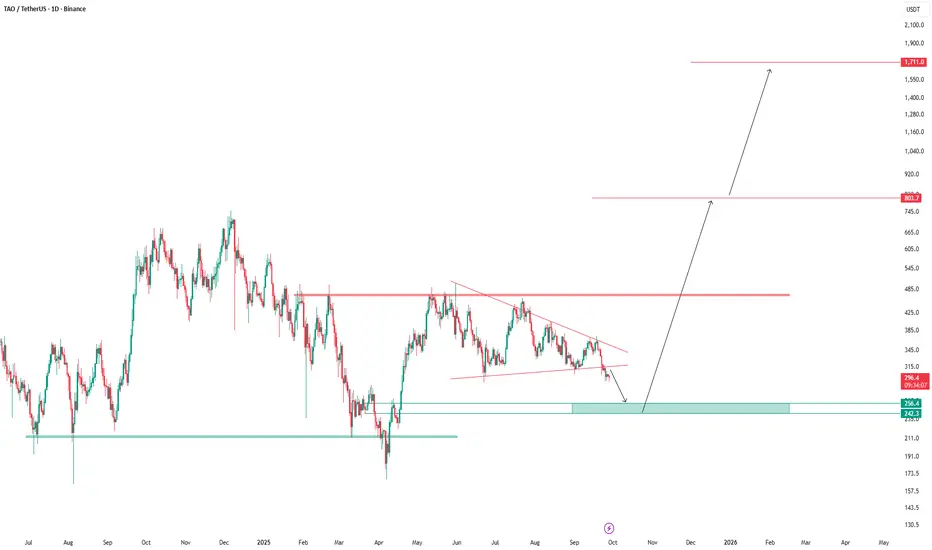
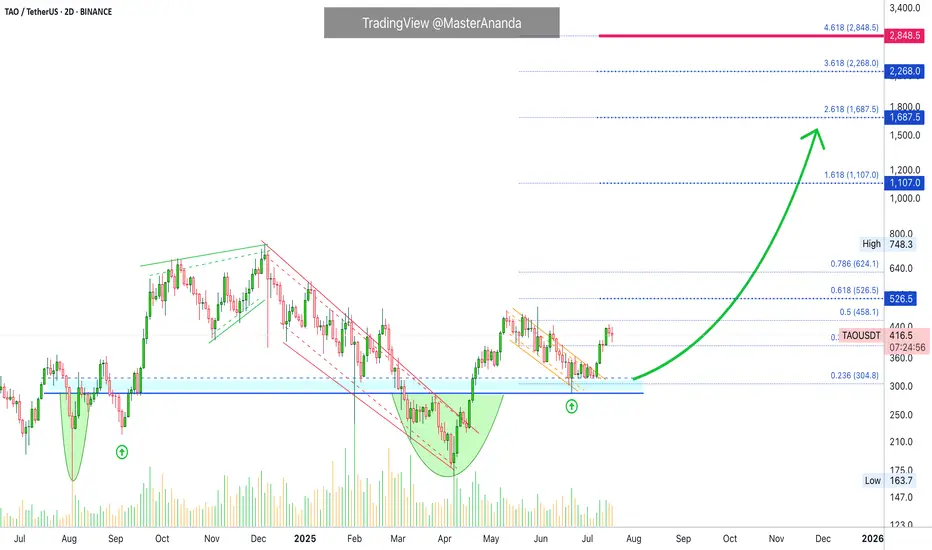
TAO's (Bittensor) True Potential Exposed · How About $3,000?Remember when I kept saying these are "conservative targets"? Why should we look for conservative targets when we know the market will do magic in the coming months? Why?
Let's focus more on realistic targets, optimistic targets, strong targets, good targets, successful targets; higher is better, less is not more.
We've been here many times before. I am happy and grateful to be able to count with your continued support. You can count with my analyses, great entry prices and timing. You can count with a unique market perspective 100% free of outside influences. I am not paid through USAID. 100% independent and everything you see is my mind, my soul, my heart and my spirit. It is my understanding of the market based on thousands of charts, thousands of publications, thousands of successful trades and more than a decade of experience. We are here to win and to trade. We trade to win, make no mistake.
Bittensor's (TAO) bottom is in, a long-term double-bottom; the beauty of TA.
A major low in August 2024. A new low in April 2025. The fact that these two happened at the same price is good news and it is already confirmed. Something as simple as the same level being hit twice helps us predict the future when it comes to the price of this, and others, trading pairs.
With the bottom in we can focus on growth. TAOUSDT is still early considering the bigger picture because the action is still happening below its May 2025 high. But conditions are good, very good I should say, because TAOUSDT is trading daily above EMA55, EMA89 and EMA233, a long-term moving average.
The break just happened days ago. If we are set to experience growth for 3-6 months, minimum, after this signal shows up, this opens the doors for prices much higher to what we've been considering in the past few months.
$1,100 is a good target but an easy hit. Only 30% higher compared to the last major high in December 2024.
$1,687 is the first strong resistance that TAO will face during its bull market bull-run. My bet is that it will break.
Going higher, we can see TAO trading at $2,268 later this year and even higher, just below 3K.
Now, this chart is very young so even while being optimistic we do not have enough data to project higher targets but there is no limit to how far-up a project can go during the price discovery phase. When we enter new all-time high territory and the final fifth (speculative) wave, all bets are off. You can aim for the moon or higher.
Namaste.
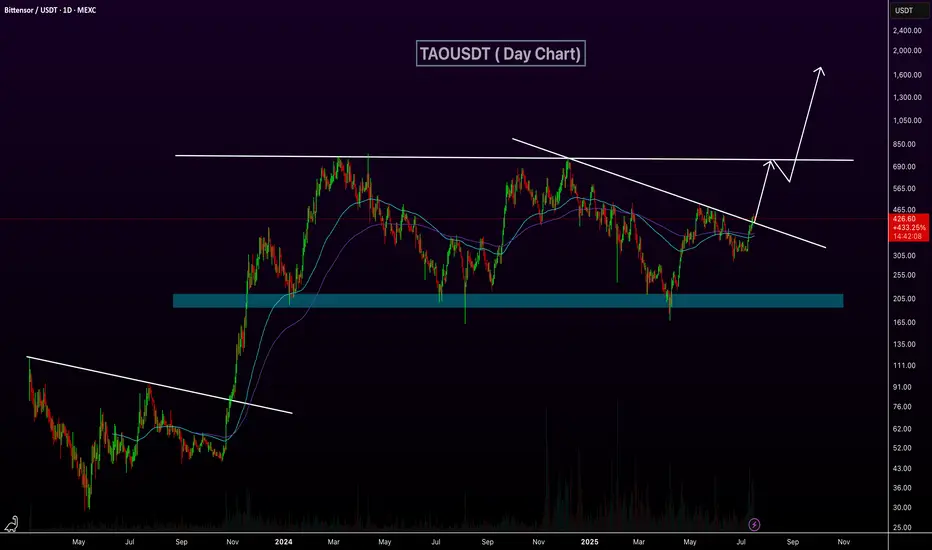
TAOUSDT Breaks Descending Trendline!BINANCE:TAOUSDT daily chart is showing a potential bullish breakout as price moves above a long-term descending trendline. This breakout, combined with support from the 100 and 200 EMAs, indicates growing upward momentum. If price holds above this trendline, the next key resistance lies around the $750 level. A successful breakout and retest could pave the way for a major rally toward $2,000. GETTEX:TAO
Regards
Hexa
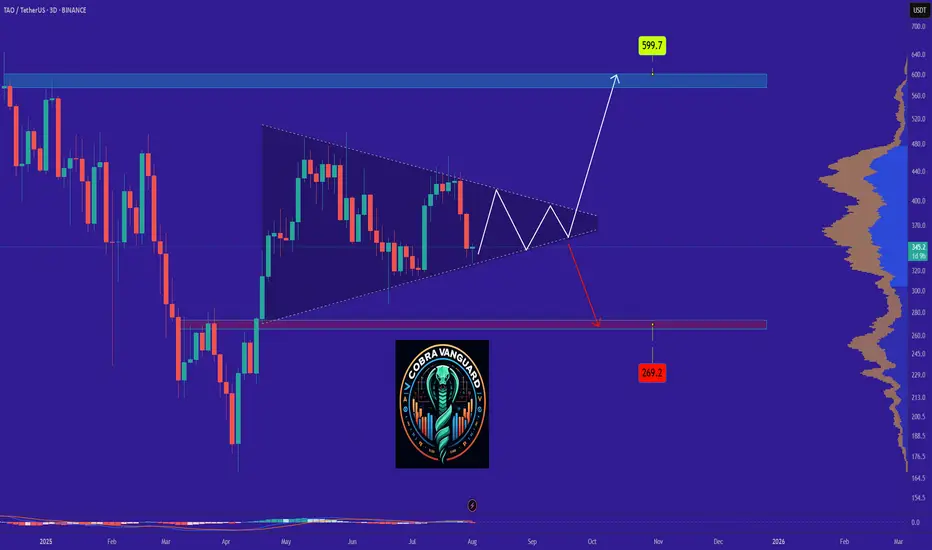
TAO It will grow soon...The TAO will increase $60 and reach to the top of the wedge in the coming days .
Best regards CobraVanguard.💚

Bittensor Goes Bullish · $1,107 Price Target Within 6 MonthsHere is a very interesting piece of information. The same 22-June low worked as support back in September 2024. Needless to say, the test of this level propelled a major bullish phase. Conditions are similar now, not the same but similar. Bittensor is stronger now compared to late 2024, so we can expect the bullish wave that follows also to be stronger and thus a $1,107 price target mid- to long-term. Within 3 to 6 months.
Today we have a bullish breakout from the current structure with confirmation of long-term support and the higher low. TAOUSDT is now entering a new wave of growth. This is a long-term event, this wave should last all through 2025 and possibly beyond.
You can find additional details on the chart.
Leave a comment if you have any questions. Follow if you enjoy the content and would like to see more.
Namaste.

$TAO, time for this AI coin to start movingIt can do something like this in the coming days, Taking my first bid here, second remaining incase bitcoin dips towards 105.2k. Will keep updating it.

TAO/USDT Potential Reversal Zone – Major Bounce OpportunityTAO/USDT is currently testing a critical support zone (highlighted in yellow) between $220 – $280, which has historically acted as a strong accumulation area. The price has shown multiple reactions from this region throughout 2024 and 2025, signaling that bulls may be preparing for a reversal.
🔍 Key Technical Levels:
Major Support Zone: $220 – $280
Immediate Resistance Levels:
$350.9
$462.9
$560.8
$600
$719.1
Long-Term Resistance: $780 (local high)
🔄 Scenario: If TAO successfully holds this support zone, a bullish reversal could be triggered with a potential rally toward the $350 level first. A break and retest above this could open the door for a sustained move towards $560 and beyond. The bullish projection is illustrated with the yellow arrow path, showing a potential multi-stage rally through key Fibonacci and structural levels.
📉 Invalidation: A confirmed break below $220 would invalidate this bullish setup and could push TAO toward lower lows, potentially retesting $170 or even $127 support levels.
📌 Summary: TAO is approaching a historically strong support base. If the structure holds and volume supports the reversal, we could see a powerful leg up toward $560 and possibly $719 in the medium term. Risk management is essential, especially with volatility around macroeconomic events and Bitcoin price movements.
