A Fast Way to Tell If a Market Actually Respects Its Seasonal.Most traders glance at a single seasonal curve, see a clean up-then-down shape, and assume the market will do the same again. Sometimes it will. Often it will not. The reason is simple: seasonal patterns drift. Old data carries the weight of decades-old market structure, one-off events, and conditions that no longer exist. So before putting any real conviction behind a seasonal trade, it is worth doing one quick visual check.
The check, in one sentence
If the last five years roughly match th
Tradevizion
Beyond 1–2%: Size Positions by Edge, Kelly & Risk of RuinWhy Fixed 1–2% Risk Is Not Enough: A Beginner's Guide to Adaptive Position Sizing
Introduction
If you have read any trading book or taken a course, you have probably heard: "Risk no more than 1–2% of your account per trade." That rule is widely used because it helps you survive losing streaks. But it has a flaw: it treats every trader and every strategy the same. A 1% risk might be too conservative for a strong edge, or too aggressive for a weak one.
This idea explains why adaptive risk
COT Report: Uncovering the "New Crop" SignalHow to Refine COT Analysis Using Term-Structure Alignment ("New Crop" Signal)
Most traders who use the Commitments of Traders (COT) report focus only on the aggregated Commercial net position from the Legacy combined report. While this provides a broad view of positioning, it blends all contract months together and hides how risk is distributed across the forward curve.
In this tutorial, we explore a more granular approach: comparing the standard Legacy Futures – Total Positions data with
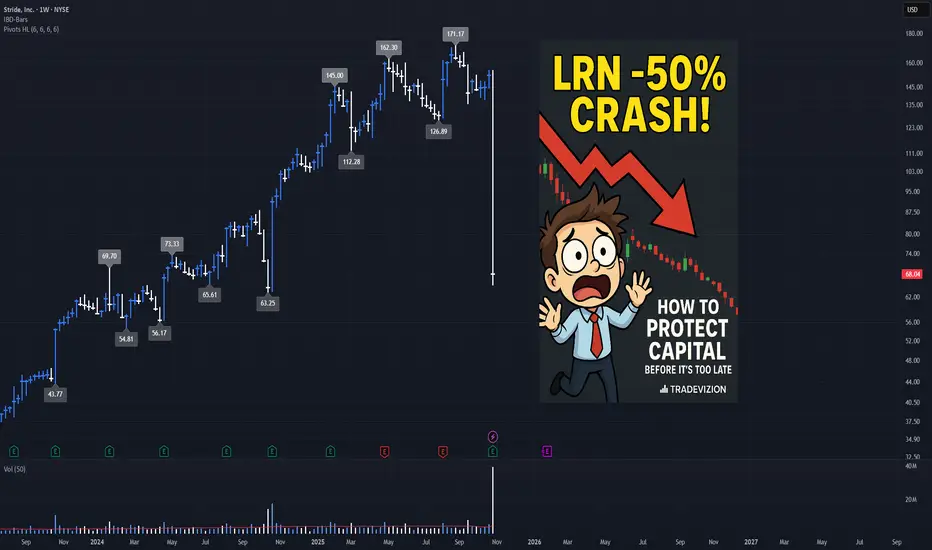
Capital Protection Guide: Learning from Catastrophic DrawdownCapital Protection Guide: Learning from Catastrophic Drawdowns - LRN Case Study
Overview
Catastrophic drawdowns—sudden, severe price declines of 30% or more in a single session—can devastate trading accounts, especially for beginners. This tutorial examines the real-world case of NYSE:LRN (Stride Inc.), which lost over 50% in a single day on October 29, 2025 , and provides practical strategies to protect your capital from similar disasters.
Understanding how to identify warning signs an
Warren Buffett's Approach to Long-Term Wealth BuildingUnderstanding Value Investing: Warren Buffett's Educational Approach to Long-Term Wealth Building
Learn the educational principles behind value investing and dollar-cost averaging strategies, based on historical market data and Warren Buffett's documented investment philosophy.
---
Introduction: The Million-Dollar Question Every Investor Asks
Warren Buffett—the Oracle of Omaha—has consistently advocated that index fund investing provides a simple, educational approach to long-term weal
From Scanner to Trade: Full Workflow GuidesFrom Scanner to Trade: Full Workflow Guides
Table of Contents
Introduction
Why a Full Workflow is Crucial for Consistent Trading
Step 1: Defining Your Edge-What to Scan For
Step 2: Setting Up Scanners in TradingView
Step 3: Filtering & Ranking Potential Trades
Step 4: Deep Analysis-Technical, Fundamental, and Sentiment Checks
Step 5: Planning the Trade-Entries, Exits, and Risk
Step 6: Executing the Trade and Real-Time Adjustments
Step 7: Trade Management-Monitoring and Ada
Calibrating Trading Indicators for Different MarketsCalibrating Trading Indicators for Different Markets: A Beginner's Guide
(Simple Steps to Adjust RSI , MACD , and Other Tools for Better Results)
Key Idea : Just like you'd tune a guitar differently for rock vs. classical music, trading tools like RSI or MACD need adjustments depending on what you're trading (stocks, crypto, forex) and how it moves. This guide shows you how to tweak these tools using price swings (pivot points) to make them work better for your specific asset
Here's Why I'm Bullish on TSLA: Smart Money is Buying...Here's Why I'm Bullish on NASDAQ:TSLA Multi-Timeframe Analysis Using Larry Williams' Methods
After a significant downtrend, NASDAQ:TSLA is presenting multiple bullish signals based on Larry Williams' methodology. The weekly and daily timeframes are aligning for a potential reversal opportunity with clearly defined risk parameters.
Weekly Timeframe Analysis
The weekly chart reveals several key bullish indicators:
- The COT Proxy Index shows commercials are buying at significantly
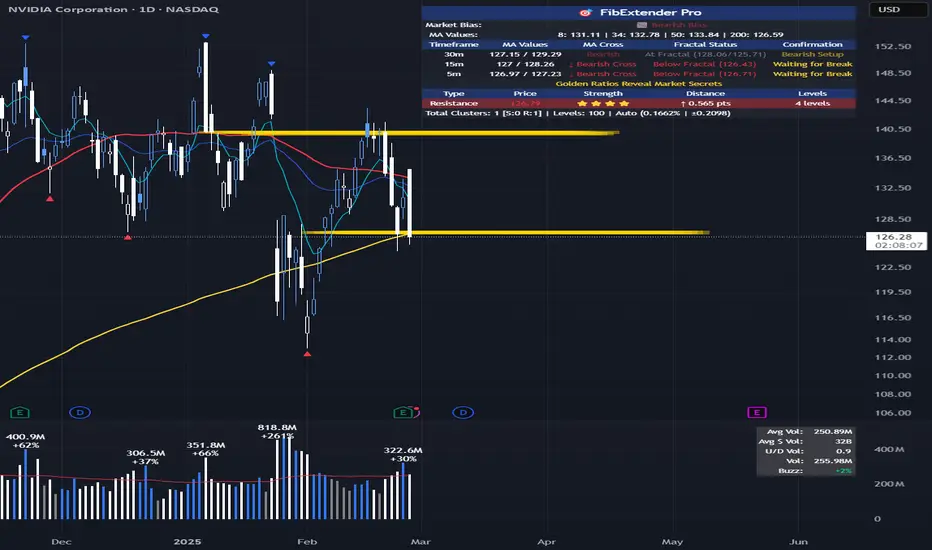
NVDA: Fibonacci cluster support and 200MA at 126.5. NASDAQ:NVDA : Fibonacci Cluster Support at 126.5 Sets Up Potential 10% Rally to 140
Looking at NVIDIA's technical setup, I've identified a critical support zone that could launch NASDAQ:NVDA toward a significant target if it holds.
Technical Analysis
The current price action shows NVIDIA testing a key support zone consisting of:
- Fibonacci cluster at 126.5
- 200 Moving Average support
If this support zone holds, I'm targeting the next Fibonacci cluster at 140, representing approximat
Sector Rotation Analysis: A Practical Tutorial Using TradingViewSector Rotation Analysis: A Practical Tutorial Using TradingView
Overview
Sector rotation is an investment strategy that involves reallocating capital among different sectors of the economy to align with their performance during various phases of the economic cycle. While academic studies have shown that sector rotation does not consistently outperform the market after accounting for transaction costs, it remains a popular framework for portfolio management.
This tutorial provides a step-b
SPX: MTF Cluster Support at 5,810 with EMA Confirmation StrategyCurrent Technical Setup
The SP:SPX is testing a significant cluster support level at 5,810, identified by FibExtender Pro with multiple timeframe confluence. The price has shown a clear reaction at this level, making it a potential launching point for a bullish move.
Entry Conditions
Primary Triggers Required:
8 EMA crossing above 34 EMA on 30-minute chart (currently bearish)
Price breaking above last swing high at 5,850
Price holding above cluster support at 5,810
Price Targets
BellRing Brands: Capitalizing on Health and Wellness GrowthBellRing Brands has broken out of a stage-one double-bottom base, signaling strong technical action and providing a compelling entry point. As a leading company in the health and wellness industry, BellRing Brands is well-positioned to benefit from the increasing demand for ready-to-drink protein shakes and nutrition bars. This breakout suggests a strong potential for further upside.
Technical Overview:
The stock has seen accumulation over the past several weeks, bouncing off the 21-day EMA
Amazon: Riding the E-Commerce and Cloud WaveAmazon is currently showing promising signs as it forms the right side of its base, presenting an excellent setup for long-term investors. With strong revenue streams from e-commerce and Amazon Web Services (AWS), the company remains a dominant force in multiple sectors. This diverse business model positions Amazon for sustained growth, even amid market fluctuations.
Technical Overview:
Recent price action shows Amazon bouncing off a strong support level around $182.38 , with its 21-day EMA
Tesla’s Next Move: Riding the Q3 MomentumDescription:
In this analysis, we dive deep into Tesla’s recent performance and explore potential future price action. Fueled by an impressive Q3 earnings beat, Tesla has seen a bullish surge. Here, I’ll guide you through key technical and fundamental insights, using the FibExtender Pro to map out support and resistance zones, and provide a structured plan for potential entry, profit targets, and stop-loss levels. My goal is to offer a clear perspective for those considering Tesla’s next mov
A Beginner’s Guide to Spotting High-Growth Stocks Like NvidiaWhen it comes to choosing stocks with explosive growth potential, understanding the core fundamentals and market trends of a company can make all the difference. For beginner investors, navigating the financial markets can be overwhelming, but focusing on companies with solid growth indicators, like NASDAQ:NVDA , can offer an edge. Known for its leadership in AI and advanced processing technology, Nvidia exemplifies how a strong market position and innovation pipeline can lead to robust growth
The Joy of Sharing: Embracing a Lifestyle of Giving.The Joy of Giving: Why Offering Free Ideas and Indicators to the TradingView Community is a Lifestyle, Not Just an Act
In the ever-evolving world of trading and investments, there is one platform that has successfully connected traders and investors worldwide— TradingView . This platform has become a haven for sharing trading insights, chart ideas, and custom-built indicators, allowing traders of all skill levels to grow, learn, and improve. But why should we offer our ideas and indicators to
Timeframe Trap: How to Trade Stress-Free and Avoid OvertradingChoosing the Right Timeframe for Trading: A Beginner's Guide to Reducing Stress and Avoiding Overtrading
Choosing the right timeframe for trading is one of the most crucial decisions any trader can make. Yet, for beginners, it can be confusing and overwhelming. From day trading to swing trading to long-term investing, each approach comes with its own set of challenges and opportunities. The wrong choice can lead to unnecessary stress, overtrading, and ultimately, financial losses. This guide w
Avoiding the Pump and Dump: A Beginner's GuideAvoiding the Pump and Dump: A Beginner's Guide to Protecting Your Investments
In the dynamic world of stock trading, new traders are constantly seeking ways to maximize profits and minimize risks. Unfortunately, one of the most deceptive and harmful schemes that can easily trap beginners is the infamous pump and dump scheme. This fraudulent practice has been around for decades, targeting unsuspecting traders by artificially inflating a stock's price and then swiftly cashing out, leaving the v
S&P 500 Index Market Exposure and Sector Insights The S&P 500 Index is currently in a confirmed uptrend as of October 4th, maintaining support above its 21-Day Moving Average (DMA) . With 4 distribution days , market conditions suggest some caution, but the overall uptrend remains intact.
Our current market exposure is recommended at 100% , reflecting confidence in the strength of the broader market.
Key Points:
Market Condition: The S&P 500 remains above the critical 21-DMA level, indicating continued positive momentum. This key
Nasdaq Composite: Market Exposure and Industry InsightsThe Nasdaq Composite is currently in a confirmed uptrend . As of October 4th, there are 3 distribution days , which implies mild pressure in the market, but conditions remain favorable overall. Our market exposure is suggested at 90% , indicating confidence with some caution.
Key Points:
Market Condition:
The Nasdaq's current uptrend is intact, with support holding above the 21-Day Moving Average (DMA) . This level is crucial and should be watched closely in the upcoming sessions fo