Regional & Country-Specific Global Markets1. North America
United States
The U.S. is the world’s largest economy and the beating heart of global finance. It hosts the New York Stock Exchange (NYSE) and NASDAQ, two of the biggest stock exchanges globally. The U.S. dollar serves as the world’s reserve currency, making American financial markets a benchmark for global trade and investment.
Strengths:
Deep and liquid capital markets
Technological innovation hubs (Silicon Valley, Boston, Seattle)
Strong consumer demand and advanced services sector
Risks:
High national debt levels
Political polarization affecting policy stability
Trade tensions with China and other countries
Key industries include technology, healthcare, energy, defense, and finance. U.S. policies on interest rates (through the Federal Reserve) ripple across every global market.
Canada
Canada’s economy is resource-heavy, with strengths in energy (oil sands, natural gas), mining (nickel, copper, uranium), and forestry. Toronto hosts a vibrant financial sector, and Canada’s stable political environment attracts global investors.
Strengths: Natural resources, stable banking sector
Challenges: Heavy reliance on U.S. trade, vulnerability to oil price swings
Mexico
As a bridge between North and Latin America, Mexico has growing manufacturing and automotive industries, heavily integrated with U.S. supply chains (especially under USMCA trade agreement). However, crime, corruption, and political risks remain concerns.
2. Europe
Europe is home to some of the world’s oldest markets and remains a global hub for trade, technology, and finance.
European Union (EU)
The EU is the world’s largest single market, with free movement of goods, people, and capital across 27 member states. The euro is the second-most traded currency globally.
Strengths: High levels of economic integration, advanced infrastructure, strong institutions
Weaknesses: Aging population, energy dependency (especially after the Russia-Ukraine war)
Germany
Germany is the powerhouse of Europe, leading in automobiles, engineering, chemicals, and renewable energy. Frankfurt is a major financial hub.
Opportunities: Transition to green energy, high-tech industries
Risks: Export dependency, demographic challenges
France
France blends industrial strength with luxury, fashion, and tourism industries. Paris is also a growing fintech hub.
United Kingdom
Post-Brexit, the UK operates independently of the EU, but London remains a global financial center. Britain leads in finance, pharmaceuticals, and services.
Eastern Europe
Countries like Poland, Hungary, and Romania are emerging as manufacturing hubs due to lower labor costs, attracting supply chain relocations from Western Europe.
3. Asia-Pacific
Asia-Pacific is the fastest-growing region, driven by China, India, and Southeast Asia.
China
China is the world’s second-largest economy and a manufacturing superpower. It dominates global supply chains in electronics, textiles, and increasingly, electric vehicles and renewable energy.
Strengths: Huge domestic market, government-led industrial policy, global export strength
Challenges: Debt, slowing growth, geopolitical tensions with the U.S.
Markets: Shanghai Stock Exchange, Shenzhen Stock Exchange, and Hong Kong as a global financial hub
India
India is one of the fastest-growing major economies, with strong potential in IT services, pharmaceuticals, digital payments, manufacturing, and renewable energy.
Strengths: Young population, digital transformation, strong services sector
Challenges: Infrastructure gaps, unemployment, bureaucratic hurdles
Markets: NSE and BSE, with rising global investor participation
Japan
Japan has a mature economy with global leadership in automobiles, electronics, and robotics. The Tokyo Stock Exchange is one of the largest in the world.
Strengths: Advanced technology, innovation, strong corporate governance
Challenges: Aging population, deflationary pressures
South Korea
South Korea is a global leader in semiconductors (Samsung, SK Hynix), automobiles (Hyundai, Kia), and consumer electronics. The KOSPI index reflects its market vibrancy.
Southeast Asia
Countries like Vietnam, Thailand, Indonesia, and Malaysia are emerging as new growth centers, benefiting from supply chain shifts away from China.
Vietnam: Manufacturing hub for electronics and textiles
Indonesia: Rich in resources like nickel (critical for EV batteries)
Singapore: Leading global financial and logistics hub
4. Latin America
Latin America’s markets are resource-driven but often volatile due to political instability and inflation.
Brazil
The largest economy in Latin America, Brazil is a major exporter of soybeans, coffee, iron ore, and oil. It also has a growing fintech and digital economy sector.
Argentina
Argentina struggles with recurring debt crises and inflation, but it has strong potential in lithium reserves, agriculture, and energy.
Chile & Peru
Both are resource-rich, particularly in copper and lithium, making them crucial for the global clean energy transition.
Mexico
(Already covered under North America, but plays a dual role in Latin America too.)
5. Middle East
The Middle East’s economies are largely oil-driven, but diversification is underway.
Saudi Arabia
Through Vision 2030, Saudi Arabia is reducing reliance on oil by investing in tourism, renewable energy, and technology. The Tadawul exchange is gaining global importance.
United Arab Emirates (UAE)
Dubai and Abu Dhabi are major global hubs for trade, logistics, and finance. Dubai International Financial Centre (DIFC) attracts global capital.
Qatar & Kuwait
Strong in natural gas exports and sovereign wealth investments.
Israel
Israel is a “startup nation,” leading in cybersecurity, AI, fintech, and biotech. Tel Aviv has a vibrant capital market.
6. Africa
Africa is rich in natural resources but has underdeveloped capital markets. Still, its youthful population and growing middle class present opportunities.
South Africa
The most advanced African economy with a diversified market in mining, finance, and retail. The Johannesburg Stock Exchange (JSE) is the continent’s largest.
Nigeria
Africa’s largest economy, dependent on oil exports, but also growing in fintech (mobile payments, digital banking).
Kenya
A leader in mobile money innovation (M-Pesa) and a gateway to East Africa.
Egypt
Strategically located, with a mix of energy, tourism, and agriculture. Cairo plays an important role in the region’s finance.
Opportunities & Risks Across Regions
Opportunities
Emerging markets (India, Vietnam, Nigeria) offer high growth potential.
Green energy and digital transformation create cross-border investment avenues.
Regional trade blocs (EU, ASEAN, USMCA, AfCFTA) enhance integration.
Risks
Geopolitical conflicts (Russia-Ukraine, U.S.-China tensions)
Currency fluctuations and debt crises in emerging markets
Climate change disrupting agriculture and infrastructure
Inflation and interest rate volatility
Conclusion
Regional and country-specific global markets together form the backbone of the international economic system. While North America and Europe remain financial powerhouses, Asia-Pacific is the fastest-growing engine, the Middle East is transforming from oil dependency to diversification, Latin America is leveraging its resources, and Africa stands as the future growth frontier.
For investors and businesses, the key lies in understanding the unique strengths, weaknesses, and risks of each market while recognizing their global interconnectedness. The future will likely see more multipolarity—where not just the U.S. and Europe, but also China, India, and regional blocs shape the course of the global economy.
Tradingideas

Market Analysis & Risk GloballyPart 1: Foundations of Global Market Analysis
1.1 What is Market Analysis?
Market analysis is the process of studying market conditions to understand demand, supply, pricing, growth potential, and risk. Globally, it covers:
Macroeconomic indicators (GDP growth, inflation, interest rates, unemployment).
Sectoral performance (energy, technology, finance, manufacturing, etc.).
Trade flows (imports, exports, balance of payments).
Capital flows (FDI, portfolio investment, cross-border lending).
Policy frameworks (monetary and fiscal policies, trade agreements, taxation).
Sentiment indicators (consumer confidence, investor sentiment, market volatility).
Global market analysis differs from domestic market study because it requires factoring in cross-border interactions and systemic risks.
1.2 Levels of Global Market Analysis
Macro-Level (Country/Region Analysis)
GDP growth trends.
Sovereign credit ratings.
Fiscal and monetary stability.
Political stability.
Meso-Level (Industry/Sector Analysis)
Technology adoption.
Energy transitions.
Healthcare innovation.
Financial market growth.
Micro-Level (Company/Asset Analysis)
Firm profitability.
Market share.
ESG compliance.
Global supply chain dependencies.
1.3 Drivers of Global Markets
Globalization & Trade Agreements – WTO, regional FTAs, BRICS cooperation.
Monetary Policy Coordination – Fed, ECB, BoJ, PBoC influence liquidity.
Technology & Innovation – AI, blockchain, automation.
Energy Transition – Shift from fossil fuels to renewables.
Demographics – Aging populations in developed nations, young workforce in emerging markets.
Geopolitics – Conflicts, sanctions, alliances, and trade wars.
Part 2: Types of Global Market Risks
2.1 Financial Risks
Currency Risk – Fluctuations in exchange rates. Example: USD strength impacts emerging markets’ debt repayment.
Interest Rate Risk – Rising global rates increase borrowing costs.
Credit Risk – Default risk for sovereign and corporate bonds.
Liquidity Risk – Difficulty in converting assets to cash during crises.
2.2 Economic Risks
Recession Risk – Global slowdowns like the 2008 crisis or 2020 pandemic.
Inflation Risk – High inflation erodes consumer purchasing power.
Commodity Risk – Oil, gold, or food price volatility.
Trade Risk – Tariffs, supply chain disruptions, protectionism.
2.3 Political & Geopolitical Risks
Wars & Conflicts – Russia-Ukraine, Middle East tensions.
Sanctions – U.S. vs China or Iran sanctions impacting trade.
Regulatory Risks – Antitrust rules, tech regulations, ESG norms.
Nationalism & Populism – Rising protectionist policies.
2.4 Environmental & Climate Risks
Climate Change – Extreme weather, rising sea levels.
Energy Transition – Stranded fossil fuel assets.
Carbon Taxes & ESG Pressures – Costs for polluting industries.
2.5 Technological Risks
Cybersecurity Threats – Attacks on financial systems.
Disruption by AI & Automation – Job losses, structural unemployment.
Digital Currency Risks – Volatility of cryptocurrencies and CBDC adoption challenges.
2.6 Systemic Risks
Global Financial Contagion – Domino effects of crises.
Banking Failures – 2008 Lehman Brothers scenario.
Shadow Banking & Derivatives – Hidden risks in opaque markets.
Part 3: Tools & Frameworks for Global Market Analysis
3.1 Fundamental Analysis
GDP, CPI, PMI, balance of trade.
Sovereign bond yields.
Corporate earnings across regions.
3.2 Technical Analysis (Global Indices & Commodities)
Nifty, Dow Jones, FTSE, Nikkei, Shanghai Composite.
Oil, gold, copper, wheat charts.
Volume profile and volatility indexes (VIX).
3.3 Sentiment & Behavioral Analysis
Fear & Greed Index.
Global consumer sentiment surveys.
Hedge fund positioning reports.
3.4 Risk Management Tools
Hedging Instruments: Futures, options, swaps.
Diversification: Across geographies and asset classes.
Value-at-Risk (VaR): Measuring downside risk.
Stress Testing: Scenario analysis of global shocks.
Part 4: Regional Perspectives in Market Risk
4.1 United States
Largest economy, reserve currency issuer.
Risks: Fed tightening, tech regulation, political polarization.
4.2 Europe
Eurozone debt crisis memories.
Brexit aftershocks.
Energy dependency on imports.
4.3 Asia
China: Property crisis, tech crackdown, geopolitical tensions.
India: High growth but vulnerable to oil shocks.
Japan: Aging population, yen volatility.
4.4 Emerging Markets
High growth, high volatility.
Dollar debt risk.
Vulnerability to capital flight.
4.5 Middle East & Africa
Oil dependency.
Political instability.
Transition to non-oil economies.
Part 5: Case Studies of Global Market Risks
5.1 2008 Global Financial Crisis
Trigger: U.S. housing bubble, Lehman Brothers collapse.
Risk lesson: Leverage + complex derivatives = systemic collapse.
5.2 COVID-19 Pandemic (2020)
Trigger: Health crisis turned economic crisis.
Risk lesson: Black swan events can halt global trade overnight.
5.3 Russia-Ukraine War (2022 onwards)
Trigger: Geopolitical conflict.
Risk lesson: Commodity shocks + sanctions reshape supply chains.
5.4 China Property Crisis (Evergrande)
Trigger: Overleveraged real estate.
Risk lesson: Emerging market debt crises have global spillovers.
Part 6: Mitigating Global Market Risks
6.1 For Investors
Diversification across regions.
Use of derivatives for hedging.
Regular portfolio rebalancing.
ESG-aligned investing for long-term resilience.
6.2 For Corporations
Hedging currency & commodity exposure.
Building resilient supply chains.
Geographic diversification of operations.
Cybersecurity investments.
6.3 For Policymakers
Coordinated monetary & fiscal responses.
Transparent regulations.
Climate-resilient policies.
Stronger global institutions (IMF, WTO, G20).
Part 7: Future of Global Market Risks
De-globalization vs. Re-globalization – Supply chains may shorten, but digital globalization accelerates.
Climate Emergency – Strongest long-term risk to global markets.
Rise of Multipolar World – U.S., China, India, and EU competing for dominance.
Digital Finance Expansion – AI, blockchain, CBDCs reshaping finance.
Black Swan Events – Pandemics, cyberwars, or systemic collapses cannot be ruled out.
Conclusion
Global market analysis and risk management are intertwined disciplines. The world economy is no longer a sum of separate markets but a single interconnected system. A shock in one corner—whether it be a pandemic, war, financial collapse, or natural disaster—spreads rapidly across others.
To thrive in such an environment, investors, companies, and governments must adopt dynamic risk management strategies, embrace diversification, and remain vigilant about macro and micro-level changes.
Ultimately, global market analysis is not about predicting the future with certainty but about building resilience against uncertainty.
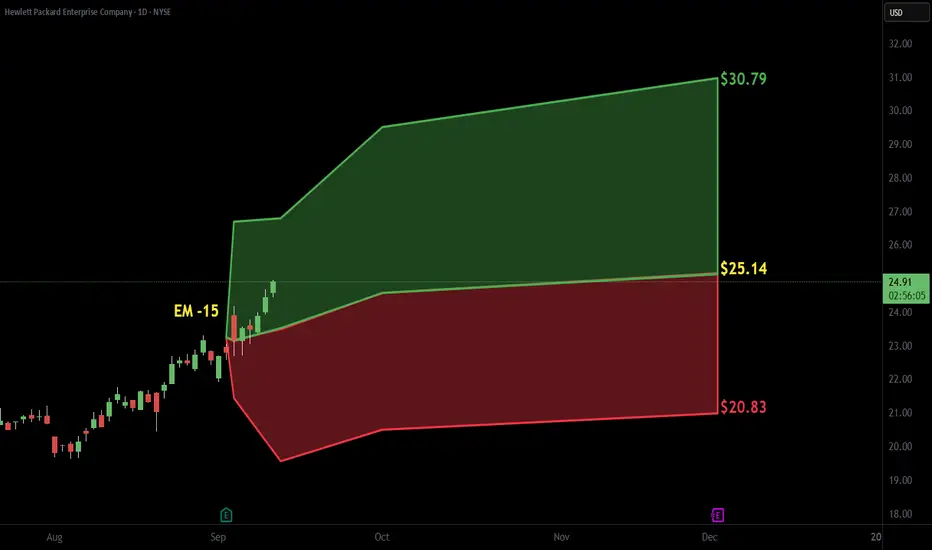
$HPE with a bullish outlook following its earnings #StocksThe PEAD projected a bullish outlook for NYSE:HPE after a positive over reaction following its earnings release, with an expected accuracy of 57.14%.
$AVGO with a bullish outlook following its earnings #StocksThe PEAD projected a bullish outlook for NASDAQ:AVGO after a positive over reaction following its earnings release, with an expected accuracy of 84%.

Gold Backing worldwidePart 1: The Origins of Gold as Money
Ancient Civilizations
Gold was used by Egyptians as early as 2600 BCE for jewelry, trade, and as a symbol of wealth.
In Mesopotamia, gold was valued as a unit of exchange in trade agreements.
Ancient Greeks and Romans minted gold coins, which spread across Europe and Asia.
Gold as Universal Acceptance
Because of its rarity, durability, and divisibility, gold became the universal standard of value across cultures. Unlike perishable goods or barter items, gold retained value and was easily transferable. This laid the foundation for gold to back economies centuries later.
Part 2: The Rise of the Gold Standard
19th Century Development
The classical gold standard emerged in the 19th century. Countries fixed their currencies to a certain amount of gold, ensuring stability in exchange rates. For example:
Britain officially adopted the gold standard in 1821.
Other major economies — Germany, France, the U.S. — followed by late 19th century.
How It Worked
Governments promised to exchange paper currency for a fixed quantity of gold.
This restrained governments from printing excessive money, keeping inflation low.
International trade was simplified because exchange rates were fixed by gold parity.
Benefits
Stability of currency.
Encouraged trade and investment.
Limited inflation due to money supply constraints.
Drawbacks
Restricted economic growth during crises.
Countries with trade deficits lost gold, forcing painful economic adjustments.
Part 3: Gold Backing in the 20th Century
World War I Disruptions
Most nations suspended the gold standard to finance military spending.
Post-war, many tried to return, but economic instability weakened confidence.
The Interwar Gold Exchange Standard
A modified version emerged in the 1920s, allowing reserve currencies (like the U.S. dollar and British pound) to be backed by gold.
This proved unstable and collapsed during the Great Depression.
Bretton Woods System (1944 – 1971)
After World War II, a new system was established at the Bretton Woods Conference.
The U.S. dollar became the anchor currency, convertible into gold at $35 per ounce.
Other currencies pegged themselves to the dollar.
This system created a gold-backed dollar world order where gold indirectly supported most global currencies.
Collapse of Gold Convertibility (1971)
In 1971, President Richard Nixon suspended gold convertibility (“Nixon Shock”).
Reasons: U.S. trade deficits, inflation, and inability to maintain gold-dollar balance.
This marked the beginning of fiat currency dominance.
Part 4: Gold’s Role in Modern Economies
Even though direct gold backing ended, gold remains vital:
1. Central Bank Reserves
Central banks worldwide hold gold as part of their foreign exchange reserves.
Provides diversification, stability, and acts as insurance against currency crises.
Major holders include the U.S., Germany, Italy, France, Russia, China, and India.
2. Store of Value & Inflation Hedge
Gold is a safe haven during economic or geopolitical crises.
Investors flock to gold when fiat currencies weaken.
3. Confidence in Currencies
Though fiat currencies are no longer backed by gold, the size of gold reserves adds credibility to a nation’s financial system.
4. Gold-Backed Financial Instruments
Exchange-traded funds (ETFs) backed by gold bullion.
Gold-backed digital currencies (such as tokenized assets on blockchain).
Part 5: Global Gold Reserves – Who Holds the Most?
According to World Gold Council data (2025 estimates):
United States: ~8,133 tonnes (largest holder, ~70% of reserves in gold).
Germany: ~3,350 tonnes.
Italy: ~2,450 tonnes.
France: ~2,435 tonnes.
Russia: ~2,300 tonnes (massively increased in past decade).
China: ~2,200 tonnes (increasing steadily to challenge U.S. dominance).
India: ~825 tonnes (also a large private gold ownership nation).
Smaller nations also hold gold as part of strategic reserves, although percentages vary.
Part 6: Regional Perspectives on Gold Backing
United States
No longer directly gold-backed, but U.S. gold reserves underpin the dollar’s strength.
Fort Knox remains symbolic of America’s monetary power.
Europe
The European Central Bank (ECB) and eurozone nations collectively hold significant gold.
Gold gives the euro credibility as a global reserve currency.
Russia
Increased gold reserves significantly to reduce dependence on the U.S. dollar amid sanctions.
Gold is a strategic geopolitical weapon.
China
Gradually building reserves to strengthen the yuan’s role in global trade.
Gold accumulation aligns with ambitions of yuan internationalization.
India
Holds large reserves at the central bank level and even larger amounts privately.
Gold plays a cultural, economic, and financial safety role.
Middle East
Gulf countries with oil wealth also diversify with gold reserves.
Some are exploring gold-backed digital currencies.
The Future of Gold Backing
Possible Scenarios
Status Quo – Fiat currencies dominate, gold remains a reserve hedge.
Partial Gold Return – Nations introduce partial gold-backing to increase trust.
Digital Gold Standard – Blockchain-based systems tied to gold reserves gain traction.
Multipolar Currency Order – Gold used more in BRICS or Asia-led alternatives to the dollar.
Likely Outcome
While a full gold standard is unlikely, gold’s role as a stabilizer and insurance policy will remain or even grow in uncertain times.
Conclusion
Gold backing has shaped global finance for centuries — from the classical gold standard to Bretton Woods and beyond. Although modern currencies are no longer directly convertible into gold, the metal continues to influence monetary policy, global reserves, and investor behavior. Central banks across the world still trust gold as the ultimate hedge against uncertainty.
In an age of rising geopolitical tensions, inflationary pressures, and digital finance, gold’s importance may even increase. Whether as part of central bank reserves, through gold-backed tokens, or as a foundation for regional trade systems, gold remains deeply woven into the fabric of the global monetary order.

Strategies & Styles in Global TradingPart 1: Foundations of Global Trading Strategies
1.1 Strategic Thinking in Trading
Trading strategies aim to answer three critical questions:
What to trade? (stocks, forex, commodities, indices, crypto, bonds).
When to trade? (entry and exit timing based on analysis).
How much to risk? (position sizing and risk management).
Without a defined strategy, trading becomes speculation driven by emotions.
1.2 Key Influences on Strategy
Global strategies are shaped by:
Market type: Developed (US, EU, Japan) vs. Emerging (India, Brazil, South Africa).
Time horizon: Long-term investments vs. intraday moves.
Information source: Technical analysis, fundamental analysis, quantitative models, or macroeconomic data.
Technology: Algorithmic trading, AI-driven predictions, and blockchain-based platforms.
Part 2: Major Trading Styles
2.1 Day Trading
Definition: Buying and selling within the same day, closing all positions before market close.
Features: Relies on volatility, liquidity, and rapid decision-making.
Tools Used: Intraday charts (1-min, 5-min, 15-min), moving averages, volume profile, momentum indicators.
Global Example: US tech stocks like Tesla or Nvidia are favorite day-trading instruments due to volatility.
Pros: Quick profits, no overnight risk.
Cons: High stress, requires constant monitoring, heavy brokerage costs.
2.2 Swing Trading
Definition: Holding trades for several days or weeks to capture medium-term price swings.
Basis: Combines technical chart patterns with macro/fundamental cues.
Global Example: Trading EUR/USD currency pair during central bank policy cycles.
Pros: Less stressful than day trading, better reward-to-risk ratio.
Cons: Requires patience; risk of overnight news shocks.
2.3 Position Trading
Definition: Long-term strategy, holding positions for months or years.
Basis: Fundamental analysis (earnings, economic cycles, interest rates).
Global Example: Long-term bullish positions in gold as an inflation hedge.
Pros: Less frequent monitoring, aligns with macro trends.
Cons: Requires strong conviction and capital lock-in.
2.4 Scalping
Definition: Ultra-short-term trading strategy, aiming for small profits on many trades.
Basis: Order flow, bid-ask spreads, micro-movements.
Global Example: Forex scalpers trade EUR/USD, GBP/USD due to high liquidity.
Pros: Rapid compounding of profits, no overnight risk.
Cons: High transaction costs, requires lightning-fast execution.
2.5 Algorithmic & Quantitative Trading
Definition: Using computer models, AI, and algorithms to trade automatically.
Methods: Statistical arbitrage, mean reversion, machine learning models.
Global Example: Hedge funds like Renaissance Technologies use quant models to outperform markets.
Pros: Emotion-free, scalable, works 24/7 in multiple markets.
Cons: Requires advanced coding skills, backtesting, and infrastructure.
2.6 High-Frequency Trading (HFT)
Definition: Subset of algorithmic trading using microsecond execution speed.
Basis: Profiting from inefficiencies in order books, arbitrage, spreads.
Global Example: Chicago Mercantile Exchange (CME) futures and US equities.
Pros: Can generate huge volumes of small profits.
Cons: Expensive technology, regulatory scrutiny, highly competitive.
2.7 Event-Driven Trading
Definition: Trading based on news, earnings reports, central bank decisions, or geopolitical events.
Global Example: Buying oil futures after OPEC production cuts; trading GBP during Brexit votes.
Pros: High potential returns.
Cons: High volatility, unpredictable outcomes.
2.8 Arbitrage Strategies
Definition: Profiting from price discrepancies between markets.
Types:
Spatial arbitrage (same asset, different markets).
Triangular arbitrage (currency mismatches).
Merger arbitrage (M&A deals).
Global Example: Simultaneously buying and selling Bitcoin on different exchanges.
Pros: Low-risk if executed correctly.
Cons: Requires speed, capital, and advanced systems.
Part 3: Global Trading Strategies by Asset Class
3.1 Equity Trading Strategies
Value Investing: Buying undervalued stocks (Warren Buffett approach).
Growth Investing: Targeting high-growth sectors like AI or EVs.
Momentum Trading: Riding the wave of strong price trends.
Pairs Trading: Long one stock, short another in the same sector.
3.2 Forex Trading Strategies
Carry Trade: Borrowing in low-interest currency, investing in high-interest currency.
Breakout Trading: Entering positions after a currency breaks key levels.
Range Trading: Buying low, selling high in sideways markets.
News Trading: Trading during central bank announcements or data releases.
3.3 Commodity Trading Strategies
Trend Following: Using moving averages for oil, gold, wheat.
Seasonal Strategies: Trading based on harvests or demand cycles.
Hedging: Producers using futures to lock in prices.
Spread Trading: Buying one commodity and selling another related one (e.g., crude oil vs. heating oil).
3.4 Bond & Fixed Income Trading Strategies
Yield Curve Strategies: Positioning based on steepening or flattening yield curves.
Credit Spread Trading: Exploiting risk premiums between corporate and government bonds.
Duration Hedging: Managing sensitivity to interest rate changes.
3.5 Cryptocurrency Trading Strategies
HODLing: Long-term holding of Bitcoin, Ethereum.
DeFi Yield Farming: Earning interest from decentralized lending protocols.
Arbitrage: Spot vs. futures arbitrage.
Momentum & Volatility Plays: Crypto thrives on extreme price swings.
Part 4: Risk Management & Psychology in Strategies
4.1 Risk Management Tools
Stop-Loss & Take-Profit Orders.
Position Sizing (1–2% capital per trade rule).
Diversification across assets and geographies.
Hedging with options/futures.
4.2 Psychological Styles in Trading
Aggressive vs. Conservative traders.
Discretionary vs. Systematic approaches.
Risk-seeking vs. Risk-averse behaviors.
Trading psychology (discipline, patience, emotion control) often defines whether a strategy succeeds or fails.
Part 5: Regional Differences in Global Trading Styles
US Markets: Heavy focus on tech stocks, options trading, and HFT.
Europe: Strong in forex, bonds, and energy trading.
Asia (Japan, China, India): Retail-dominated, rising algo-trading adoption.
Middle East: Commodity-heavy (oil, petrochemicals).
Africa & Latin America: Emerging markets, currency and commodity-driven.
Part 6: The Future of Global Trading Strategies
AI & Machine Learning: Automated strategies learning from big data.
Blockchain & Tokenization: 24/7 trading, decentralized exchanges.
Sustainable Trading: ESG-based strategies, carbon credits.
Cross-Asset Strategies: Linking equities, commodities, crypto, and derivatives.
Conclusion
Global trading is not just about buying and selling—it is about choosing the right strategy and style that aligns with one’s goals, risk tolerance, and market conditions.
From short-term scalping to long-term investing, from algorithmic arbitrage to macro-driven positioning, traders worldwide adapt strategies to seize opportunities across stocks, currencies, commodities, bonds, and cryptocurrencies.
The winning formula is not a single "best" style—it’s about discipline, adaptability, risk management, and continuous learning. Markets evolve, and so must strategies.
Trading Instruments in global market 1. Equities (Stocks)
Definition
Equities, also called stocks or shares, represent ownership in a company. By buying a share, an investor becomes a partial owner of that company and is entitled to a portion of profits (dividends) and potential capital appreciation.
Key Characteristics
Ownership: A share means holding equity in a company.
Voting rights: Common stockholders can vote in company decisions.
Returns: Gains come from dividends and share price appreciation.
Liquidity: Highly liquid, especially in large stock exchanges like NYSE, NASDAQ, NSE, and LSE.
Types of Equities
Common Stock – Offers voting rights and dividends.
Preferred Stock – Fixed dividends but limited/no voting rights.
Blue-Chip Stocks – Shares of large, stable companies.
Growth Stocks – Companies with high potential for expansion.
Penny Stocks – Low-priced, high-risk speculative shares.
Global Relevance
Equities are among the most popular instruments globally because they allow both short-term trading and long-term wealth creation. For example:
The US stock market is worth over $50 trillion.
Emerging markets like India, Brazil, and China are attracting growing investor interest due to rapid economic growth.
2. Fixed-Income Securities (Bonds)
Definition
A bond is essentially a loan made by an investor to a borrower (government, corporation, or institution). The borrower promises to pay interest (coupon) and return the principal on maturity.
Key Characteristics
Low risk (relative to stocks), especially in government bonds.
Predictable returns in the form of interest.
Variety of maturities (short, medium, and long-term).
Types of Bonds
Government Bonds (Treasuries, Gilts, Sovereign Bonds) – Issued by national governments.
Corporate Bonds – Issued by companies to raise capital.
Municipal Bonds – Issued by cities or states.
High-Yield (Junk) Bonds – Riskier but offer higher returns.
Inflation-Indexed Bonds – Adjust payouts with inflation rates.
Global Relevance
The US Treasury market is the largest bond market in the world and a global benchmark for interest rates.
Countries issue bonds to finance deficits, making them a cornerstone of international trade and finance.
3. Currencies (Foreign Exchange or Forex)
Definition
Currencies are the most liquid instruments globally, traded in the foreign exchange (forex) market, which has a daily turnover of over $7.5 trillion (2025 est.).
Key Characteristics
24-hour trading (Monday–Friday).
High leverage availability for traders.
Paired trading (e.g., USD/INR, EUR/USD, GBP/JPY).
Heavily influenced by macroeconomic policies, central banks, and geopolitics.
Major Currency Pairs
Major Pairs: EUR/USD, GBP/USD, USD/JPY, USD/CHF.
Minor Pairs: EUR/GBP, AUD/JPY.
Exotic Pairs: USD/INR, USD/TRY.
Uses
Businesses hedge against currency fluctuations.
Central banks maintain stability.
Traders speculate on price movements.
4. Commodities
Definition
Commodities are physical goods that are traded on exchanges, often used as raw materials in production.
Types of Commodities
Metals – Gold, Silver, Copper, Platinum.
Energy – Crude Oil, Natural Gas, Coal.
Agricultural Products – Wheat, Coffee, Cotton, Soybeans.
Livestock – Cattle, Hogs.
Key Characteristics
Hedging tool against inflation (gold, oil).
Geopolitical sensitivity (oil prices surge in wars/conflicts).
Global trade-driven demand and supply.
Global Relevance
Oil is the most traded commodity, central to global energy.
Gold acts as a safe-haven asset during economic uncertainty.
Agricultural commodities impact food security and global trade.
5. Derivatives
Definition
Derivatives are contracts whose value is derived from an underlying asset (stocks, bonds, currencies, or commodities).
Types of Derivatives
Futures – Agreements to buy/sell at a future date at a set price.
Options – Rights (not obligations) to buy/sell at a specific price.
Swaps – Contracts to exchange cash flows (e.g., interest rate swaps).
Forwards – Customized contracts between two parties.
Key Characteristics
Used for hedging risk (e.g., airlines hedge fuel prices).
Allow speculation on future price movements.
Offer leverage, amplifying gains/losses.
Global Relevance
The derivatives market is massive—worth quadrillions in notional value.
Exchanges like CME, ICE, and NSE are major global hubs.
6. Exchange-Traded Funds (ETFs) & Mutual Funds
ETFs
Traded like stocks on exchanges.
Track indexes, sectors, or commodities (e.g., SPDR S&P 500 ETF).
Offer diversification at low cost.
Mutual Funds
Actively managed investment vehicles.
Pool money from investors to buy diversified securities.
Suitable for long-term investors.
Global Relevance
ETFs have become highly popular among retail investors.
India and Asia are seeing a surge in passive investing via ETFs.
7. Real Estate Investment Trusts (REITs)
Definition
REITs are companies that own, operate, or finance income-generating real estate (offices, malls, warehouses).
Benefits
Provide exposure to real estate without direct ownership.
Offer dividends from rental income.
Highly liquid compared to physical property.
Global Relevance
REITs are major in the US, Singapore, and Australia, while India has introduced them in recent years for commercial real estate.
8. Hedge Funds & Private Equity Instruments
Hedge Funds
Pool money from wealthy investors to take aggressive positions.
Use derivatives, leverage, and short-selling.
Private Equity (PE)
Invests directly in private companies or buyouts.
Long-term, illiquid, but high potential returns.
Global Relevance
Hedge funds influence markets with speculative bets.
PE drives business growth, restructuring, and IPOs.
9. Cryptocurrencies & Digital Assets
Definition
Cryptocurrencies are decentralized digital currencies using blockchain technology.
Examples
Bitcoin (BTC) – The most popular crypto.
Ethereum (ETH) – Smart contracts and decentralized apps.
Stablecoins (USDT, USDC) – Pegged to fiat currencies.
Central Bank Digital Currencies (CBDCs) – Being developed by governments.
Characteristics
Volatile and speculative.
24/7 global trading.
Used for payments, remittances, and decentralized finance (DeFi).
Global Relevance
Cryptos are gaining institutional acceptance.
Some countries (El Salvador) have adopted Bitcoin as legal tender.
CBDCs could reshape global payment systems.
10. Alternative Trading Instruments
Carbon Credits – Traded to offset emissions.
Weather Derivatives – Used by agriculture/energy companies to hedge risks.
Art & Collectibles – NFTs and physical art as investment assets.
VIX Futures – Trading volatility index as a fear gauge.
Conclusion
The global market is a vast ocean of trading instruments, each serving a distinct purpose. From the stability of bonds to the high-risk-high-reward world of derivatives and cryptocurrencies, these instruments cater to every kind of investor—risk-averse savers, speculative traders, hedging corporates, and long-term wealth builders.
Understanding these instruments is crucial because the modern financial world is deeply interconnected. A shift in interest rates affects bonds, currencies, equities, and commodities simultaneously. Similarly, geopolitical events ripple across forex, oil, and stock markets.
For traders and investors, the key lies in:
Selecting the right mix of instruments.
Managing risks using diversification and hedging.
Staying updated on global economic and geopolitical trends.
In essence, trading instruments are not just tools of profit—they are the lifeblood of the global financial system. Mastering them is mastering the art of navigating global markets.

Global Supply Chain Shifts & Trade RoutesPart 1: Understanding Supply Chains and Trade Routes
What is a Supply Chain?
A supply chain is the complete journey of a product, from sourcing raw materials to manufacturing, distribution, and finally reaching consumers. It includes:
Raw materials (e.g., lithium for batteries, crude oil for fuel).
Manufacturing & assembly (factories, plants, workshops).
Logistics & transport (shipping, trucking, railways, air cargo).
Warehousing & distribution (storage, retail, e-commerce hubs).
End consumers (you and me).
What are Trade Routes?
Trade routes are the physical pathways (land, sea, or air) that connect countries and regions for commerce. Historically, these routes were shaped by geography and politics—like the Silk Road or the Spice Route. Today, they are dominated by major shipping lanes, railways, and digital trade corridors.
Part 2: Historical Evolution of Global Trade Routes
Ancient Trade Networks
Silk Road connected China with Europe, spreading silk, spices, and culture.
Maritime Spice Routes linked India, Southeast Asia, and the Middle East.
Trans-Saharan Routes carried gold, salt, and slaves across Africa.
Colonial Era & Maritime Dominance
European powers built sea empires, controlling trade in spices, tea, and cotton.
The discovery of sea routes around Africa and to the Americas reshaped global trade.
Colonization integrated global economies but created exploitative patterns.
Industrial Revolution & Global Integration
Railways and steamships shortened trade times.
The Suez Canal (1869) and Panama Canal (1914) became game-changers.
New manufacturing hubs emerged, fueling trade growth.
20th Century & Globalization
After World War II, institutions like WTO, IMF, and World Bank promoted open trade.
Containerization in the 1950s revolutionized logistics.
Asia, particularly China, became the world’s factory.
Part 3: Modern Supply Chains – How They Work
Modern supply chains are highly globalized and interdependent. For example:
An iPhone involves design in the U.S., chip production in Taiwan, assembly in China, and raw materials from Africa.
A car may have parts from Germany, software from India, steel from Japan, and be assembled in Mexico.
Features of Modern Supply Chains
Just-In-Time (JIT) Systems – reduce inventory costs but create vulnerabilities.
Multi-Country Production – different stages spread worldwide.
Specialization – each region focuses on what it does best (e.g., Vietnam in textiles, Taiwan in semiconductors).
Speed & Efficiency – enabled by digital tracking, AI, and automation.
Part 4: Major Shifts in Global Supply Chains
Global supply chains are not static. Recent decades have seen shifts driven by multiple forces:
1. Geopolitical Realignments
US-China trade war led to tariffs, restrictions, and diversification.
Countries like Vietnam, India, and Mexico became alternative manufacturing hubs.
New blocs (e.g., BRICS+, ASEAN) are reshaping trade patterns.
2. Pandemic Disruptions
COVID-19 exposed vulnerabilities: shipping delays, factory shutdowns, semiconductor shortages.
“Resilience” became a buzzword, with firms adopting China+1 strategies.
3. Technological Advancements
Automation, AI, and robotics reduce reliance on cheap labor.
Digital supply chains improve tracking and forecasting.
3D printing could localize production.
4. Environmental Pressures
Climate change affects shipping (melting Arctic routes, droughts in Panama Canal).
Push for green supply chains with lower carbon footprints.
ESG regulations are changing corporate strategies.
5. Regionalization & Nearshoring
Companies are moving closer to consumer markets.
Example: U.S. firms shifting from China to Mexico (nearshoring).
Europe considering North Africa and Eastern Europe.
Part 5: Key Global Trade Routes Today
1. Maritime Routes (80% of world trade by volume)
Suez Canal (Egypt) – shortcut between Europe and Asia.
Panama Canal (Central America) – connects Atlantic and Pacific.
Strait of Malacca – vital for oil and goods between Asia & the Middle East.
Strait of Hormuz – critical chokepoint for global oil supply.
2. Land Routes
China’s Belt and Road Initiative (BRI) – massive rail, road, and port infrastructure across Eurasia.
Trans-Siberian Railway – links Europe to Asia.
North-South Transport Corridor (Russia-Iran-India) – an emerging alternative.
3. Air Routes
Used mainly for high-value goods (electronics, medicines, luxury products).
Major hubs: Dubai, Singapore, Hong Kong, Frankfurt, Chicago.
4. Digital Routes
Undersea fiber-optic cables connect internet trade.
Digital trade is growing faster than physical trade.
Conclusion
The world’s supply chains and trade routes are in the middle of a historic transformation. Globalization once pushed for efficiency, low costs, and interconnectedness. Now, resilience, security, sustainability, and regional balance are the new priorities.
The Silk Roads of the past have evolved into today’s digital highways and maritime super-routes. As countries compete for influence, companies adapt strategies, and technologies redefine possibilities, the global supply chain will remain both a driver of prosperity and a barometer of geopolitical shifts.
The coming decades will not eliminate globalization but reshape it—making trade networks more regional, sustainable, and technologically advanced. In this new era, supply chains will not only determine economic success but also shape the balance of global power.

Global Currency Movements (Dollar, Euro, Yen, Yuan)Part 1: The U.S. Dollar (USD) – The Global Kingpin
1.1 Historical Background
The U.S. dollar has been the undisputed global reserve currency since World War II. Before that, the British pound held the crown during the height of the British Empire. But after the Bretton Woods Agreement (1944), the dollar became the anchor of the global monetary system, pegged to gold at $35 per ounce. Even after the Nixon Shock (1971) ended the gold standard, the dollar retained its dominance because of America’s economic size, deep financial markets, and political power.
1.2 Why the Dollar is So Dominant
Reserve Currency Status: Over 58% of global foreign exchange reserves are in USD.
Petrodollar System: Oil and many other commodities are priced and traded in dollars.
Financial Markets: U.S. bond markets are the deepest and most liquid, attracting global investors.
Military and Political Power: The U.S. exerts influence through sanctions, trade deals, and global institutions.
1.3 Movements of the Dollar
The dollar index (DXY) tracks the USD against a basket of currencies (EUR, JPY, GBP, CAD, SEK, CHF). It rises during:
Tight U.S. monetary policy (higher interest rates attract foreign capital).
Global crises (investors flee to dollar as a safe-haven).
Weakness in other currencies (especially Euro and Yen).
It falls during:
Loose monetary policy (printing money, quantitative easing).
High U.S. deficits and debt concerns.
Strong growth abroad (capital flows shift to emerging markets).
1.4 Impact of Dollar Movements
Strong Dollar: Bad for U.S. exporters, good for U.S. consumers (cheaper imports). Hurts emerging markets with dollar-denominated debt.
Weak Dollar: Boosts U.S. exports, fuels inflation at home, but supports global liquidity.
Part 2: The Euro (EUR) – The Challenger
2.1 Birth of the Euro
The Euro was launched in 1999 as a bold project of European integration. Today, 20 of 27 EU nations use the Euro, making it the second-most traded currency after the dollar.
2.2 Strengths of the Euro
Large Economy: The Eurozone has a GDP close to the U.S.
Trade Power: Europe is a major exporter of machinery, luxury goods, and chemicals.
Reserves: Around 20% of global reserves are in euros.
2.3 Weaknesses of the Euro
Lack of Fiscal Unity: Different countries, different budgets, but one currency.
Debt Crises: The 2010–2012 Eurozone debt crisis (Greece, Italy, Spain) exposed structural flaws.
Political Tensions: Brexit and rising nationalism pose risks.
2.4 Euro Movements
The euro’s value against the dollar (EUR/USD) is the world’s most traded currency pair. It rises when:
The European Central Bank (ECB) raises rates.
Europe has strong trade surpluses.
Dollar weakens due to U.S. deficits.
It falls when:
Debt crises or recessions hit Europe.
Energy shocks raise import costs (Europe imports lots of oil & gas).
ECB follows looser monetary policy compared to the Fed.
2.5 Impact of Euro Movements
Strong Euro: Hurts European exports but reduces import costs.
Weak Euro: Boosts exports but fuels inflation (especially energy prices).
Part 3: The Japanese Yen (JPY) – The Safe Haven
3.1 Historical Role
Japan became a global economic powerhouse in the 1970s–80s. The yen was seen as a strong currency due to Japan’s trade surpluses, technological dominance, and manufacturing exports.
3.2 Why Yen is a Safe Haven
High Current Account Surplus: Japan consistently exports more than it imports.
Political Stability: Despite slow growth, Japan is politically stable.
Low Inflation: The yen has maintained purchasing power compared to many currencies.
3.3 Yen Movements
The yen is often linked to carry trades:
Japan keeps ultra-low interest rates.
Investors borrow cheaply in yen and invest in higher-yielding assets abroad.
When global risk sentiment worsens, investors unwind trades, repurchasing yen → yen strengthens.
So the yen tends to:
Strengthen in crises (safe-haven flows).
Weaken when global markets are bullish (carry trades flourish).
3.4 Impact of Yen Movements
Strong Yen: Hurts Japanese exporters like Toyota, Sony, and Panasonic. But lowers import costs (energy, raw materials).
Weak Yen: Helps exporters, boosts inflation, but reduces Japanese consumers’ purchasing power.
Part 4: The Chinese Yuan (CNY/RMB) – The Rising Power
4.1 Historical Transformation
Before the 2000s, the yuan was tightly controlled and not relevant globally. But as China opened up, became the world’s factory, and the second-largest economy, its currency gained importance.
In 2016, the IMF included the yuan in its SDR (Special Drawing Rights) basket, alongside the dollar, euro, yen, and pound—cementing its status as a global currency.
4.2 Controlled Currency
Unlike the dollar, euro, or yen, the yuan is not fully free-floating. The People’s Bank of China (PBOC) sets a daily reference rate and allows it to trade within a band.
4.3 Yuan Movements
The yuan rises when:
China’s trade surplus is strong (exports booming).
PBOC supports stability to attract global investors.
Global demand for Chinese bonds and equities grows.
It weakens when:
China faces capital outflows.
U.S. imposes tariffs or sanctions.
Domestic economy slows down (property crisis, low growth).
4.4 China’s Strategy
China actively promotes the yuan in trade (especially with Belt & Road partners). Many oil deals with Russia, Iran, and Middle Eastern countries are increasingly settled in yuan—challenging the petrodollar system.
4.5 Impact of Yuan Movements
Strong Yuan: Makes Chinese exports less competitive but strengthens China’s global financial credibility.
Weak Yuan: Helps exports but risks capital flight and global accusations of “currency manipulation.”
Part 5: Interplay Between Dollar, Euro, Yen, and Yuan
Currencies don’t move in isolation—they interact.
Dollar vs Euro: Often a mirror image. If dollar rises, euro falls (and vice versa).
Dollar vs Yen: Sensitive to Fed and Bank of Japan interest rate policies.
Dollar vs Yuan: Politically charged, linked to U.S.-China trade tensions.
Euro vs Yen/Yuan: Reflects Europe’s role in Asia trade.
These currencies dominate Forex trading:
EUR/USD → most traded.
USD/JPY → second most traded.
USD/CNY → increasingly important.
Conclusion
The U.S. Dollar, Euro, Yen, and Yuan are not just symbols on forex screens—they are reflections of global power, trade, and politics. The dollar remains king, the euro is a strong but fractured challenger, the yen is a safe haven, and the yuan is the ambitious rising star.
Currency movements will continue to shape the global economy—deciding who gains, who loses, and how wealth shifts across borders. For traders, policymakers, and everyday citizens, watching these four currencies is key to understanding the world’s financial heartbeat.

US Federal Reserve Policy & Global Interest RatesPart I: The Role of the Federal Reserve
1. Origin and Mandate
The Federal Reserve was created in 1913 to stabilize the U.S. financial system after frequent banking crises. Today, its core mandate, often referred to as the dual mandate, is:
To maintain price stability (control inflation).
To achieve maximum employment.
Unlike some central banks (e.g., ECB, which focuses mainly on inflation), the Fed balances growth and stability.
2. Policy Tools
The Fed has three primary tools:
Federal Funds Rate (FFR): The short-term interest rate at which banks lend to each other. Adjustments to the FFR ripple through the economy, affecting borrowing costs for mortgages, auto loans, and corporate credit.
Open Market Operations (OMO): Buying or selling government securities to manage liquidity in the financial system.
Reserve Requirements: Minimum reserves banks must hold (rarely changed now).
Since the 2008 financial crisis, new unconventional tools have been added:
Quantitative Easing (QE): Large-scale bond purchases to inject liquidity and lower long-term interest rates.
Forward Guidance: Communicating future policy intentions to shape market expectations.
Part II: How Fed Policy Shapes Global Interest Rates
1. The Dollar’s Dominance
The U.S. dollar is used in over 85% of global foreign exchange transactions and is the world’s leading reserve currency. This means when the Fed changes rates, it directly impacts the global cost of capital.
2. Capital Flows and Emerging Markets
When U.S. interest rates are low, investors look abroad for higher yields, often pouring money into emerging markets (India, Brazil, Indonesia, etc.). When the Fed raises rates, capital tends to flow back into the U.S., pressuring emerging market currencies and raising borrowing costs.
Example: The 2013 Taper Tantrum, when the Fed hinted at reducing QE, triggered massive outflows from emerging markets, weakening their currencies and forcing many to raise domestic interest rates to protect stability.
3. Global Bond Yields
U.S. Treasury bonds are the global benchmark for “risk-free” assets. If U.S. yields rise (due to Fed tightening), global bond yields also tend to rise as investors demand comparable returns. This impacts corporate debt, mortgages, and sovereign bonds worldwide.
4. Exchange Rates and Trade
Higher U.S. rates make the dollar stronger. This hurts exporters in countries like Japan, South Korea, and India (whose currencies weaken), but helps U.S. consumers by making imports cheaper.
Part III: Historical Case Studies
1. The Volcker Era (1979–1987)
Paul Volcker, then Fed Chairman, famously raised interest rates to nearly 20% to combat runaway inflation. This caused a U.S. recession but restored price stability. Globally, developing nations faced debt crises because their dollar-denominated loans became unpayable at higher rates.
2. Dot-Com Bubble and 2001 Recession
After the dot-com crash, the Fed cut rates sharply to support the economy. Low global interest rates encouraged borrowing and fueled asset bubbles in housing markets around the world.
3. 2008 Global Financial Crisis
The Fed slashed rates to near zero and launched QE. This flooded the world with cheap liquidity, boosting global markets but also encouraging excessive risk-taking in emerging economies.
4. 2013 Taper Tantrum
When the Fed signaled an end to QE, global markets panicked. Emerging market currencies crashed, and many central banks had to raise interest rates defensively.
5. COVID-19 Pandemic (2020–2022)
The Fed again cut rates to zero and launched massive QE, injecting trillions into the system. This stabilized markets but also fueled inflation globally.
6. Inflation and Rate Hikes (2022–2024)
As inflation surged to multi-decade highs, the Fed raised rates aggressively from near zero to over 5%. This had global consequences:
Borrowing costs rose worldwide.
Currencies like the Indian Rupee and Japanese Yen weakened.
Dollar-denominated debt in developing nations became more expensive.
Part IV: Global Interdependence of Interest Rates
1. Major Central Banks and Fed Influence
ECB (Eurozone): Often follows Fed moves but balances inflation with fragile growth in southern Europe.
BoJ (Japan): Maintains ultra-low rates due to deflationary pressures, but Fed hikes force it to intervene to protect the yen.
PBoC (China): Sets its own path but faces currency depreciation when the Fed tightens.
RBI (India): Often compelled to adjust policy to stabilize the rupee and control imported inflation when Fed acts.
2. Interest Rate Differentials
Investors exploit differences between U.S. and global rates through carry trades (borrowing in low-yielding currencies like yen, investing in higher-yielding assets). Fed policy shifts can reverse these flows quickly, destabilizing markets.
3. Debt Vulnerability
Many emerging nations borrow in U.S. dollars. When Fed hikes occur:
Dollar strengthens.
Debt servicing costs rise.
Sovereign default risks increase (e.g., Sri Lanka in 2022).
Part V: Current Global Dynamics (2024–2025 Context)
High U.S. Rates: As of 2025, Fed policy remains restrictive, keeping rates elevated to ensure inflation is under control.
Divergence Across Economies:
U.S. and Europe are tightening.
Japan is only slowly exiting negative interest rates.
Emerging markets are balancing between growth and inflation pressures.
Global Debt Stress: Record-high global debt (over $300 trillion) makes the world highly sensitive to Fed policy.
Dollar Liquidity Premium: With global uncertainty, investors continue to seek U.S. assets, reinforcing the Fed’s influence.
Part VI: Risks and Challenges
1. Inflation vs. Recession
The Fed’s challenge is to cool inflation without causing a deep recession. If it overtightens, global growth suffers.
2. Currency Wars
Countries may intervene in foreign exchange markets to protect competitiveness when the dollar strengthens.
3. Financial Stability
High rates can trigger bank collapses (as seen in Silicon Valley Bank 2023) and strain weaker economies.
4. Geopolitical Factors
Wars, trade tensions, and energy crises interact with Fed policy, complicating interest rate alignment globally.
Conclusion
The U.S. Federal Reserve’s policies are the anchor of the global financial system. Whether through rate hikes, cuts, or balance sheet operations, Fed decisions ripple across borders, influencing global interest rates, capital flows, exchange rates, and debt sustainability.
History shows that when the Fed tightens, global borrowing costs rise and emerging markets feel the pinch. When it loosens, liquidity floods the world, sometimes fueling bubbles.
As of 2025, the Fed’s balancing act between inflation control and economic stability continues to define the trajectory of global interest rates. For investors, policymakers, and businesses worldwide, keeping a close eye on the Fed is not optional—it is essential.

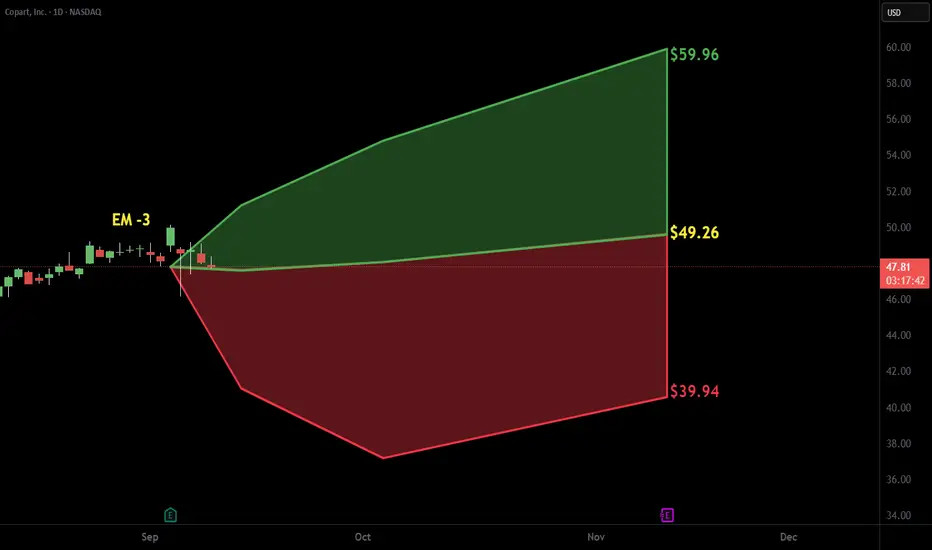
$CPRT with a bullish outlook following its earnings #StocksThe PEAD projected a bullish outlook for NASDAQ:CPRT after a Negative Over Reaction following its earnings release, with an expected accuracy of 70%.
$LULU with a bullish outlook following its earnings #StocksThe PEAD projected a bullish outlook for NASDAQ:LULU after a negative under reaction following its earnings release, with an expected accuracy of 75%.

GOLD WEEKLY CHART MID/LONG TERM ROUTE MAPWeekly Chart Update
Please see update on our weekly chart idea.
Sunday we stated that we had the weekly body close above the channel top at 3576 and now opened the door to the larger 3659 long-term gap target.
- this target is now complete
We will now look for a close above 3659 for a continuation or failure to lock will follow with a rejection into lower levels for support.
🔹 Range Support Levels
3576 and 3482 now act as layered support levels to keep the bullish case intact within this range.
Updated Levels to Watch
📉 Support – 3482 & 3576
Key supports for this new range. Holding above 3576 strengthens the case for continuation toward 3659. A failure back below 3576 puts 3482 into play as the next defensive level.
📈 Resistance – 3732
This becomes the next upside objective if structure holds above 3659.
Thanks as always for your support,
Mr Gold
GoldViewFX

GOLD 4H CHART ROUTE MAP UPDATEHey Everyone,
This is a follow up update on our 4H chart idea that we shared Sunday stating that we still had the final gap in the range left.
EMA5 cross and cross and lock above 3561 left 3615 open.
- This target was hit this week now completing our 4H chart idea.
Keep an eye out for our NEW 4H chart idea with updated levels and route map.
BULLISH TARGET
3424 - DONE
EMA5 CROSS AND LOCK ABOVE 3424 WILL OPEN THE FOLLOWING BULLISH TARGETS
3499 - DONE
EMA5 CROSS AND LOCK ABOVE 3499 WILL OPEN THE FOLLOWING BULLISH TARGET
3561 - DONE
EMA5 CROSS AND LOCK ABOVE 3561 WILL OPEN THE FOLLOWING BULLISH TARGET
3615 - DONE
As always, we will keep you all updated with regular updates throughout the week and how we manage the active ideas and setups. Thank you all for your likes, comments and follows, we really appreciate it!
Mr Gold
GoldViewFX

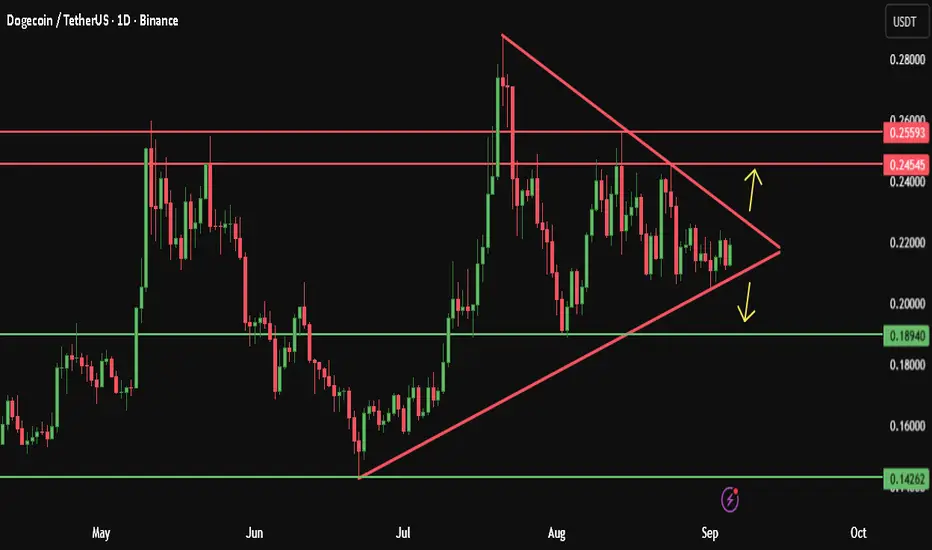
Dogecoin A potential explosive move is comingWe are currently observing the formation of a Symmetrical Triangle, suggesting the market is coiling up for a significant move.
A bullish breakout to the upside would likely target the upper resistance zone 0.2454 and 0.25593.
In the event of a bearish breakdown, we could see a decline towards the lower support at 0.18940 and 0.14262.
Let’s keep a close eye on this pattern for a confirmed direction.
please note :
this is not financial advice — it reflects only my personal opinion.
PLEASE always do your own research before trading .. Good luck with your trades.
International Payment Systems (SWIFT, CBDCs)Part I: The Evolution of International Payment Systems
1. The Early Days of Cross-Border Payments
Historically, cross-border payments were facilitated through:
Gold and Silver Settlements: Merchants exchanged precious metals, which were universally recognized as stores of value.
Bills of Exchange: Used in medieval trade, these paper instruments allowed merchants to settle accounts without moving physical assets.
Correspondent Banking: In the 19th and 20th centuries, banks built networks of correspondent relationships to settle payments across borders.
These methods were slow, costly, and prone to risks such as fraud, counterparty default, and political instability.
2. The Bretton Woods System and Beyond
After World War II, the Bretton Woods Agreement (1944) created the U.S. dollar–centric system, where the dollar was convertible into gold and became the dominant reserve currency. This system enhanced cross-border payments but still relied heavily on correspondent banks.
Following the collapse of Bretton Woods in 1971, fiat currencies began floating freely, further complicating international payments as exchange rate volatility increased.
3. The Rise of Electronic Payment Systems
The digital era of the late 20th century transformed payments:
CHIPS (Clearing House Interbank Payments System) in the U.S.
TARGET2 in Europe.
Fedwire for domestic U.S. transfers.
SWIFT, which emerged as the global financial messaging system connecting thousands of banks.
Part II: SWIFT – The Backbone of Global Financial Messaging
1. What is SWIFT?
Founded in 1973 and headquartered in Belgium, SWIFT (Society for Worldwide Interbank Financial Telecommunication) is not a payment system itself but a secure messaging network that enables banks and financial institutions worldwide to exchange standardized financial messages.
Key functions include:
Transmitting payment instructions (wire transfers, securities transactions, trade finance documents).
Enabling standardization through message formats (MT/MX messages).
Providing security with encrypted and authenticated communication channels.
2. How SWIFT Works
Participants: Over 11,000 institutions in 200+ countries.
Message Types: SWIFT MT (Message Type) and newer ISO 20022 MX formats.
Process:
A bank initiates a payment request via SWIFT.
The message is sent securely to the counterparty bank.
Actual fund settlement occurs separately through correspondent banking or clearing systems.
3. Why SWIFT Became Dominant
Global Reach: No other network connected as many banks worldwide.
Security: High encryption standards and authentication.
Neutrality: As a cooperative owned by member institutions, SWIFT is not tied to any single nation-state (though geopolitics complicates this claim).
Efficiency: Faster than telex, fax, or older systems.
4. SWIFT’s Economic and Political Significance
Handles millions of messages daily, representing trillions of dollars in transactions.
Acts as a gatekeeper of the international financial system.
Has been used as a tool of geopolitical leverage, with nations being excluded (e.g., Iran, Russia).
5. Limitations of SWIFT
Not instant: Settlement still depends on correspondent banking, which can take 2–5 days.
Expensive: Multiple intermediaries add costs (correspondent bank fees, FX spreads).
Opaque: Hard for individuals and small businesses to track payments in real time.
Geopolitical risk: Heavy influence from the U.S. and EU raises questions of neutrality.
Part III: Central Bank Digital Currencies (CBDCs) and the Future of Payments
1. What are CBDCs?
Central Bank Digital Currencies (CBDCs) are digital forms of sovereign money issued directly by central banks. Unlike cryptocurrencies (Bitcoin, Ethereum) or stablecoins (USDT, USDC), CBDCs are:
Legal tender, backed by the state.
Centralized, controlled by the central bank.
Stable in value, tied to fiat currencies.
CBDCs can be classified into:
Retail CBDCs: For use by the general public (e.g., digital yuan wallet).
Wholesale CBDCs: For interbank and institutional settlements.
2. Motivations for CBDC Development
Central banks globally are exploring CBDCs for reasons including:
Faster and cheaper payments (especially cross-border).
Financial inclusion for unbanked populations.
Reduced reliance on private intermediaries (Visa, Mastercard, SWIFT).
Geopolitical sovereignty (reducing dollar dependency).
Improved monetary policy tools (programmable money, negative rates).
3. CBDCs in Cross-Border Payments
CBDCs offer potential solutions to SWIFT’s limitations:
Instant settlement: Peer-to-peer transfers between central banks.
Lower cost: Eliminates correspondent banking layers.
Transparency: Real-time tracking of payments.
Programmability: Smart contracts for automated compliance.
4. Leading CBDC Projects Worldwide
China: Digital Yuan (e-CNY) already in pilot across multiple cities and tested for cross-border use.
Europe: The European Central Bank is developing a Digital Euro.
India: The Reserve Bank of India launched pilot programs for the Digital Rupee in 2022.
USA: The Federal Reserve is researching a Digital Dollar, though progress is slower.
Multi-CBDC Platforms: Projects like mBridge (BIS, China, UAE, Thailand, Hong Kong) aim to build interoperable cross-border CBDC networks.
Part IV: SWIFT vs. CBDCs – Collaboration or Competition?
1. Will CBDCs Replace SWIFT?
Possibility: If central banks interconnect CBDCs directly, the need for SWIFT messages may decline.
Reality: Transition will be slow; SWIFT’s vast network is difficult to replicate overnight.
2. SWIFT’s Response
SWIFT is experimenting with CBDC interoperability solutions, connecting multiple digital currencies through its network.
Focus on ISO 20022 standardization to ensure compatibility with CBDC systems.
Partnerships with central banks to ensure relevance in the digital era.
3. Coexistence Scenario
In the short to medium term, SWIFT and CBDCs may coexist:
SWIFT remains dominant for traditional bank-to-bank messaging.
CBDCs gain traction for specific corridors, especially in Asia and emerging markets.Part I: The Evolution of International Payment Systems
1. The Early Days of Cross-Border Payments
Historically, cross-border payments were facilitated through:
Gold and Silver Settlements: Merchants exchanged precious metals, which were universally recognized as stores of value.
Bills of Exchange: Used in medieval trade, these paper instruments allowed merchants to settle accounts without moving physical assets.
Correspondent Banking: In the 19th and 20th centuries, banks built networks of correspondent relationships to settle payments across borders.
These methods were slow, costly, and prone to risks such as fraud, counterparty default, and political instability.
2. The Bretton Woods System and Beyond
After World War II, the Bretton Woods Agreement (1944) created the U.S. dollar–centric system, where the dollar was convertible into gold and became the dominant reserve currency. This system enhanced cross-border payments but still relied heavily on correspondent banks.
Following the collapse of Bretton Woods in 1971, fiat currencies began floating freely, further complicating international payments as exchange rate volatility increased.
3. The Rise of Electronic Payment Systems
The digital era of the late 20th century transformed payments:
CHIPS (Clearing House Interbank Payments System) in the U.S.
TARGET2 in Europe.
Fedwire for domestic U.S. transfers.
SWIFT, which emerged as the global financial messaging system connecting thousands of banks.
Part II: SWIFT – The Backbone of Global Financial Messaging
1. What is SWIFT?
Founded in 1973 and headquartered in Belgium, SWIFT (Society for Worldwide Interbank Financial Telecommunication) is not a payment system itself but a secure messaging network that enables banks and financial institutions worldwide to exchange standardized financial messages.
Key functions include:
Transmitting payment instructions (wire transfers, securities transactions, trade finance documents).
Enabling standardization through message formats (MT/MX messages).
Providing security with encrypted and authenticated communication channels.
2. How SWIFT Works
Participants: Over 11,000 institutions in 200+ countries.
Message Types: SWIFT MT (Message Type) and newer ISO 20022 MX formats.
Process:
A bank initiates a payment request via SWIFT.
The message is sent securely to the counterparty bank.
Actual fund settlement occurs separately through correspondent banking or clearing systems.
3. Why SWIFT Became Dominant
Global Reach: No other network connected as many banks worldwide.
Security: High encryption standards and authentication.
Neutrality: As a cooperative owned by member institutions, SWIFT is not tied to any single nation-state (though geopolitics complicates this claim).
Efficiency: Faster than telex, fax, or older systems.
4. SWIFT’s Economic and Political Significance
Handles millions of messages daily, representing trillions of dollars in transactions.
Acts as a gatekeeper of the international financial system.
Has been used as a tool of geopolitical leverage, with nations being excluded (e.g., Iran, Russia).
5. Limitations of SWIFT
Not instant: Settlement still depends on correspondent banking, which can take 2–5 days.
Expensive: Multiple intermediaries add costs (correspondent bank fees, FX spreads).
Opaque: Hard for individuals and small businesses to track payments in real time.
Geopolitical risk: Heavy influence from the U.S. and EU raises questions of neutrality.
Part III: Central Bank Digital Currencies (CBDCs) and the Future of Payments
1. What are CBDCs?
Central Bank Digital Currencies (CBDCs) are digital forms of sovereign money issued directly by central banks. Unlike cryptocurrencies (Bitcoin, Ethereum) or stablecoins (USDT, USDC), CBDCs are:
Legal tender, backed by the state.
Centralized, controlled by the central bank.
Stable in value, tied to fiat currencies.
CBDCs can be classified into:
Retail CBDCs: For use by the general public (e.g., digital yuan wallet).
Wholesale CBDCs: For interbank and institutional settlements.
2. Motivations for CBDC Development
Central banks globally are exploring CBDCs for reasons including:
Faster and cheaper payments (especially cross-border).
Financial inclusion for unbanked populations.
Reduced reliance on private intermediaries (Visa, Mastercard, SWIFT).
Geopolitical sovereignty (reducing dollar dependency).
Improved monetary policy tools (programmable money, negative rates).
3. CBDCs in Cross-Border Payments
CBDCs offer potential solutions to SWIFT’s limitations:
Instant settlement: Peer-to-peer transfers between central banks.
Lower cost: Eliminates correspondent banking layers.
Transparency: Real-time tracking of payments.
Programmability: Smart contracts for automated compliance.
4. Leading CBDC Projects Worldwide
China: Digital Yuan (e-CNY) already in pilot across multiple cities and tested for cross-border use.
Europe: The European Central Bank is developing a Digital Euro.
India: The Reserve Bank of India launched pilot programs for the Digital Rupee in 2022.
USA: The Federal Reserve is researching a Digital Dollar, though progress is slower.
Multi-CBDC Platforms: Projects like mBridge (BIS, China, UAE, Thailand, Hong Kong) aim to build interoperable cross-border CBDC networks.
Part IV: SWIFT vs. CBDCs – Collaboration or Competition?
1. Will CBDCs Replace SWIFT?
Possibility: If central banks interconnect CBDCs directly, the need for SWIFT messages may decline.
Reality: Transition will be slow; SWIFT’s vast network is difficult to replicate overnight.
2. SWIFT’s Response
SWIFT is experimenting with CBDC interoperability solutions, connecting multiple digital currencies through its network.
Focus on ISO 20022 standardization to ensure compatibility with CBDC systems.
Partnerships with central banks to ensure relevance in the digital era.
3. Coexistence Scenario
In the short to medium term, SWIFT and CBDCs may coexist:
SWIFT remains dominant for traditional bank-to-bank messaging.
CBDCs gain traction for specific corridors, especially in Asia and emerging markets.
Part V: Risks, Challenges, and Opportunities
1. Risks of CBDCs
Privacy concerns: Central banks could track every transaction.
Cybersecurity threats: Centralized systems are high-value hacking targets.
Financial disintermediation: Banks may lose deposits if individuals prefer CBDCs.
Geopolitical fragmentation: Competing CBDC blocs (U.S.-led vs China-led) could split the financial system.
2. Risks of SWIFT
Sanctions weaponization undermines neutrality.
Inefficiency relative to new technologies.
Exposure to cyberattacks (e.g., Bangladesh Bank heist in 2016).
3. Opportunities
For SWIFT: Remain the global connector by facilitating CBDC interoperability.
For CBDCs: Create a more inclusive, efficient, and sovereign financial system.
For Businesses and Consumers: Faster remittances, lower costs, better transparency.
Conclusion
International payment systems are undergoing one of the most profound transformations since the Bretton Woods era. SWIFT, the dominant global financial messaging system for decades, remains crucial but faces challenges from new technologies and shifting geopolitics. Meanwhile, CBDCs represent both an opportunity and a threat—promising faster, cheaper, and more sovereign payment infrastructures but also raising risks of fragmentation, surveillance, and competition.
The likely future is not a complete replacement of SWIFT by CBDCs, but rather a hybrid system where SWIFT evolves to act as an interoperability layer while CBDCs gain prominence in specific cross-border corridors.
Ultimately, the future of international payments will depend not only on technological innovation but also on political will, global cooperation, and the balance of power among major economies. The contest between SWIFT and CBDCs is not just about efficiency—it is about who controls the financial arteries of the 21st-century global economy.
Shipping, Freight, and Logistics Trading (Baltic Index)1. Foundations of Global Shipping and Freight
1.1 The Role of Shipping in Global Trade
Shipping is the engine of globalization. Over 80% of international trade by volume is carried by sea. Ships transport crude oil, natural gas, coal, iron ore, grains, fertilizers, automobiles, and countless other goods.
Without shipping, modern trade would collapse. It provides:
Cost efficiency: Shipping is the cheapest way to transport large quantities over long distances.
Accessibility: Oceans cover 70% of the earth, linking producers and consumers across continents.
Flexibility: Different vessel types (tankers, bulk carriers, container ships, LNG carriers) handle specific cargo needs.
1.2 Freight: The Price of Shipping
In simple terms, freight is the cost of transporting cargo from one point to another. Freight rates vary depending on:
Type of cargo (dry bulk, liquid, containerized)
Distance and route (short haul vs. long haul)
Vessel size and availability
Market conditions (supply of ships vs. demand for goods)
Freight costs are crucial because they directly affect commodity prices, corporate profits, and inflation worldwide.
1.3 Logistics and Its Broader Scope
While shipping focuses on transport, logistics covers the entire chain: storage, warehousing, customs clearance, last-mile delivery, and supply chain management. Logistics companies such as Maersk, DHL, FedEx, and MSC coordinate multi-modal transport systems that integrate shipping, trucking, rail, and air.
2. The Baltic Exchange and Baltic Index
2.1 History of the Baltic Exchange
The Baltic Exchange is a London-based institution founded in the mid-18th century. Initially, it provided a marketplace for shipowners and merchants to negotiate contracts. Today, it is the world’s leading source of maritime market information, freight assessments, and shipping benchmarks.
2.2 What is the Baltic Dry Index (BDI)?
The BDI is a composite index that tracks the cost of transporting raw materials by sea, specifically dry bulk commodities such as:
Iron ore
Coal
Grains (wheat, corn, soybeans)
Bauxite, alumina, and other minerals
It is published daily by the Baltic Exchange and reflects the average of freight rates on major shipping routes worldwide.
2.3 How the BDI is Calculated
The index is derived from assessments of freight brokers who provide daily estimates of charter rates for different ship sizes. It combines data from four main dry bulk carrier classes:
Capesize (largest ships, mainly carrying iron ore & coal, 150,000+ DWT)
Panamax (medium size, often for coal & grain, 60,000–80,000 DWT)
Supramax (40,000–60,000 DWT, flexible routes & cargoes)
Handysize (smaller vessels, 10,000–40,000 DWT, short routes, regional trade)
The weighted average of these daily rates produces the BDI value.
2.4 Why is the BDI Important?
Economic Indicator: It is considered a leading indicator of global trade activity. Rising BDI suggests strong demand for raw materials and growth, while falling BDI indicates slowing trade.
Price Benchmark: Used by miners, steelmakers, traders, and shipping companies to negotiate contracts.
Financial Market Tool: Hedge funds, analysts, and investors watch the BDI to forecast commodity cycles and global GDP trends.
3. The Economics of Freight Markets
3.1 Supply Side: The Shipping Fleet
The supply of vessels is relatively inelastic in the short term. It takes 2–3 years to build new ships, so when demand spikes, freight rates can rise sharply. Conversely, during downturns, excess ships push rates lower.
3.2 Demand Side: Global Commodity Trade
Demand for shipping depends on global consumption of raw materials:
China’s steel production drives iron ore imports.
Power plants drive coal shipments.
Food security drives grain exports from the US, Brazil, and Ukraine.
3.3 Freight Rate Cycles
The shipping industry is notoriously cyclical:
Boom: High demand, limited supply → skyrocketing freight rates.
Bust: Overbuilding of ships, economic slowdown → rates collapse.
This volatility makes freight trading attractive but risky.
4. Trading and Investment Using the Baltic Index
4.1 Physical Shipping Contracts
Shipowners lease vessels to charterers (traders, miners, commodity houses) through:
Voyage Charter: Hire for a single trip.
Time Charter: Hire for a specific time period.
Bareboat Charter: Hire vessel without crew/equipment.
Freight rates are negotiated based on BDI benchmarks.
4.2 Freight Derivatives and Forward Freight Agreements (FFAs)
To manage volatility, traders use FFAs, financial contracts that lock in freight rates for future dates.
Example: A steelmaker importing iron ore may buy FFAs to hedge against rising shipping costs.
Speculators also trade FFAs purely for profit, betting on future freight movements.
4.3 ETFs and Shipping Stocks
Investors gain exposure to freight and shipping through:
Shipping company stocks (Maersk, Cosco, Hapag-Lloyd, Frontline)
Exchange-traded funds (ETFs) that track shipping indices
Commodities like iron ore, coal, and grains, which correlate with freight rates
4.4 Role of Banks and Hedge Funds
Financial institutions use the BDI for forecasting, asset allocation, and even as a proxy for inflation and GDP. Hedge funds trade freight derivatives to profit from global trade cycles.
5. Logistics and Supply Chain Dynamics
5.1 Container Shipping vs. Bulk Shipping
Container Shipping: Handles manufactured goods (electronics, clothing, cars). Measured in TEUs (Twenty-foot Equivalent Units). Freight benchmark = Shanghai Containerized Freight Index (SCFI).
Bulk Shipping: Handles raw commodities (ore, coal, grain). Benchmark = BDI.
5.2 Supply Chain Bottlenecks
Events like the COVID-19 pandemic and Suez Canal blockage (2021) highlighted vulnerabilities:
Congested ports delayed shipments.
Container shortages raised freight prices.
Geopolitical tensions (Russia-Ukraine war) disrupted grain and oil transport.
5.3 Role of Technology
Digital platforms, blockchain, and AI are transforming logistics:
Real-time cargo tracking
Smart contracts for freight payments
Automated port operations
6. Case Studies
6.1 The 2008 Shipping Boom and Bust
Pre-2008: China’s rapid industrial growth caused freight rates to skyrocket (BDI hit 11,793 points in May 2008).
Post-2008: Global financial crisis slashed demand; oversupply of ships led to a crash (BDI dropped below 700 points in late 2008).
6.2 COVID-19 Pandemic
Early 2020: Demand collapsed, ships idled, freight rates fell.
Mid-2020 onward: Recovery + container shortages led to record high container freight prices.
6.3 Russia-Ukraine War (2022)
Disrupted Black Sea grain exports.
Increased insurance costs for vessels in conflict zones.
Re-routed trade flows reshaped freight markets.
Conclusion
Shipping, freight, and logistics are the hidden arteries of global trade. The Baltic Dry Index (BDI) stands as a critical barometer of world economic health, linking shipping costs to broader market cycles. Traders, investors, and policymakers watch it closely to gauge demand for raw materials, predict inflation, and assess the global growth outlook.
While the industry faces volatility, geopolitical risks, and environmental pressures, it is also entering a period of transformation driven by decarbonization, digitalization, and new trade patterns.
For anyone interested in global markets—whether a trader, economist, or policy planner—the Baltic Index remains one of the most powerful yet underappreciated indicators of where the world economy is heading.
Inflation & Interest Rate Impact on Global Markets1. Inflation: The Silent Force Driving Markets
1.1 What is Inflation?
Inflation refers to the sustained increase in the general price level of goods and services in an economy over time. It reduces the purchasing power of money and reflects imbalances between demand and supply.
Types of Inflation:
Demand-Pull Inflation: Caused by strong consumer demand exceeding supply.
Cost-Push Inflation: Triggered by higher production costs (e.g., rising wages, raw materials).
Built-In Inflation: Wage-price spirals where higher wages lead to higher prices.
Hyperinflation: Extremely rapid price increases, often due to monetary mismanagement.
1.2 Measurement of Inflation
Central banks and governments use indexes like:
Consumer Price Index (CPI)
Producer Price Index (PPI)
Personal Consumption Expenditure (PCE)
Each index provides a different angle on price changes affecting households, businesses, and producers.
1.3 The Global Relevance of Inflation
Inflation impacts nearly every financial market:
Equities: Erodes corporate profits unless firms pass costs to consumers.
Bonds: Fixed interest payments lose real value when inflation rises.
Currencies: High inflation weakens a nation’s currency.
Commodities: Often act as a hedge (gold, oil, agricultural products).
2. Interest Rates: The Monetary Lever
2.1 What are Interest Rates?
Interest rates represent the cost of borrowing money or the return on lending capital. Central banks set benchmark rates (e.g., the U.S. Federal Reserve’s Federal Funds Rate, ECB’s Main Refinancing Rate) to guide economic activity.
2.2 How Central Banks Use Interest Rates
Lowering Rates: Stimulates growth, encourages borrowing, raises asset prices.
Raising Rates: Controls inflation, curbs excessive lending, can cool overheated economies.
2.3 Real vs. Nominal Interest Rates
Nominal Rate: Stated percentage without inflation adjustment.
Real Rate: Nominal rate minus inflation. Investors care about real returns.
3. The Inflation–Interest Rate Nexus
The relationship between inflation and interest rates is central to market behavior. High inflation often prompts central banks to raise rates, while low inflation or deflation encourages rate cuts.
Phillips Curve Theory: Historically suggested an inverse relationship between inflation and unemployment, though its relevance is debated today.
Taylor Rule: A monetary policy guideline suggesting how central banks should adjust interest rates in response to inflation and output gaps.
This interaction affects everything from stock market valuations to cross-border capital flows.
4. Impact on Global Asset Classes
4.1 Equity Markets
High Inflation + Rising Rates: Compresses valuations, reduces consumer demand, and lowers corporate earnings. Growth stocks, especially in tech, often suffer.
Low Inflation + Low Rates: Favors risk assets, boosts valuations, supports speculative bubbles.
Historical Example: The 1970s stagflation period saw equities underperform due to high inflation and rising rates. In contrast, the 2010s "low-rate decade" fueled massive equity rallies.
4.2 Bond Markets
Rising inflation hurts bondholders since fixed payments lose real value. Yields rise to compensate for inflation, causing bond prices to fall.
Interest rate hikes directly impact yields, particularly on short-term government securities.
4.3 Currency Markets
Higher rates typically attract foreign capital, strengthening the domestic currency.
Inflation erodes currency value unless offset by aggressive monetary tightening.
Case Study: The U.S. dollar often strengthens during Federal Reserve hiking cycles, while emerging market currencies weaken due to capital flight.
4.4 Commodities
Commodities like gold, oil, and agricultural products are often seen as hedges against inflation.
Higher interest rates can reduce commodity demand since financing costs rise, but supply shocks may offset this.
4.5 Real Estate
Inflation raises construction costs, boosting property prices.
High interest rates increase mortgage costs, dampening housing demand.
4.6 Alternative Assets (Crypto, Private Equity, Venture Capital)
Cryptocurrencies gained popularity as “inflation hedges,” though their effectiveness is debated.
Low interest rates fuel venture capital and private equity booms, while higher rates reduce risk appetite.
5. Regional & Global Perspectives
5.1 United States
As the world’s largest economy, U.S. inflation and Fed policy significantly shape global markets. The Fed’s actions affect:
Dollar strength (USD as reserve currency)
Capital flows into emerging markets
Global bond yields and equity valuations
5.2 Eurozone
The European Central Bank balances inflation control with fragile growth. Its historically lower rates have influenced capital allocation globally.
5.3 Emerging Markets
Emerging economies are particularly sensitive to U.S. interest rate hikes:
Capital outflows occur as investors chase higher U.S. yields.
Currencies depreciate, making imports costlier and inflation worse.
Governments face debt repayment pressures on dollar-denominated bonds.
Example: Turkey, Argentina, and other EMs have repeatedly faced crises linked to inflation and external rate shocks.
5.4 Asia (China, India, Japan)
China: Inflation is less of a concern; focus is on growth management.
India: Sensitive to global oil prices and capital flows; RBI uses rate adjustments to maintain balance.
Japan: Longstanding deflationary pressures have led to ultra-low/negative rates. Rising global inflation creates challenges for the yen.
6. Historical Lessons
1970s Stagflation: High inflation and weak growth caused equity crashes and bond turmoil.
1980s Volcker Shock: U.S. Fed raised rates sharply, crushing inflation but triggering global debt crises.
2008 Financial Crisis: Ultra-low rates fueled recovery but sowed seeds for asset bubbles.
2020 Pandemic & Aftermath: Stimulus + supply chain disruptions caused inflation surges, forcing aggressive central bank tightening in 2022–23.
Investment Strategies in Inflation & Interest Rate Cycles
Inflation Hedging: Gold, commodities, inflation-linked bonds (TIPS).
Diversification: Across asset classes and geographies to manage volatility.
Sector Rotation: Moving capital into sectors resilient during high inflation (energy, financials).
Duration Management: Shorter-duration bonds during rising rate cycles.
Currency Hedging: Protecting portfolios from FX risks due to rate differentials.
Conclusion
Inflation and interest rates remain the twin pillars shaping global financial markets. Their interplay drives asset valuations, capital flows, and investor psychology. While moderate inflation and stable interest rates foster growth, extremes in either direction often destabilize economies and markets.
For policymakers, the challenge lies in navigating between controlling inflation and supporting growth. For investors, success depends on adapting strategies to different inflation and interest rate environments.
The coming decades may witness structural shifts—climate change, geopolitical realignments, and technological revolutions—that redefine inflationary pressures and interest rate dynamics. Yet, the central truth remains: understanding inflation and interest rates is essential to navigating the ever-evolving global markets.
ESG Investing & Green FinancePart I: Understanding ESG Investing
1. What is ESG?
ESG stands for Environmental, Social, and Governance. It is a framework used by investors to evaluate companies not just on financial performance, but also on how they manage sustainability, ethics, and accountability.
Environmental (E): Measures a company’s impact on the planet—carbon emissions, energy use, waste management, renewable energy adoption, water conservation, pollution control, etc.
Social (S): Assesses how a company treats people—its employees, customers, suppliers, and communities. Issues like labor rights, workplace diversity, data privacy, and community engagement fall here.
Governance (G): Evaluates how a company is managed—board diversity, executive pay, shareholder rights, transparency, anti-corruption policies, etc.
2. Origins of ESG Investing
The roots of ESG investing can be traced back to:
1960s–1970s: Socially Responsible Investing (SRI) emerged. Religious groups and ethical investors avoided companies linked to alcohol, tobacco, gambling, and weapons.
1980s–1990s: Activist investors started pressuring firms on issues like apartheid in South Africa. Many divested from companies operating there.
2000s: Climate change awareness grew, leading to greater focus on corporate environmental performance.
2015 onwards: The Paris Agreement, UN Sustainable Development Goals (SDGs), and growing public concern about climate change propelled ESG to mainstream finance.
3. ESG Investing vs. Traditional Investing
Aspect Traditional Investing ESG Investing
Focus Profit, ROI, growth Profit + sustainability + ethics
Metrics EPS, P/E ratio, ROE ESG scores + financial metrics
Time Horizon Short-to-medium term Long-term resilience
Risk Market risk, credit risk Market + climate + reputational risks
Part II: Key Drivers of ESG Investing
Climate Change and Sustainability Concerns
Rising global temperatures, extreme weather, and natural disasters highlight the risks of ignoring climate change.
Companies that fail to adapt may face legal, regulatory, and reputational risks.
Investor Demand
Millennials and Gen Z, who are more socially conscious, prefer investing in sustainable companies.
ESG-focused mutual funds and ETFs have seen record inflows.
Regulatory Pressure
Governments are mandating climate disclosures. For example, the EU’s Sustainable Finance Disclosure Regulation (SFDR) requires funds to disclose ESG risks.
Corporate Performance Data
Studies show that ESG-aligned companies often outperform peers in the long run due to lower risks, better brand image, and operational efficiency.
Part III: ESG Metrics and Ratings
1. ESG Rating Agencies
Several organizations provide ESG scores to companies, including:
MSCI ESG Ratings
Sustainalytics
Refinitiv
Bloomberg ESG Scores
Each agency uses different criteria, making ESG ratings inconsistent at times. For example, Tesla scores high on environment due to EV leadership, but lower on governance issues.
2. Key Metrics
Carbon emissions (CO2e per unit revenue)
Percentage of renewable energy use
Diversity of board and management
Employee turnover and satisfaction
Transparency in financial reporting
Part IV: Green Finance
1. What is Green Finance?
Green finance refers to financial activities, investments, and instruments specifically designed to support environmentally sustainable projects. Unlike ESG, which is broad, green finance is narrower and directly focused on environmental impact.
Examples include:
Green Bonds (funds raised for renewable energy, clean transport, or sustainable water projects).
Climate Funds (investments in climate change mitigation/adaptation).
Sustainable Loans (corporate loans linked to sustainability targets).
2. Evolution of Green Finance
2007: The European Investment Bank issued the first green bond.
2015: The Paris Climate Agreement boosted funding for green projects.
Today: Green finance is a $2 trillion+ market, with rapid growth in Asia, Europe, and North America.
3. Green Finance vs. ESG Investing
Aspect Green Finance ESG Investing
Scope Narrow (environmental projects only) Broad (environment, social, governance)
Instruments Green bonds, loans, climate funds ESG funds, ETFs, stocks
Purpose Financing climate-friendly initiatives Screening and investing in sustainable companies
Part V: Examples and Case Studies
1. Tesla Inc. (Environment & Social Impact)
Pros: Market leader in EVs, promotes clean energy, reduces carbon dependency.
Cons: Criticism on governance (CEO dominance, workplace safety, and labor issues).
2. Unilever (ESG Leader)
Pioneered Sustainable Living Brands initiative.
Invested heavily in eco-friendly packaging, supply chain ethics, and community programs.
3. Apple Inc.
Committed to becoming carbon neutral by 2030.
Invests in renewable energy for data centers and supply chain sustainability.
4. Green Bonds by Governments
India: Issued sovereign green bonds to finance solar and wind energy.
China: One of the largest issuers of green bonds globally.
EU: Launched “NextGenerationEU” recovery fund with a strong green finance focus.
Part VI: Benefits of ESG & Green Finance
Risk Mitigation – Companies with strong ESG practices face fewer legal and reputational risks.
Long-Term Value Creation – Sustainable companies build resilience against climate and market shocks.
Better Investor Returns – ESG funds often outperform benchmarks over long horizons.
Positive Brand Image – Firms adopting ESG gain consumer trust and loyalty.
Access to Capital – Green finance instruments often come with lower borrowing costs.
Conclusion
ESG investing and green finance are not just trends—they are reshaping global financial markets. By embedding environmental, social, and governance considerations into investment decisions, stakeholders can drive capital towards sustainable and ethical businesses.
While challenges like greenwashing and lack of standardization remain, the direction is clear: the future of finance will be green, responsible, and impact-driven.
Investors, policymakers, and companies who embrace this shift early are likely to reap long-term benefits—not just in profits, but in contributing to a more sustainable planet.

GOLD ROUTE MAP UPDATEHey Everyone,
Another PIPTASTIC day on the charts for us with our 1H chart playing out as analysed with our final target completed today.
After completing 3593, 3613 and then 3638, we stated that we would now look for ema5 cross and lock above 3638 to open 3658. We got the lock and confirmation followed with the target hit - PERFECTION!!
We are now seeing rejection on this level and will use the lower Goldturns for support and bounce. If the range above opens further please review our daily chart and weekly chart updates with higher range levels to continue to track the movement until we update a new 1h chart.
We will continue to buy dips using our support levels taking 20 to 40 pips. As stated before each of our level structures give 20 to 40 pip bounces, which is enough for a nice entry and exit. If you back test the levels we shared every week for the past 24 months, you can see how effectively they were used to trade with or against short/mid term swings and trends.
The swing range give bigger bounces then our weighted levels that's the difference between weighted levels and swing ranges.
BULLISH TARGET
3593 - DONE
EMA5 CROSS AND LOCK ABOVE 3593 WILL OPEN THE FOLLOWING BULLISH TARGETS
3613 - DONE
EMA5 CROSS AND LOCK ABOVE 3613 WILL OPEN THE FOLLOWING BULLISH TARGET
3638 - DONE
EMA5 CROSS AND LOCK ABOVE 3638 WILL OPEN THE FOLLOWING BULLISH TARGET
3658 - DONE
BEARISH TARGETS
3562
EMA5 CROSS AND LOCK BELOW 3562 WILL OPEN THE FOLLOWING BEARISH TARGET
3528
EMA5 CROSS AND LOCK BELOW 3528 WILL OPEN THE SWING RANGE
3492
3470
EMA5 CROSS AND LOCK BELOW 3470 WILL OPEN THE SECONDARY SWING RANGE
3438
3408
As always, we will keep you all updated with regular updates throughout the week and how we manage the active ideas and setups. Thank you all for your likes, comments and follows, we really appreciate it!
Mr Gold
GoldViewFX

WTO, IMF, and World Bank in Global Trading1. Historical Background of Global Trade Institutions
1.1 The Bretton Woods Conference (1944)
In the aftermath of World War II, world leaders recognized the need for a stable international economic order.
The Bretton Woods Conference, held in New Hampshire, USA, in 1944, gave birth to two major institutions: the IMF and the World Bank.
Their purpose was to rebuild war-torn economies, stabilize currencies, and finance reconstruction.
1.2 The General Agreement on Tariffs and Trade (GATT) and WTO
In 1947, the General Agreement on Tariffs and Trade (GATT) was established to reduce tariffs and encourage trade liberalization.
GATT evolved over decades and was eventually replaced by the World Trade Organization (WTO) in 1995, which took on broader responsibilities in managing international trade rules.
Thus, the global economic framework today rests on three pillars: WTO (trade rules), IMF (financial stability), and World Bank (development financing).
2. World Trade Organization (WTO)
2.1 What is the WTO?
The WTO is the only global organization dealing with the rules of trade between nations. With over 160 member countries, it regulates trade agreements, monitors compliance, and settles disputes.
2.2 Core Objectives
Trade Liberalization – Reduce tariffs, quotas, and other barriers.
Predictability – Ensure stable trade policies through binding commitments.
Non-Discrimination – “Most-Favored Nation” (MFN) treatment, ensuring countries don’t discriminate among trade partners.
Fair Competition – Prevent unfair practices like dumping or subsidies.
Development – Provide special provisions for developing and least-developed countries.
2.3 WTO Functions in Global Trade
Negotiation Forum: Members negotiate trade deals (e.g., Doha Round).
Implementation and Monitoring: Ensures countries comply with trade agreements.
Dispute Settlement: Provides a legal framework to resolve trade conflicts.
Capacity Building: Assists developing nations with trade knowledge.
2.4 Impact of WTO on Global Trade
Dramatic reduction in average tariffs (from >30% in 1947 to <5% today).
Expansion of world trade, allowing developing countries like China, India, and Brazil to emerge as major players.
Legal dispute resolution prevents trade wars and supports stability.
2.5 Criticisms of WTO
Seen as favoring developed nations with stronger bargaining power.
Negotiation rounds often stall due to conflicting interests.
Critics argue WTO undermines national sovereignty by enforcing global rules.
3. International Monetary Fund (IMF)
3.1 What is the IMF?
The IMF is a global financial institution headquartered in Washington, D.C., with 190+ member countries. It ensures the stability of the international monetary system—exchange rates, payments, and cross-border capital flows.
3.2 Objectives of IMF
Exchange Rate Stability – Prevent currency crises and competitive devaluations.
Balance of Payments Assistance – Provide short-term loans to countries in crisis.
Policy Surveillance – Monitor global economic trends and provide policy advice.
Capacity Development – Offer training to strengthen economic institutions.
3.3 Functions in Global Trade
Financing Trade Deficits: Countries with shortages of foreign currency can borrow from IMF to finance imports.
Crisis Management: Provides emergency support during global shocks (e.g., Asian Financial Crisis 1997, Eurozone crisis, COVID-19 pandemic).
Exchange Rate Stability: Prevents destabilizing fluctuations that could disrupt trade.
Confidence Building: By backing countries with funds, IMF assures trading partners of stability.
3.4 IMF Tools
Lending Programs: Stand-By Arrangements, Extended Fund Facility, and Rapid Financing Instrument.
Special Drawing Rights (SDRs): International reserve asset to boost global liquidity.
Surveillance Reports: The World Economic Outlook and Global Financial Stability Report.
3.5 Impact of IMF on Global Trade
Prevents collapse of trade flows by ensuring liquidity.
Encourages trade-oriented reforms in developing countries.
Enhances investor confidence by stabilizing economies.
3.6 Criticisms of IMF
Conditionality: Loans often come with austerity measures, criticized for worsening poverty.
Western Dominance: Voting rights favor developed nations, especially the U.S. and Europe.
One-Size-Fits-All Policies: Structural adjustment programs have been criticized for imposing uniform economic models.
4. World Bank
4.1 What is the World Bank?
The World Bank Group (WBG) is a collection of five institutions, the most prominent being the International Bank for Reconstruction and Development (IBRD) and the International Development Association (IDA). Its primary mission is poverty reduction and long-term development.
4.2 Objectives
Reconstruction & Development – Initially focused on post-war rebuilding, now on infrastructure and growth.
Poverty Reduction – Promote inclusive and sustainable development.
Financing Trade Infrastructure – Ports, roads, digital connectivity, and energy supply that enable trade.
Knowledge Sharing – Research and technical expertise.
4.3 Functions in Global Trade
Financing Development Projects: Infrastructure, education, health, energy.
Trade Facilitation: Improves logistics, reduces transaction costs.
Capacity Building: Helps developing nations integrate into global trade.
Risk Mitigation: Provides guarantees to encourage private investment.
4.4 Impact of World Bank on Trade
Building infrastructure that directly supports trade flows (e.g., transport corridors, ports).
Reducing bottlenecks and making exports competitive.
Encouraging private investment and entrepreneurship in developing markets.
4.5 Criticisms of World Bank
Projects sometimes cause displacement or environmental harm.
Critics argue the Bank pushes neoliberal reforms (privatization, deregulation).
Dependence on debt financing can burden poor countries.
5. Interrelationship Between WTO, IMF, and World Bank
These three institutions are often referred to as the “Bretton Woods Twins + WTO” or the pillars of global economic governance.
WTO → Creates the rules of trade.
IMF → Provides monetary stability for trade.
World Bank → Finances development to enable trade participation.
5.1 Coordination
WTO, IMF, and World Bank hold joint meetings to harmonize policies.
During crises (e.g., 2008 financial crash, COVID-19), they collaborated on stimulus and debt relief.
5.2 Complementary Roles
IMF stabilizes economies so they can continue trade.
World Bank builds the infrastructure that enables countries to trade.
WTO provides the legal framework that governs trade relations.
6. Case Studies
6.1 Asian Financial Crisis (1997)
IMF provided emergency loans to South Korea, Thailand, and Indonesia.
WTO prevented protectionist measures that could have worsened the crisis.
World Bank financed structural reforms in affected economies.
6.2 Global Financial Crisis (2008)
IMF expanded lending and increased SDR allocations.
World Bank financed countercyclical projects in developing countries.
WTO helped prevent a rise in tariffs and trade wars.
6.3 COVID-19 Pandemic (2020–2021)
IMF mobilized trillions in emergency support.
World Bank financed health programs, vaccine distribution, and digital infrastructure.
WTO monitored export restrictions on medical supplies and promoted trade facilitation.
7. Criticism of Global Economic Governance
Despite their contributions, these institutions face criticism:
Power Imbalance: Rich nations have more influence.
Conditionality and Sovereignty: Loans often reduce national autonomy.
Unequal Benefits: Global trade benefits are not equally distributed.
Environmental Concerns: Development projects sometimes harm ecosystems.
8. The Future of WTO, IMF, and World Bank in Global Trade
8.1 Challenges Ahead
Rise of protectionism and trade wars (e.g., U.S.–China tensions).
Global inequality and debt crises in developing countries.
Climate change and sustainable development needs.
Digital trade and financial technology disrupting traditional models.
8.2 Possible Reforms
WTO: Reform dispute settlement system and include digital trade rules.
IMF: Greater representation for emerging economies, flexible conditionality.
World Bank: Stronger focus on climate resilience and sustainable infrastructure.
8.3 Long-Term Role
Together, these institutions will remain crucial in shaping the global trade system—balancing stability, growth, and inclusivity.
Conclusion
Global trade is the lifeblood of the interconnected world economy, but it requires strong institutions to ensure fairness, stability, and sustainability. The WTO provides the rules, the IMF ensures monetary stability, and the World Bank finances development that enables participation in trade.
Though criticized for inequities and structural biases, these institutions have prevented major global trade breakdowns, facilitated economic growth, and enabled developing nations to integrate into the global economy.
In the future, reforms are needed to make them more inclusive, transparent, and responsive to new challenges such as digital trade, climate change, and inequality. Yet, their centrality in global trading remains undisputed—without them, the world economy would be far more unstable, fragmented, and vulnerable to crisis.
Global Corporate Bond Trading1. What Are Corporate Bonds?
A corporate bond is a debt security issued by a corporation to raise money for various purposes such as expansion, acquisitions, refinancing, or working capital.
Issuer: The company borrowing money.
Investor: The buyer of the bond, lending money in exchange for fixed interest payments (coupons).
Maturity: The date when the company repays the bondholder’s principal.
Coupon: The fixed or floating interest paid to the bondholder.
Unlike equities (shares), bonds do not give ownership in the company. They represent a loan, with priority repayment rights if the company faces bankruptcy.
2. Evolution of the Corporate Bond Market
Early History
The first corporate bonds date back to the 19th century, with U.S. railroads raising funds through bonds.
By the 20th century, corporate bonds became a primary source of long-term financing for industrial and service companies.
Global Expansion
After World War II, the U.S. and European companies used corporate bonds heavily to rebuild industries.
In the late 20th century, Japan and emerging markets entered the global bond market.
21st Century Trends
Today, the corporate bond market is highly international. Companies issue bonds in multiple currencies to attract global investors.
Globalization, electronic trading, and credit derivatives (like credit default swaps, CDS) have transformed bond trading into a dynamic, interconnected market.
3. Types of Corporate Bonds
Corporate bonds vary widely. Some key categories are:
Investment-Grade Bonds
Issued by financially strong companies.
Rated BBB-/Baa3 or higher by credit rating agencies.
Lower risk, lower yield.
High-Yield (Junk) Bonds
Issued by riskier companies with lower credit ratings.
Higher yields to compensate investors.
Popular in leveraged buyouts, private equity financing.
Convertible Bonds
Can be converted into equity shares at a set price.
Offer lower coupons due to the equity upside potential.
Callable & Putable Bonds
Callable: Issuer can redeem before maturity.
Putable: Investor can demand early repayment.
Floating-Rate Notes (FRNs)
Coupons linked to benchmarks (LIBOR, SOFR, Euribor).
Protects investors from interest rate risk.
Green, Social, and Sustainability Bonds
Proceeds used for environmentally or socially responsible projects.
Gaining popularity with ESG (Environmental, Social, Governance) investors.
4. The Global Corporate Bond Market Structure
The global corporate bond market is over-the-counter (OTC), meaning most trades are negotiated privately rather than on exchanges.
Primary Market: Where companies issue new bonds (IPOs for debt).
Secondary Market: Where investors buy and sell existing bonds.
Key Centers
U.S.: Largest corporate bond market (over $12 trillion outstanding).
Europe: Active Eurobond market, allowing international issuances in multiple currencies.
Asia: Rapidly growing (China, Japan, India).
Emerging Markets: Corporates from Latin America, Africa, Middle East raising funds globally.
5. Key Participants in Global Corporate Bond Trading
Issuers: Corporations from all industries.
Investors:
Pension funds, insurance companies, sovereign wealth funds.
Banks, hedge funds, mutual funds, retail investors.
Intermediaries:
Investment banks (underwriters, dealers).
Bond traders and brokers.
Regulators:
SEC (U.S.), ESMA (EU), FCA (UK), SEBI (India).
They enforce transparency, fair trading, and investor protection.
Rating Agencies:
Moody’s, S&P, Fitch provide credit ratings.
Crucial in determining yields and investor appetite.
6. Trading Mechanisms
a. Primary Issuance Process
Company hires investment banks as underwriters.
Prospectus prepared and credit rating obtained.
Bonds are priced and distributed to institutional investors.
Listing may occur in global bond markets (Luxembourg, London, Singapore).
b. Secondary Market Trading
Mostly OTC via dealers.
Electronic platforms (MarketAxess, Tradeweb, Bloomberg) growing.
Price discovery less transparent than stocks, but improving with regulation.
c. Settlement
Clearing systems like Euroclear, Clearstream, DTC handle settlements.
Typically T+2 (two business days).
7. Pricing & Valuation
Bond prices depend on:
Interest Rates: Rising rates lower bond prices, and vice versa.
Credit Spreads: Extra yield over government bonds reflecting risk.
Liquidity: Easily tradable bonds fetch higher prices.
Currency Risk: Bonds issued in foreign currencies carry FX exposure.
Market Sentiment: Risk-on vs risk-off cycles influence spreads.
8. Risks in Global Corporate Bond Trading
Credit Risk: Issuer may default.
Interest Rate Risk: Bond values fall when rates rise.
Liquidity Risk: Some bonds hard to trade in secondary markets.
Currency Risk: For bonds issued in foreign currencies.
Event Risk: M&A, lawsuits, regulatory changes affecting issuers.
Systemic Risk: Global crises (e.g., 2008, 2020 COVID) trigger sell-offs.
9. Opportunities and Benefits
Diversification: Corporate bonds add balance to portfolios alongside equities.
Stable Income: Predictable coupon payments.
Capital Preservation: Safer than stocks (especially investment-grade).
Global Access: Investors can gain exposure to different economies and industries.
ESG Investing: Growth of green and sustainable bonds.
10. Global Corporate Bond Market Statistics (as of mid-2020s)
Global corporate bond market exceeds $40 trillion outstanding.
U.S. corporate bonds: ~60% of the global market.
Europe: ~25%, with the Eurobond market dominating.
Asia-Pacific: Fastest-growing, led by China’s state-owned enterprises.
Emerging markets: Increasingly active, especially in USD-denominated bonds.
Conclusion
Global corporate bond trading is the lifeblood of modern capital markets. It connects companies seeking financing with investors searching for income and diversification. The market has evolved from railroad bonds in the 19th century to trillion-dollar electronic platforms today.
For issuers, corporate bonds are a flexible, efficient way to raise capital globally. For investors, they offer income, relative safety, and exposure to global economies. However, the market carries risks—from credit defaults to interest rate shocks—that require careful management.
As technology, regulation, and ESG trends reshape the landscape, global corporate bond trading will continue to play a central role in global finance—bridging corporations and capital on an ever-expanding scale.
Global Government Bond Trading1. Fundamentals of Government Bonds
1.1 What Are Government Bonds?
A government bond is a debt security issued by a country’s treasury or finance ministry to raise money. When an investor buys a government bond, they are lending money to the government in exchange for periodic coupon payments (interest) and repayment of the principal at maturity.
Coupon Bonds: Pay regular interest plus principal at maturity.
Zero-Coupon Bonds: Sold at a discount, repay face value at maturity.
Inflation-Linked Bonds: Adjust coupon/principal with inflation rates.
Savings Bonds / Retail Bonds: Targeted at individual investors.
1.2 Key Features of Government Bonds
Issuer: Sovereign state.
Maturity: Short-term (T-bills), medium-term (notes), long-term (bonds).
Yield: Return investors expect, inversely related to bond price.
Credit Risk: Higher in emerging economies; lower in developed ones.
Liquidity: Developed market bonds (like U.S. Treasuries) are highly liquid, emerging markets less so.
1.3 Importance in Global Finance
Provide a risk-free benchmark rate (e.g., U.S. Treasury yields influence global lending rates).
Used as collateral in repo markets.
Serve as safe-haven assets during crises.
Act as tools for monetary policy (quantitative easing, open market operations).
2. Structure of the Global Government Bond Market
2.1 Primary Market
This is where governments issue new bonds via auctions or syndications. Investors bid for these securities, and the government raises capital.
Auction System: Used by the U.S., UK, Japan. Competitive and non-competitive bidding.
Syndicated Issuance: Banks underwrite and distribute bonds, common in Europe.
2.2 Secondary Market
Bonds are traded between investors after issuance. This provides liquidity and continuous price discovery.
Over-the-Counter (OTC): Majority of global bond trading occurs OTC via dealers.
Electronic Trading Platforms: Growing importance (e.g., Tradeweb, MarketAxess).
2.3 Major Bond Markets
U.S. Treasuries: World’s largest, deepest, and most liquid government bond market.
Eurozone Bonds: German Bunds are benchmark safe assets, Italian and Spanish bonds carry higher yields.
Japanese Government Bonds (JGBs): Very large market but often low yields.
UK Gilts: Highly liquid, influenced by Bank of England policy.
Emerging Market Bonds: Offer higher yields but with currency and default risks (Brazil, India, South Africa).
3. Key Participants in Global Government Bond Trading
3.1 Central Banks
Major holders and buyers of government debt.
Conduct monetary policy through bond purchases (QE) or sales.
Hold government bonds as foreign reserves.
3.2 Institutional Investors
Pension funds, insurance companies, and mutual funds allocate heavily to sovereign debt for predictable returns.
3.3 Hedge Funds & Proprietary Traders
Trade bonds to profit from interest rate changes, arbitrage opportunities, or global macro strategies.
3.4 Foreign Governments & Sovereign Wealth Funds
Invest in foreign government bonds for diversification and reserve management.
3.5 Retail Investors
Participate via government savings bonds, ETFs, and mutual funds.
4. Trading Mechanisms
4.1 Cash Market Trading
Direct purchase/sale of government bonds in the secondary market.
Prices fluctuate with interest rates, inflation expectations, and credit risk.
4.2 Derivatives Market
Futures, options, and swaps based on government bonds or yields.
Example: U.S. Treasury futures (CME), Bund futures (Eurex).
4.3 Repo Market
Repurchase agreements use government bonds as collateral.
Essential for liquidity in the global financial system.
4.4 Electronic Platforms & Algorithmic Trading
Rapid growth in e-trading platforms.
Algorithmic and high-frequency trading now account for a significant share.
5. Factors Affecting Government Bond Prices and Yields
5.1 Interest Rates
Bond prices move inversely with interest rates. Central bank policy shifts directly impact yields.
5.2 Inflation
High inflation reduces real returns, pushing yields higher. Inflation-indexed bonds mitigate this risk.
5.3 Economic Growth
Stronger growth can lead to higher yields due to expectations of rate hikes.
5.4 Fiscal Deficits & Debt Levels
Higher government borrowing can push yields upward due to increased supply and perceived risk.
5.5 Currency Movements
Foreign investors consider exchange rate risks; weaker local currency may deter bond purchases.
5.6 Geopolitical Risk
Wars, sanctions, and political instability drive safe-haven flows into bonds of stable nations.
6. Global Government Bond Trading Strategies
6.1 Buy and Hold
Conservative investors, like pension funds, hold bonds to maturity for stable income.
6.2 Yield Curve Strategies
Steepener: Betting long-term rates rise faster than short-term.
Flattener: Opposite bet.
Butterfly Trades: Exploiting mid-term vs short/long-term curve differences.
6.3 Relative Value / Arbitrage
Traders exploit mispricing between different government bonds.
Example: Spread between U.S. Treasuries and German Bunds.
6.4 Global Macro Plays
Hedge funds trade bonds based on global interest rate cycles, inflation, and geopolitical events.
6.5 Carry Trade in Bonds
Borrowing in low-yield currencies and investing in higher-yield government bonds elsewhere.
7. Risks in Government Bond Trading
7.1 Interest Rate Risk
Sharp changes in central bank policy can cause bond price volatility.
7.2 Inflation Risk
Unexpected inflation erodes real returns.
7.3 Credit Risk
Even sovereigns can default (examples: Argentina, Greece).
7.4 Liquidity Risk
Smaller bond markets may not provide adequate trading liquidity.
7.5 Currency Risk
Foreign bond investors face exchange rate fluctuations.
7.6 Geopolitical Risk
Trade wars, sanctions, and political instability can disrupt markets.
8. Role of Government Bond Markets in Global Economy
Benchmark Rates: Government bond yields influence corporate borrowing costs.
Safe-Haven Assets: During crises, investors flock to bonds like U.S. Treasuries.
Monetary Transmission: Central bank policies work through bond markets.
Fiscal Policy Financing: Governments rely on bonds for infrastructure and welfare spending.
Global Capital Flows: Sovereign bonds drive cross-border capital allocation.
9. Case Studies in Global Bond Markets
9.1 U.S. Treasury Market
Largest and most liquid in the world (~$25 trillion outstanding).
Yields serve as a global reference for risk pricing.
Highly responsive to Federal Reserve policies.
9.2 European Sovereign Debt Crisis (2010–2012)
Greek, Portuguese, Spanish, and Italian bonds saw yield spikes.
Investors demanded higher compensation for perceived default risk.
ECB intervention (OMT, QE) stabilized the markets.
9.3 Japanese Government Bonds (JGBs)
Extremely low or negative yields for decades due to deflationary pressures.
Bank of Japan’s Yield Curve Control (YCC) dominates the market.
9.4 Emerging Market Bonds
Offer higher yields but riskier (Argentina default, Turkey’s currency crisis).
Depend heavily on foreign investor confidence.
10. Future of Global Government Bond Trading
10.1 Digital Transformation
Rise of electronic trading platforms.
Algorithmic and AI-based trading strategies.
10.2 Green & ESG-Linked Sovereign Bonds
Growing issuance of “green bonds” by governments to fund climate projects.
10.3 Impact of Global Debt Levels
Post-pandemic debt burdens remain high.
Long-term sustainability of government borrowing under scrutiny.
10.4 Geopolitical Realignment
U.S.–China rivalry may reshape global bond investment patterns.
“De-dollarization” efforts could impact U.S. Treasury dominance.
10.5 Central Bank Balance Sheets
Unwinding QE will affect bond market liquidity.
“Higher for longer” interest rate regimes may redefine yield structures.
Conclusion
Global government bond trading is the foundation of modern financial markets. It balances risk and safety, yield and liquidity, domestic policy and international capital flows. From U.S. Treasuries as the world’s risk-free benchmark to the volatile sovereign bonds of emerging markets, this market reflects the health of economies, the credibility of fiscal policy, and the confidence of investors.
In times of crisis, investors flock to safe government bonds. In times of growth, they may chase higher yields elsewhere. But regardless of market cycles, government bond trading remains central to how money moves across borders, how interest rates are set, and how nations finance themselves.
As the world transitions into an era of high debt, climate financing, digital trading, and shifting geopolitics, global government bond markets will only grow in importance. Understanding their mechanics is crucial for traders, investors, policymakers, and anyone seeking to grasp the pulse of global finance.
