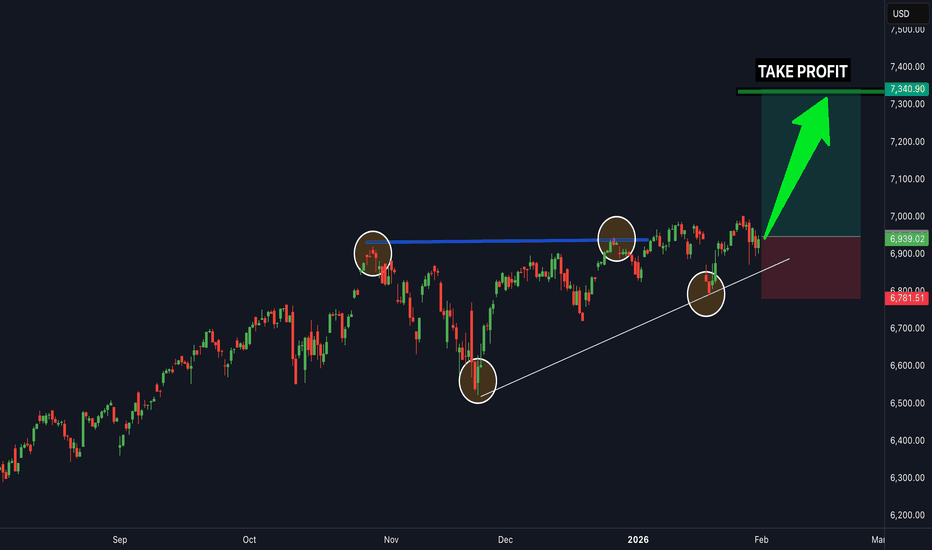
NASDAQ Pre-Market Range Sweep — How It WorksThe indicator defines the range formed before the active US session begins.
The main idea behind the strategy is very simple: once the US session comes in, price often sweeps the nearest liquidity and then returns back into the range that was formed before the active session started.
That return may be back toward the session open, toward the middle of the range, or after a sweep of the previous range boundary.
And this is where our eyes still give us an advantage.
The indicator follows st
Tradingindicators
IndusInd BankKey Support Levels
₹1,005–1,000 – Immediate support
₹985–990 – Strong swing support
₹960–970 – Major positional support
Key Resistance Levels
₹1,025–1,030 – Immediate resistance
₹1,038–1,045 – 52-week high zone
₹1,070–1,100 – Next positional target if breakout sustains
Technical View
✅ Price is above the 20, 50, 100 and 200-day moving averages, indicating a bullish medium-term trend.
✅ RSI is in the bullish zone (around 65–72), showing strong momentum, though the stock may become overbought if i
Hero MotoCorp📈 Resistance Levels
R1: ₹4,950
R2: ₹5,050 (Breakout Level)
R3: ₹5,150
R4: ₹5,250–5,300 (Major Resistance)
📉 Support Levels
S1: ₹4,850
S2: ₹4,780 (Key Support)
S3: ₹4,650
S4: ₹4,500 (Major Demand Zone)
🔑 Key Technical Levels
Bullish Above: ₹5,050
Bearish Below: ₹4,780
Immediate Trend: Sideways to Mildly Bullish
Momentum Confirmation: Above ₹5,050 with strong volume
Trend Reversal: Below ₹4,780
🎯 Swing Trading Plan
Buy Setup
Entry: Above ₹5,050
Targets: ₹5,150 → ₹5,250 → ₹5,400
Stop Loss: ₹4,950
B
Grasim IndustriesSupport Zones
₹3,180–3,200 – Immediate support
₹3,140–3,160 – Strong buying zone
₹3,080–3,100 – Major positional support
Resistance Zones
₹3,225–3,245 – Immediate resistance
₹3,280–3,320 – Breakout zone
₹3,400–3,500 – Positional target if momentum continues
Trading View
Bullish above ₹3,245 → Targets: ₹3,320 → ₹3,400 → ₹3,500
Range-bound between ₹3,180–₹3,245.
Below ₹3,180 → Weakness may extend towards ₹3,140 and ₹3,100.
Indicators
Overall trend: Bullish
Moving Averages: Strong Buy
RSI: Aroun
Sun PharmaCurrent Trend: 🟢 Bullish
🟢 Resistance Levels
R1: ₹1,935–1,945
R2: ₹1,965–1,980
R3: ₹2,000–2,020
🔴 Support Levels
S1: ₹1,900–1,910
S2: ₹1,865–1,875
S3: ₹1,825–1,835
🎯 Trading View
Bullish Scenario
Sustaining above ₹1,935–1,945 can trigger a fresh breakout.
Upside targets:
₹1,965
₹1,980
₹2,020
Bearish Scenario
A break below ₹1,900 may lead to a pullback toward:
₹1,875
₹1,835
A weekly close below ₹1,825 would weaken the current bullish structure.
📊 Technical Summary
✅ Price is trading above major
Tech MahindraImmediate Support
₹1,393 – First support
₹1,379 – Strong support
₹1,366 – Major demand zone (break below can accelerate selling)
Immediate Resistance
₹1,419 – First resistance
₹1,431 – Strong resistance
₹1,445 – Major breakout level
Trading Plan
Bullish Scenario
Buy only if price sustains above ₹1,445 with strong volume.
Upside targets:
₹1,480
₹1,525
₹1,580 (swing target)
Bearish Scenario
If price breaks ₹1,393, downside targets become:
₹1,379
₹1,366
₹1,330 if selling intensifies.
Technic
HCL TechnologiesCurrent Trend
Last traded price: Around ₹1,150.
The short-term technical outlook is bullish, with most moving averages and momentum indicators signaling Buy or Strong Buy.
Key Support Levels
Support 1: ₹1,145–1,150
Support 2: ₹1,130–1,135
Major Support: ₹1,100–1,110
A close below ₹1,100 would weaken the current bullish structure.
Key Resistance Levels
Resistance 1: ₹1,170
Resistance 2: ₹1,200
Major Resistance: ₹1,240–1,260
A decisive breakout above ₹1,200 with strong volume could open the pat
Tata SteelKey Technical Levels
Level Price (₹) Importance
Immediate Support 188 First buying zone
Strong Support 185–186 Breakdown below this may turn bearish
Major Support 180 Positional support
Immediate Resistance 191–192 First hurdle
Strong Resistance 194–196 Breakout zone
Major Resistance 200 Psychological resistance
Trading View
Bullish above ₹192: The stock could move towards ₹196, followed by ₹200 if buying momentum increases.
Bearish below ₹186: A fall towards ₹180–178 becomes more likely if supp
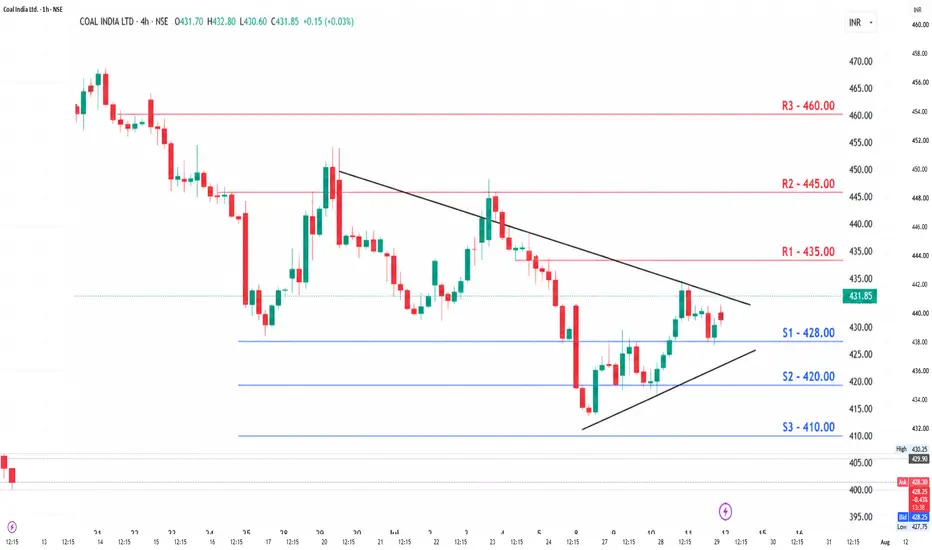
Coal IndiaTrend
Short-term: Neutral to Bearish (trading below 50-DMA)
Medium-term: Sideways
Long-term: Positive as long as ₹420 holds.
Key Support Levels
S1: ₹425–428
S2: ₹418–420 (Strong Demand Zone)
S3: ₹410–412
Key Resistance Levels
R1: ₹435–438
R2: ₹445–448
R3: ₹460–465 (Major Breakout Zone)
Trading Plan
Bullish Setup
Buy above ₹438 on strong volume.
Targets: ₹448 → ₹460 → ₹475
Stop Loss: ₹428
Bearish Setup
If price closes below ₹420
Targets: ₹412 → ₹405
Stop Loss: ₹428
Swing Trading View
Above ₹4
Indian Railway Finance CorporationTrend
Bias: Bearish to Neutral
The stock is trading below its key short- and medium-term moving averages, indicating that sellers still have the upper hand. Momentum indicators such as RSI are near the oversold zone, suggesting a relief bounce is possible, but the primary trend remains weak until key resistance levels are reclaimed.
Key Support Levels
S1: ₹88–90
S2: ₹84–86
Major Support: ₹80–82
A close below ₹88 could trigger further downside towards ₹84–86.
Key Resistance Levels
R1: ₹95–98
R2
DLF Technical Analysis🟢 Key Support Zones
S1: ₹642–645
S2: ₹634–636 (strong demand zone)
Major Support: ₹620–625
🔴 Key Resistance Zones
R1: ₹665–670
R2: ₹680–690
Major Resistance: ₹700+
Trading Plan
✅ Bullish Scenario
Hold above ₹645
Breakout above ₹670
Upside targets:
🎯 ₹680
🎯 ₹690
🎯 ₹705
⚠️ Bearish Scenario
Breakdown below ₹634
Downside targets:
🎯 ₹625
🎯 ₹615
🎯 ₹600
Momentum View
Trend: Bullish to Neutral
Bias: Buy on dips near support rather than chasing at resistance.
Risk Management: A close below ₹634 would wea
Maruti Suzuki IndiaCurrent Technical Outlook
Trend: Neutral to Bullish (medium term), but the stock has seen a sharp recent correction.
Recent Close: Around ₹13,950 after a ~4% fall.
Important Support Levels
S1: ₹13,720
S2: ₹13,490
S3: ₹13,100
Important Resistance Levels
R1: ₹14,340
R2: ₹14,730
R3: ₹14,960
Indicator Analysis
RSI: ~54 – Neutral, not oversold or overbought.
20 & 50 DMA: Price is still above these averages, indicating medium-term strength.
200 DMA: Around ₹13,976, making this an important level to wa
THE KOG REPORT THE KOG REPORT:
In last week’s KOG Report we said we will stick with the NFP chart as the move in our opinion was still not complete. For that reason, we suggested that low if tapped into again should give us the 4720-35 region again, which it did. During the week and through the ranging period, we updated traders with the hot spots and the range, suggesting tap and bounces were available but scalping was only possible on the markets due to the pending breakout. We did hit the lower hot spot
THE KOG REPORT THE KOG REPORT:
In last week’s KOG Report we gave the potential range we expected price to play in together with the hot spots and path. We managed to open well, price attacking our hot spot and giving a bounce presenting buyers with an opportunity to capture a phenomenal trade upside into the immediate hot spot above. We then retested, failed the breach, and again we got that long trade into the defence box above which is where price near enough played for the remainder of the week.
We had
SELL NZDUSD NOWNZDUSD has broken through major support zones. It was in a uptrend however the price broke through major support levels which held the price up for weeks. Secondly, the current situation in the Middle East has strengthened the USD which will weaken the NZDUSD pair as the war continues. Sell NZDUSD now!
Time to buy BITCOIN nowBITCOIN (BTC/USD) has recently dropped in price but struggled to break through a major support level (the yellow trend line aka the downward trend channel) which is currently holding the price. A few weeks ago the price also broke a strong resistance level (the white trend line shown on the chart) - The price is currently bouncing off the major support zone and likely to go back to the upside and hit the take profit level (drawn on the chart). Time To Buy BITCOIN now!
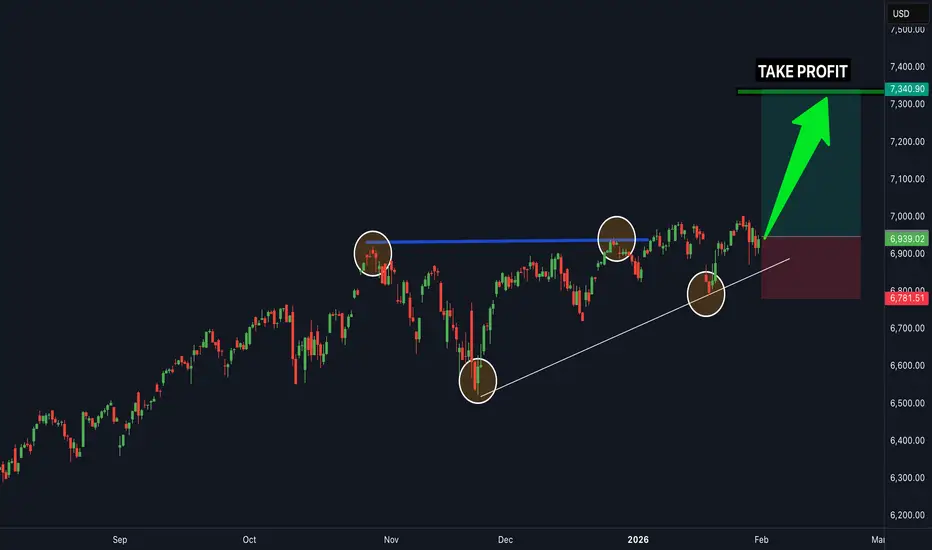
TIME TO SELL SPX500 NOWSPX 500 was in an upwards trend but has recently broken the powerful support zone that held the price up for a while. The price was stuck in-between powerful support and resistance zones but just broke the support zone trend line, which means it is very likely to head to the downside (plus the war in the Middle East will continue to weaken the spx 500) - TIME TO SELL
Time to BUY USDJPY NOWUSDJPY has been in a clear uptrend for the last few weeks but recently dropped a slight bit in the last 24 hours down to a powerful support level! It is currently held by strong support levels which means it is extremely likely to keep heading to the upside for much longer. The next target will be the fibonacci extension zone which is shown on the chart. USDJPY has struggled to break below support but has constantly been breaking through resistance levels. BUY USDJPY NOW.
SELL GBPUSD NOWGBPUSD has broken through major support zones. It was in a uptrend however the price broke through major support levels which held the price up for weeks. Secondly, the current situation in the Middle East has strengthened the USD which will weaken the GBPUSD pair as the war continues. TIME TO Sell GBPUSD now!
Time to BUY BITCOIN NOWBITCOIN (BTC/USD) has recently dropped in price but struggled to break through a major support level (the yellow trend line aka the downward trend channel) which is currently holding the price. A few weeks ago the price also broke a strong resistance level (the white trend line shown on the chart) - The price is currently bouncing off the major support zone and likely to go back to the upside and hit the take profit level (drawn on the chart). Time to Buy BTCUSD!
Time To BUY USDJPY now...USDJPY has been in a clear uptrend for the last few weeks but recently dropped a slight bit in the last 24 hours down to a powerful support level! It is currently held by strong support levels which means it is extremely likely to keep heading to the upside for much longer. The next target will be the fibonacci extension zone which is shown on the chart. USDJPY has struggled to break below support but has constantly been breaking through resistance levels. time to BUY USDJPY.
EURUSD ...Time To Buy NowEURUSD was in a recent downtrend for the last few weeks and struggled to stay bullish, but recently it has just broken a strong resistance trend line which it tested several times and failed to break through. EURUSD is very likely to hit the next major resistance zone which is market as the "TAKE PROFIT" LEVEL. There are many clear signs of new bullish movements. Time To Buy EURUSD.
BUY USDJPY now...USDJPY has been in a very clear uptrend for the last few weeks but recently dropped a slight bit in the last 24 hours down to a powerful support level! It is currently held by strong support levels which means it is extremely likely to keep heading to the upside for much longer. The next target will be the fibonacci extension zone which is shown on the chart. USDJPY has struggled to break below support but has constantly been breaking through resistance levels. time to BUY USDJPY.