GBPNZD: Classic Moving Average Trade
GBPNZD looks very bearish.
The market is currently approaching the MA.
From the intersecion point, we shorted.
Entry - 1.93
Stop loss - 1.94465
Target - 1.9083
Please, like and comment this post!
Tradingsignal

CRUDE OIL (WTI): Great Long Trade From Our Team
We spotted a nice buying setup on WTI.
The market retraced to a solid demand area.
From that we spotted a strong bullish reaction.
We bought from 115.52
Stop loss - 113.69
Take profit - 119.15
Please, support us with like and comment!

GBPCHF: Are You Ready to Sell
It is finally a great moment to short GBPCHF.
After a correctional movement, it looks like bears finally started to push.
Our entry - 1.20953
Stop loss - 1.21472
Take profit - 1.2013
Please, support us with like and comment!

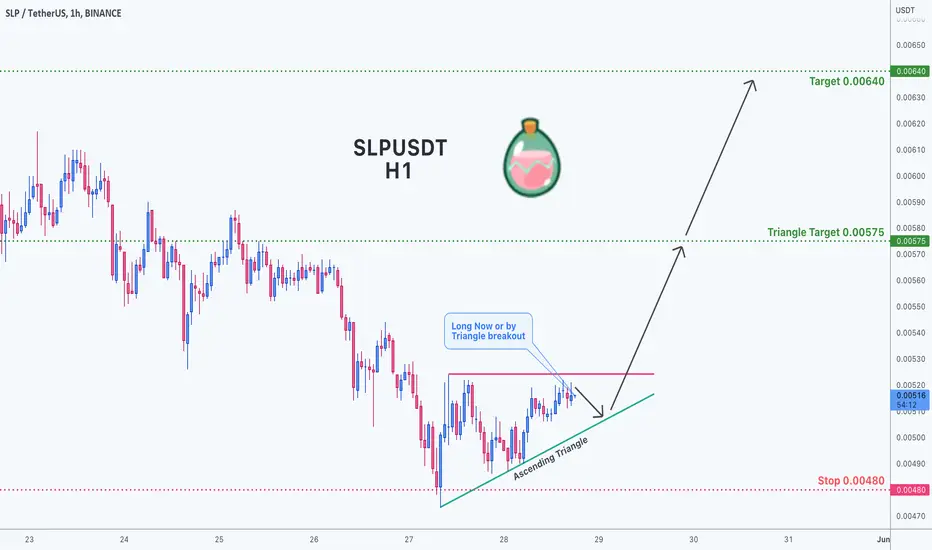
Ascending Triangle on SLPUSDTBased on technical factors there is a long position in :
📊 SLPUSDT
🔵 Long Now or by Triangle breakout
🧯 Stop loss 0.00480
🏹 Target 1 0.00575
🏹 Target 2 0.00640
💸Capital : 1%
We hope it is profitable for you ❤️
Please support our activity with your likes👍 and comments📝
AUDUSD: Great Long Trade Explained
We see a very nice long trading setup on AUDUSD.
We want to buy the pair from 0.71 level.
Stop loss will be 0.705.
Target - 0.72
Currently we have a buy limit order set.
Good luck!
Please, support our work with like and comment!

audjpy sell setup audjpy has the potential to form a rising wedges pattern, this provides a good opportunity to buy and continue the decline, an upward impulse wave will provide an impetus and destroy the supply area that has been used many times and will empty it

nzdusd manipulationnzdusd, a movement that is almost similar to gbpusd seems to be preparing for manipulation, this is quite interesting to watch and good enough if used to find profits and swings that are far away

audusd buy potential audusd has experienced a bad decline starting to approach fresh demand which is quite good this will certainly be a good buy area with a measurable risk entry but you need to know the confirmation first

xaauusd bullish potential on xauusd it has reached the closest supply and has the potential to continue its decline but below there is still fresh demand more or less it will be a good enough block to hold it temporarily but unfortunately today is the first Friday of the week where nfp will take place so I think this is quite dangerous to do purchase even though there is potential with minimum risk there

S&P500 Index (SPY) Risky Long From Support 📈
S&P500 is approaching a strong zone of demand.
On an hourly time frame, the price formed a tiny double bottom formation
and broke its horizontal neckline.
The price may retrace now to 4230 / 4270 levels.
❤️If you have any questions, please, ask me in the comment section.
Please, support my work with like, thank you!❤️

TRADE OF THE WEEK | Great Bullish Movement Caught 💰
Hey traders,
As you know, Natural Gas has recently broken key weekly structure resistance.
After a weekly candle close above, I was patiently waiting for a retest of a broken structure to buy the market.
When the price was retesting the underlined yellow structure I was looking for a confirmation to buy.
My confirmation was a tiny double bottom formation on 1H time frame.
I opened a long position on a retest of its broken neckline.
Great winner and nice profits.
❤️If you have any questions, please, ask me in the comment section.
Please, support my work with like, thank you!❤️

Gbpjpy break demand zoneGbpjpy break demand zone, potential go to the downside, follow trend on fresh spply zone orang swap zone
Don't forget to analysis again

gbpcad trading demand zone gbpcad has reached the demand zone so I can make a buying analysis with the first profit target at 1.641 and the second profit target at 1.651

chfjpy demand zone chfjpy is in a good enough demand zone and has the potential to break the trendline, with that we can speculate buy on the demand area and don't forget to use stop losses

cadchf sell setup cadchf has the potential to experience a downtrend with the formation of a supply area that is still fresh and quite good if selling there

Bitcoin on It's Way to $48KAs predicted earlier BTC is on its way to touch $43000 as TP 1 and then $48K

Choppy Gold ,Short prevailsGold is moving in a choppy trend since the end of last month . a buy signal will be given after the price takes a retracement to 1920 or 1910. Target price is 1930. The market is choppy and there is currently no trend.
On all time frames the price is sideways between 1910-1930.Currently the short trend is stronger and a short position can be taken above 1930 after the retracement starts after a false breakout

Take this quick trade and thank me laterwe just broke above a wedge, and a decline trend also. take this trade asap and tank me later

CAKE is Ready to Make Another Bullish MoveAfter successfully testing 8.40 region it is gathering strength to make another leg up where it will target 13$ area but before that it have to deal with the 200D EMA which can challenge it further. Currently its in a good buying zone but trade from this point will not lead directly to 13$ it might remain in range for few days.

eurcad sell limit eurcad is still moving down, but I see there is a decent supply area, this area is quite far away but it's okay to put a sell there maybe one day it will be taken haha
sell limit 1.42030 - 1.42330

eurjpy trading strategyeurjpy has been in the resistance area on the right shoulder at the price on the left, this is validated by the doji candlestick so eurjpy has the potential to decline quite well

gbpchf sell order I see a good area of support and resistance to place a position, I think the 1.24 point is a good point. it looks like a 1:4 risk reward is enough risk reward to get a profit. don't forget to re-analyze because this technique is still trial and error

EUR/CAD SYMMETRICAL TRIANGLEEUR/CAD in an obvious symmetrical triangle, a breakout from the upper trendline and 200-day SMA at 0.4100 would initiate a bullish run. If that did not happen, the triangle might get widened, or a deeper surge could emerge.
This is worth looking into as well.
A Sell stop order above 0.4100 could be set for a long-term target at 0.4500.
