Predictions and analysis
As part of the green wave (B), physical uranium recently experienced a small setback, but the short-term upward structure remains intact. We need to give the upcoming corrective rallies more room to the upside, which should be followed by a strong sell-off in the course of the green wave (C).
Related Symbols
Patience pays off. Looking to average down during a consolidating down trend. This is not a quick play - looking long term. 12-18 months.
Aurora continues its electrifying trajectory. The price dipped further into its inactive target zone during the last trading week and is now visibly striving to resume the primarily expected uptrend. These efforts should soon yield bullish results. Aurora’s next target, the resistance at C$1.59, lies approximately 60% away. This resistance must be surpassed to...
Hello Traders Investors And Community, Welcome to this analysis where we are looking at TSX 4-hour timeframe perspective which is showing up some quite interesting signals at the moment. As the main market has recovered from the corona-breakdowns seen this year the meaningful question is now if these recoveries are fundamentally backed to follow-up into a...
Symbol: CSE:BTC Blue sky is a prime example of a dormant stock about to bounce! Note the illustrated section where it notes crossing the MACD and I believe an upward trend to 0.06+ in near future, possibly the next two weeks! BTC = Buy in my opinion Note: This is not financial advice and I am not a financial advisor! Do your own research!
On the Daily i see Head and Shoulders Pattern with a price of $113. What do you think?
This model suggests tsx will not respect s/r like gold did not respect the s/r as set in 2011 in 2020. Blue lines meet about 23,000 around March 2024.
Ready for Lift-Off 2.0: Gold stocks have been pulling back since beginning of 2023 but this looks like the final pullback before lift-off similar to price action 2018-2020
Before Shopify's 10:1 split, it was trading for $1,800 USD. Notable because it was the Toronto Stock Exchange's biggest stock, trading over $2,000 CAD. This was the kind of stock that all the eyes used to be on. The company processes payments on the Internet and the work from home lockdown glory days are gone. The next time we're all under house arrest will be...
TSX:BNS After we are clear of earnings, I'll be looking for the price to pull back to the Nov 28 resistance of 71.50 near the 50 SMA and 50 EMA (old resistance becoming new support). If we can get confirmation with a reversal pattern double/ triple bottom or inverted Head and Shoulder, I'll be looking to enter with Real Life Tradings momo indicator. Stop loss...
I was overweight energy for most of 2022 selling my exposure around the summer and the remaining in the fall. It was not and easy decision but the trend in WTI and Brent prices was too bearish to ignore. Seems to me now It's only a matter of time we take out the 2022 low of 12.66, the more intriguing question is where we go once we get there ? On the weekly...
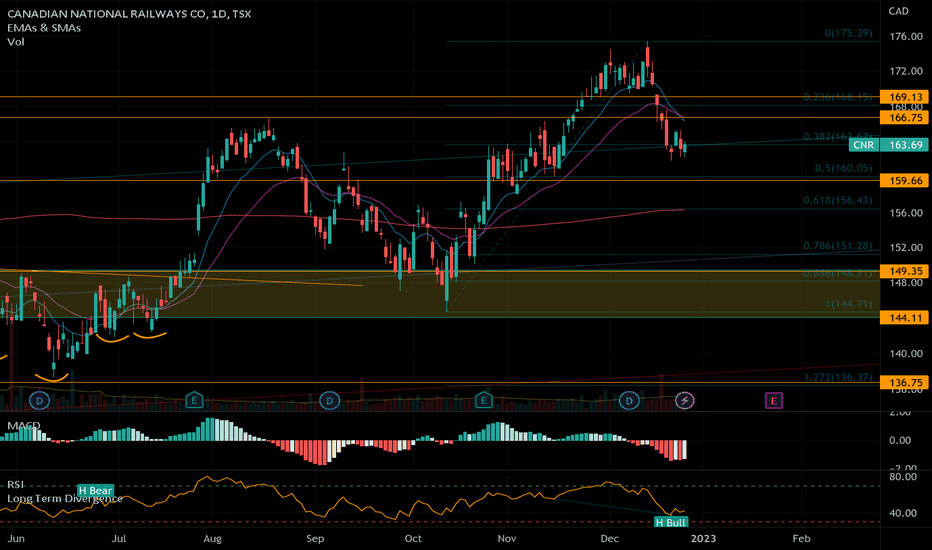
Looking to take a shot Longing CNR at the 50% Retracement, also a support level, waiting to see how the next few days go. Coming straight down to the 50% Retracement would put RSIs on lower time frames in a more favorable position as well
TSX | USD Expecting the TSX to show relative strength vs. other major indices due to the dovish BOC policies and a declining inflationary environment. Therefore, my bias is a short term correction into the FOMC meeting Dec 15th where the 19250 should hold as support into a reversal targeting 20,500.
Very beautiful chart from Toronto Exchange Market these days. If you have TSX tickets it is now time to buy in and hold for the uptrend. TSX broke out of the downtrend channel and I have no reason to believe it is a "fakeout". Good indicator support and good trend lines. I'm expecting a small amount of correction between 19400 and 19200 since the RSI index is...
Indicators showing strength of the range bottom, potential setup for a whipsaw beneath the range (likely due to fundamental news driven event) otherwise my bias is a bullish return to the median of the range.
Hello Traders, TSX is setting up for another bull run. Looking at the HTF we can see price is moving within a strong reversal structure which price impulsively reversed up breaking out of the upper boundary. On the LTF, price is currently in a correction after breakout indicating further growth. Thanks Trade Safe
Telus just released their earnings today and they were just as good as estimated but never the less the stock had no reaction and is now selling off. The chart looks real ugly if you look at the Monthly and Quarterly window we have managed no follow thru after the big move down to start the year, the bulls are running out of time to step in and take this higher....
We are just about half way thru earnings season for the TSX, with the next BOC meeting in September 7th and another hike of minimum 50bps is already guaranteed I think it opens up a great period for the TSX to make a new low. Earnings have been better than expected for a lot of the bigger companies in all sectors from industrials, utilities, staples and of course...


