Cameco (CCJ) vs peer group uranium miners (Jan 2023-April 2024)As a sector, uranium mining has been in a strong uptrend throughout 2023 with a peak in early 2024.
Pullback currently underway, based on Uranium U308 (UX1!) spot price softness since January 2024.
Geopolitical and operational factors to be considered: (a) Nuclear energy facilities in Europe and USA are reliant to a large degree on fuel sourced from Russia and Kazakhstan, which may be curtailed via legislation (sanctions on Russia and possibly Kazakhstan) or supply chain disruptions (reduced
U308
URA vs. U308 Futures ~ Snapshot TA / Uranium Bull IndicatorPerformance comparison between Global X Uranium ETF versus U308 Futures.
One of many Momentum Indicators out there that track Bullish movements in Uranium Sector.
Uranium stocks haven't always been closely-correlated to Futures due to their "risk-on" nature...so when stocks start outperforming when Futures + other confluences are also rallying..
You might have a good ol' fashion Uranium Bull run on your hands.
Boost/Follow appreciated, cheers.
Futures: COMEX:UX1! COMEX:UX2!
ASX ETFs: A
Cameco... Still GoingCameco continues to gain in price as spot uranium moves higher. We are seeing textbook breakout out of a triangle pattern with Cameco on pace for its highest monthly close since February of 2011.
Lower PPO indicator is in the process of a bullish cross of the green PPO line above its purple signal line. Both of these lines trending above the 0 level indicates that the overall momentum behind price is bullish, and with the bullish cross of the two lines it means that the short-term momentum
Uranium Renaissance Solar, wind and hydro are not practical replacements for fossil fuels. Nuclear is, and U308 price is starting to reflect the sentiment shift toward the cleanest of green energies. The Fukushima incident created a selloff in uranium for nearly a decade, but the trend has since reversed.
Uranium price has been in a healthy uptrend which began in 2021 with price crossing above short and long averages, and now price is trending above all averages with all averages moving higher. Lower PPO and
New swing trade ideaOutlining a range of probable upside targets from percentage gain, expanding wedge, and fib extension.
Who knows, but If expanding wedge breaks to the upside, fireworks.
FLong
Possible Livermore Accumulation CylinderI worry for the uranium sector. Not because of the fundamentals, but because it seems that "the life changing gains" were only experienced during strong moves in stocks.
The Cameco $ccj chart does show promise though, I see a {Livermore accumulation cylinder} in the making.
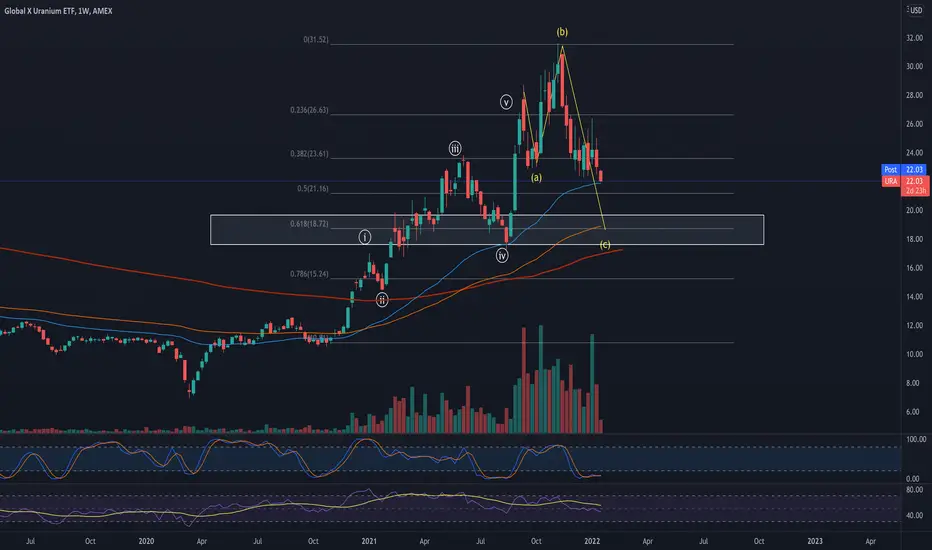
URACount on URA looks like 5 up followed by an irregular top which in EW terms means that after 5up impulsive waves complete the correction ensues but wave A falls short to correct the prior impulsive move then the B wave over shoots the top of wave 5 in an irregular top, the C wave that follows should be 5 down and make up for the A wave which was small in % compared to the trend. C wave should retrace to 618% fib lvl around $18
The case for Uranium: Master Plan with a Price Target of 100$+In the early 2000s, the flooding of the McArthur River and Cigar Lake mines were immediate black swan catalysts that further accelerated the existing bull market into a mania moving uranium spot prices to a peak of $150/lb in 2007. The flight to commodities as an inflation hedge following the Great Recession served as an additional catalyst underpinning the macroeconomics behind the commodity boom of the 2000s. The last bull run ended when higher supply combined with the fallout from the Fukishi
URANIUM UXC U308Uranium is set to move much higher according to this Ichimoku Cloud chart. The cloud has turned from red to green and the price @ $30.50 is hovering just outside of red cloud. Blue conversion line passed under yellow base line and is now outside of the red cloud. The most important confirmation is that Lagging Span is outside the green cloud as well. Looks like all 4 requirements are met.
Also Stoch, MACD and RSI are looking very good and in uptrend mode. Looks like this week uranium sector
CCJ possible price and time frame CCJ had an incredible run in a short period of time with multiple pullbacks which developed bullish pennants along the way with new ATH. Currently in consolidation mode with another bullish pennant in process. Looks like we have landed on a support line today with massive sell off due to Red Army attacking the market crashing pretty much all sectors. New target ATH $24.64 with approximal arrival of April 23rd. Like I have mentioned in DNN analysis Uranium has strong fundamentals with 60 milli