Natural Gas ReversalLarge volume and a wick after an extended down move in Natgas. Also forward curve is bullish relative to spot price. Don't buy UNG because of the roll decay, buy the spread NGH2018-NGJ2018.
UNG


$UNG short here Short UNG here, stop 7.11
Take profit is a negative close today. If this event doesnt happen, then we hold overnight.

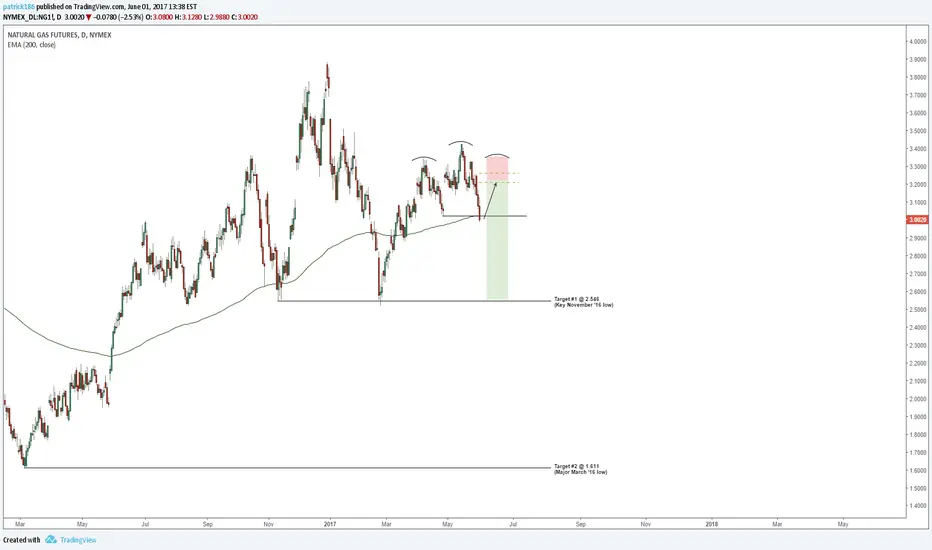
NGAS Short Entry PlanI'm looking to short Natty Gas soon and need to see just a few more things before I'm satisfied.
We formed a high-test on the monthly with May's close and that's awesome confirmation of the large weekly head and shoulder pattern. I'm now watching for a head and shoulder pattern on the daily and a pullback to the fibs for the right shoulder. That is where I'll look to enter.
The dirty deets:
Watching for a bounce off of the 200ema between now and friday to send price back up to the fibs and right shoulder area.
I'm looking to enter in that area (drew ideal position setup) with around a 5:1 reward:risk ratio to Target #1.
Target #1 sits at the key weekly November '16 low with Target #2 way down at the major March 16' low. It won't take too much effort to get to the first target, but the second target is going to take a bit more oomph. Just need to wait and see what price action develops once we reach that area to determine the probability of hitting that second target.
For more in depth analysis and my price action based theory behind the trade checkout: patstrades.com
Closed my short on natural gas. Had a position in DGAZ which has done well. NG may drop more but I deciced to take profits after relooking at the chart. Here is another posible course and count as compared with previous post (link below). Take care.

Shorting natural gas.Follow from recent post. In the last 3-4 days NG made a .62 up correction from recent drop. Today has started dropping again.

NATGAS, BOIL long ideaLooks like a bull flag forming on NATGAS tracker BOIL 2x. Id like to buy in on the next tag of the lower flag line. Around $11


Natural Gas Preparing For A Major Move Up (with image)
I'm republishing this along with an image. Fibonacci spirals on TradingView are not static which causes problems viewing the spirals correctly. Please refer to the image to understand the intended result.

Natural Gas Preparing For A Major Move UpPlease review notes on chart. Don't sell yourself short by containing yourself in a linear format. Price action follows a curve.


Natty - One way down... Eventually.Not much to say here. It's been a very annoying "wait" for a short here but I "think" we got the beginning of a setup. Wait for a break of the lower trendline + flag. However, I think they might want to bring it up for one more push near the 50% retracement. GL

NATTY possible abcde correctionJust a quick observation here. This looks like a corrective structure. I'd LOVE to see the top part of trend line hit, BUT high volume was unable to break the "bigger tend line top" so maybe the fall starts now?
I still think "natty" has one more leg down before a major buy.


Natty - Don't fish.There is zero reason to bottom fish here yet. This is where patience on a long entry will save you a lot of headaches. There is still no clear divergence (RSI & MACD) indicating that this "could" be the bottom.
As you can see, the "rally" we had this morning is all gone, suggesting another leg lower. I've updated the natty chart with a clearer channel. I'm waiting on better signals for an entry.

Natural Gas. Looking it over. How it looks to me.Natural gas is such a great clean source of energy. A favorite for homes. Likely someday will power cars as well. Hard to believe longer term it will not become more expensive. But currently clearly in a shorter term downtrend (down about 5% today so far).
Looking at the daily chart it looks like we have already had a 5 wave up move and are now are in a abc correction. IFFFFFF correct when the correction is over I would expect at least one more 5 wave up. The colored target box seems is where I think the correction may well stop. Will be watching for positive candles or down trend line break.
Hope this will be helpful. Take care. Have a good week.

Natty Long Setup - Play of the year? It's time to pay attention to NATGAS this week. The next big move up is soon. First area of interest is the 2.95-ish area. GL

Nat Gas HVFWorth keeping an eye on the tightening range here.. A break has the respective HVF target in its direction. Targets line up surprisingly well with the extremes. I will be watching close to potentially start a position here in coming days.


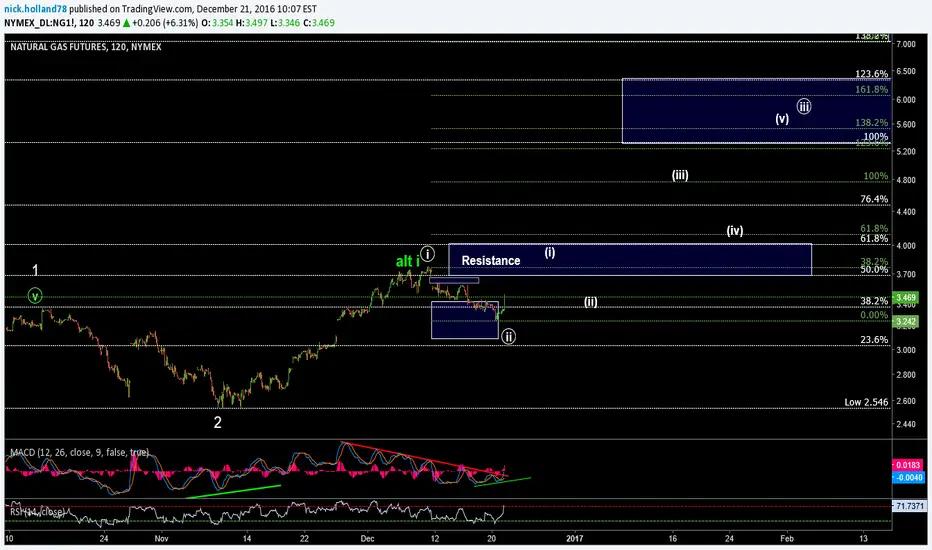
NG1! - 2hrStrong reaction out of the support box (see prior idea) may indicate wave cir-ii is complete. Stop at last low. Initial target is resistance in wave (i). Hold a corrective pull-back for (ii) and this could fly in wave (iii) of cir-iii of 3.
Green fibs are updated, matching the minute waves. White fibs are measured off of the presumed 1-2.

Cool weather will see gas retrace to pre-drop levelsSee a possible pull back to retest support then slow uptrend

I'm In! Nat Gas $UNG. See The Trade HereWhat an epic fall on natural gas lately. The commodity tracking ETF $UNG has collapsed from $9.65 to its current $7.00 in the last month. This is a whopping drop of 27%. I love collapses like this because it means there will be a big bounce. If an investor or trader can analyze the commodity chart correctly, there is huge money to be made. I did it. After analyzing the chart, natural gas is a buy here. I am in fact buying $UGAZ, a 3X Long Natural Gas ETF. This is riskier but gives you more payout on a hard bounce. Note the stock chart below to see the awesome support level being hit.
View my verified track record performance here: verifiedinvesting.com
