USDSEK H4 Potential Bullish Bounce | 1st March 2022Prices are on bullish momentum and abiding to our ascending channel. We see the potential for a bounce from our buy entry at 9.44595 in line with Fibonacci Confluence (61.8% Fibonacci retracement and 61.8% Fibonacci projection) towards our Take Profit at 9.60693 in line with 161.8% Fibonacci extension . Our bullish bias is further supported by how prices are trading above our Ichimoku cloud indicator and RSI are at levels where bounces previously occurred.
Any opinions, news, research, analyses, prices, other information, or links to third-party sites contained on this website are provided on an "as-is" basis, as general market commentary, and do not constitute investment advice. The market commentary has not been prepared in accordance with legal requirements designed to promote the independence of investment research, and it is therefore not subject to any prohibition on dealing ahead of dissemination. Although this commentary is not produced by an independent source, FXCM takes all sufficient steps to eliminate or prevent any conflicts of interest arising out of the production and dissemination of this communication. The employees of FXCM commit to acting in the clients' best interests and represent their views without misleading, deceiving, or otherwise impairing the clients' ability to make informed investment decisions. For more information about the FXCM's internal organizational and administrative arrangements for the prevention of conflicts, please refer to the Firms' Managing Conflicts Policy. Please ensure that you read and understand our Full Disclaimer and Liability provision concerning the foregoing Information, which can be accessed on the website
USDSEK

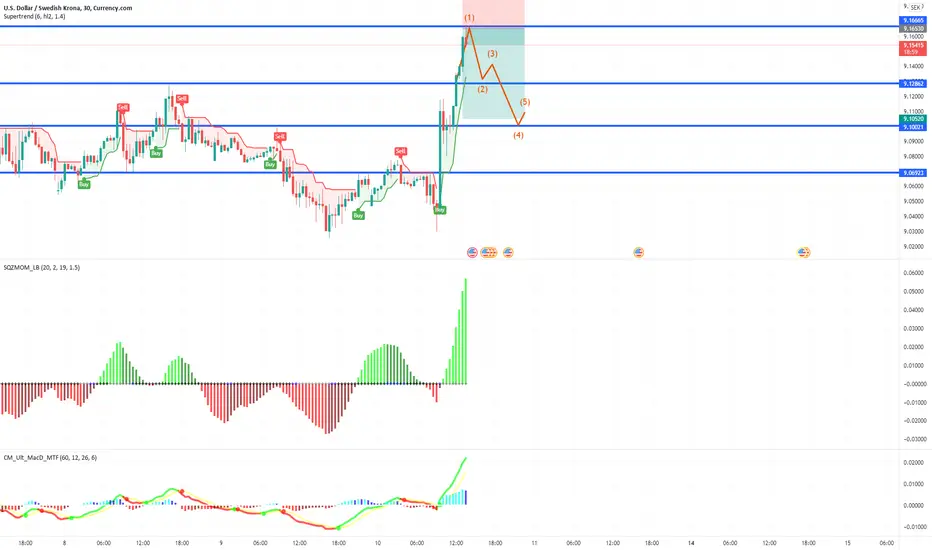
Elliott Wave View: USDSEK Looking for Another Leg HigherShort Term Elliott Wave View on USDSEK suggests that the pullback to 9.06 ended wave 2. Pair has turned higher in wave 3 with internal subdivision as a 5 waves impulse structure. Up from wave 2, wave (i) ended at 9.178 and pullback in wave (ii) ended at 9.075. Pair resumes higher in wave (iii) towards 9.351, pullback in wave (iv) ended at 9.237, and final wave (v) ended at 9.45. This completed wave ((i)) in higher degree.
Pullback in wave ((ii)) is currently in progress to correct rally from February 4, 2022 low before the next leg higher. Internal structure of wave ((ii)) is unfolding as a double three Elliott Wave structure. Down from wave ((i)), wave a ended at 9.345, wave b ended at 9.4195, and wave c ended at 9.278. This ended wave (w) in higher degree. Rally in wave (x) ended at 9.3427. Wave (y) lower is in progress with internal subdivision as a zigzag Elliott Wave structure. Down from wave (x), wave a ended at 9.244, and wave b ended at 9.315. Near term, as far as pullback stays above 9.06, expect pair to extend higher.

USDSEK TO THE MOON!The central bank unveiled a path for interest rates that signals a hike only “slightly earlier” than previously, with a move now penciled in for the second half of 2024 rather than the final quarter. The governor stopped colleagues from starting a wind-down of the bond portfolio, with his casting vote determining the outcome for the first time since 2008.

Short Vision on USD SEK for 10/2/2022Hello Dear Traders,
You find below my analysis for USD/SEK, the currency pair is in the sell zone. I expect the price to fall. According to my set of rules, in the M30 frame USD/SEK will fall to 9.13 as I am showing in my chart. Our Daily Goal is 9.11
Currently, USD/SEK is moving towards the resistance level 9.17,where there is some liquidity from this value we are looking for short-term selling opportunities of USD/SEK.
Good Luck and enjoy your Bearish Market for today.
Entry:@9.17
TP1: @9.15
TP2: @9.13
TP3: @9.11
SL: @9.2
As mentioned on previous posting, we oscillate daily with the market based on Human Behavior and Sentiment.
Feel free to share your thoughts and opinions in the comment section below, I will be glad to discuss my friends!


USDSEK Horizontal Support Levels USDSEK
Trend: Up
Level: Horizontal Support Level, EMA 10 Support Level, EMA 20 Support Level, Fibonacci Retracement Support Level
Signal: Rejection Candlestick


USDSEK Take Profit Price 9.24240USDSEK Inside Bar formed at EMA 10 Support Level, EMA 20 Support Level, and Horizontal Support Level.

Elliott Wave View: USDSEK Impulsive Rally Should ExtendShort Term Elliott Wave view suggests cycle from December 6, 2021 high has ended with wave (4) at 8.896. Internal subdivision of wave (4) unfolded as a Flat Elliott Wave structure. Down from December 6 high, wave A ended at 9.0025 and rally in wave B ended at 9.1494. Pair then extended lower in wave C towards 8.896. We can see in the 45 minutes chart below the internal of wave C subdivided as a 5 waves impulse. Down from wave B, wave ((i)) ended at 9.0613 and rally in wave ((ii)) ended at 9.1037. Pair then extended lower in wave ((iii)) to 8.9025, wave ((iv)) ended at 8.941, and wave ((v)) ended at 8.8961. This completed wave C and (4) in higher degree.
Pair has turned higher in wave (5). However, it still needs to break above December 6, 2021 high (9.1859) to rule out a double correction. Up from wave (4), wave (i) ended at 8.939 and pullback in wave (ii) ended at 8.903. Pair then extended higher in wave (iii) towards 9.036, and pullback in wave (iv) ended at 9.0153. Final leg higher wave (v) ended at 9.0429 and this completed wave ((i)) in higher degree. Near term, wave ((ii)) pullback is in progress to correct cycle from January 13, 2022 low before the rally resumes. As far as pivot at 8.8961 low stays intact, expect dips to find support in 3, 7, or 11 swing for further upside.


usdsekusdsek as powel elected again usd gain power so i think it will compelete its move to next box so we wait till see what will happn in next resis

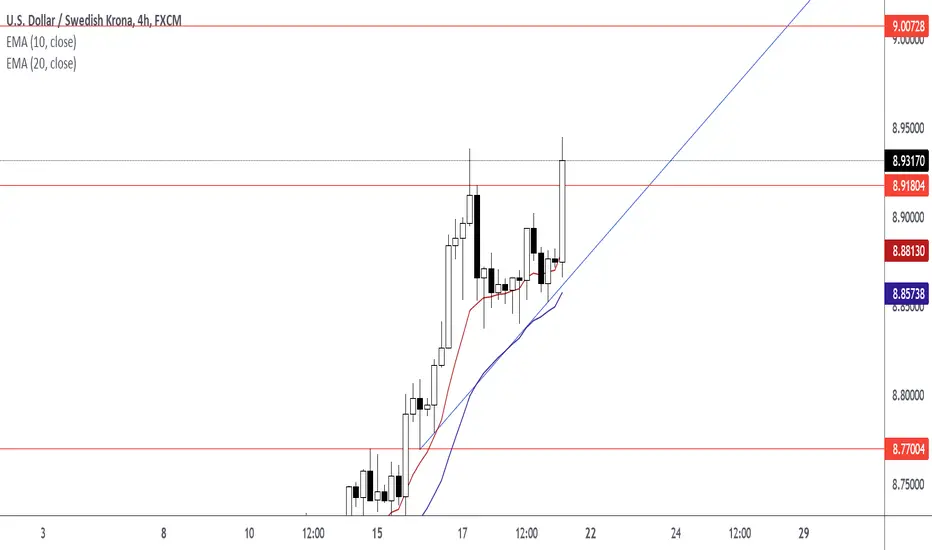
USDSEK Triangle Chart Pattern (Target Price 9.00728)USDSEK Foreign Currency Pair
Trend: Up
Level: EMA 10, EMA 20, Diagonal, Horizontal
Signal: Break Out Candle
USDSEK shortThe market continues its downward movement. I have marked the place, price and target. I am waiting for the price to come back, the signal from the chart and I will open the position

LONG [U.S. DOLLAR / SWEDISH KRONA]Series of higher highs and higher lows is visible, which indicates it is in bullish trend.


USD/SEK LongUSD/SEK seems to have formed a double bottom pattern and is now moving higher towards well defined resistance zones. Shorter term it has formed a small double top which could see prices move down to support and clear out some stops before climbing higher. It may simply push higher and breakout from here though as well.
OANDA:USDSEK


USDSEK Wave X ?BullishQuite likely.
We are in a general bearish pattern on this one, now in respite. The latest set of waves do not for a 5 wave impulse in my opinion. It just doesn't have the look, let alone fulfill the extension rules of EWT. It is more in line with "double two" that Mr Elliott described so many years ago. I am willing to put a number of fibgoals, more based on the huge zigzags preceding these short, small spurts of growth.
As always, this is not financial advice, so please do your own research.


1HR USDSEK Long USDSEK Long
You can set a longer stop loss.
I would love to hear your feedback do you think the trade will complete in profit or will the stop loss get hit!?
This is not financial advise, trade at own risk.

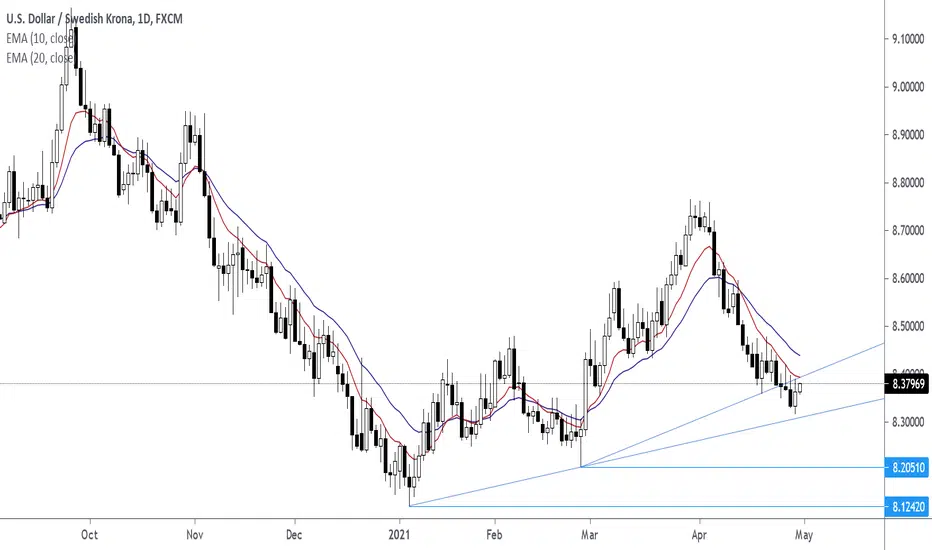
USDSEK Lower Highs On The Daily Chart, Weekly Chart, H4 ChartLower Highs are pushing into trend line support. Wait for confirming price action signal like a pin bar for an entry. Lower Highs are present on the Daily, Weekly Chart, and H4 Chart.
EMA 10 EMA 20 are pointing downwards on the time frames mentioned.