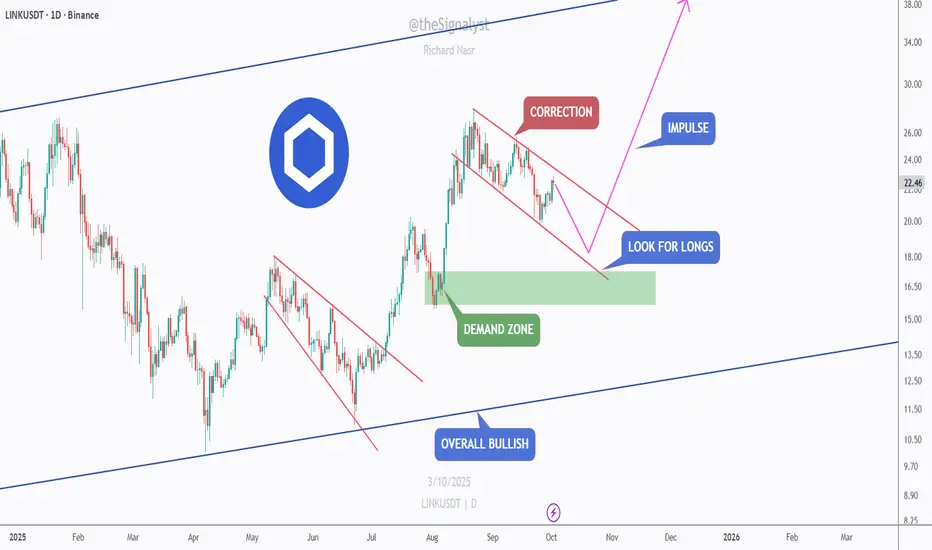
LINK — Bullish Structure, Corrective Dip into Demand!LINK remains overall bullish on the higher timeframe. Price is pulling back inside a descending channel (correction) after August’s impulse and is approaching a daily demand zone around $17–$18.5.
Scenarios:
Bullish 📈 Hold $17–$18.5 and/or break & close above $22.5–$23.5 → momentum toward $26, then $30+ if trend accelerates.
Bearish 📉 Daily close below $17 would weaken the structure and risk a deeper retrace before bulls try again.
Plan:
Look for confirmation at demand (higher low / bullish candle) or trade the break–retest above the channel for momentum entry.
⚠️ Disclaimer: This is not financial advice. Always do your own research and manage risk properly.
📚 Stick to your trading plan regarding entries, risk, and management.
Good luck! 🍀
All Strategies Are Good; If Managed Properly!
~Richard Nasr
Veles
SOL – Bulls Holding the Channel!SOL has been overall bullish, trading inside a clean ascending channel. Price broke above the $215 – $220 structure zone and pushed higher, but is now pulling back for a retest.
This zone is key 🔑 . It aligns with channel support, making it a strong confluence for buyers to step in. If bulls defend it, momentum could continue, and SOL may push toward higher levels inside the channel 🚀.
If the zone fails, a deeper correction could follow before another attempt from the bulls. Until then, the bias remains bullish as long as structure holds.
What do you think — will the bulls 🐂 step in and send SOL flying again, or will bears take over for a deeper pullback? 🤔
⚠️ Disclaimer: This is not financial advice. Always do your own research and manage risk properly.
📚 Stick to your trading plan regarding entries, risk, and management.
Good luck! 🍀
All Strategies Are Good; If Managed Properly!
~Richard Nasr

ETH/USDT Analysis -> towards upper levelsHello guys!
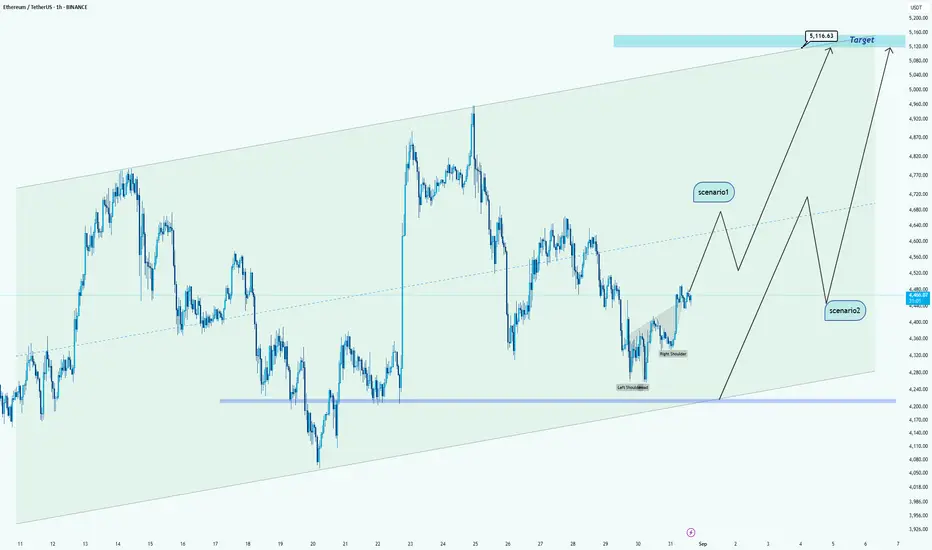
Currently, Ethereum is trading inside a clear ascending channel and has just formed a potential inverse head & shoulders pattern near the channel’s support. This setup gives us two possible scenarios:
🔹 Scenario 1:
If ETH continues its bullish momentum and breaks above the mid-line of the channel, we could see a strong push toward $5,116, which is also aligned with the channel’s upper boundary.
🔹 Scenario 2:
If ETH fails to hold above the current levels, we may first see a retracement back toward the $4,200 – $4,250 support zone (channel bottom). From there, the price can gather momentum and still aim for the $5,116 target in the bigger picture.
Conclusion:
Both scenarios point toward a bullish bias in the mid-term. The difference lies in whether we get a direct rally (Scenario 1) or a deeper correction before continuation (Scenario 2).
BTC/USD Technical AnalysisHello guys!
The price has broken through the last resistance level and is currently forming a Head and Shoulders (H&S) pattern. At this stage, it's unclear whether we’re seeing a reversal H&S or a continuation H&S. Here’s how to play it:
1️⃣ If the neckline breaks upwards, consider going long with a target toward the pink resistance zone. This area is key for shorts, so be prepared to flip your position here!
2️⃣ If the neckline holds as resistance, look for short opportunities targeting:
$106,460
$105,250
💡 My strategy:
Open half your short position now. If price moves toward the pink zone, add more shorts there for a stronger position.
⚠️ Caution: Always keep an eye on the neckline, it will determine whether we go bullish or bearish from here!

SOL - Retest the Zone, Reload the Longs!Solana continues to trade within a well-defined ascending channel on the daily timeframe. After a strong bullish leg, price is now pulling back toward the highlighted support zone, which also aligns with the lower bound of the short-term channel.
As long as this area holds, it offers an attractive spot to look for fresh long opportunities. A confirmed bounce here could set the stage for continuation higher toward the channel’s upper boundary.
The structure remains bullish, and dips into demand are where the best risk-to-reward setups lie. Keep an eye on this zone for the next move.
⚠️ Disclaimer: This is not financial advice. Always do your own research and manage risk properly.
📚 Stick to your trading plan regarding entries, risk management, and trade execution.
Good luck!
All Strategies Are Good; If Managed Properly!
~Richard Nasr

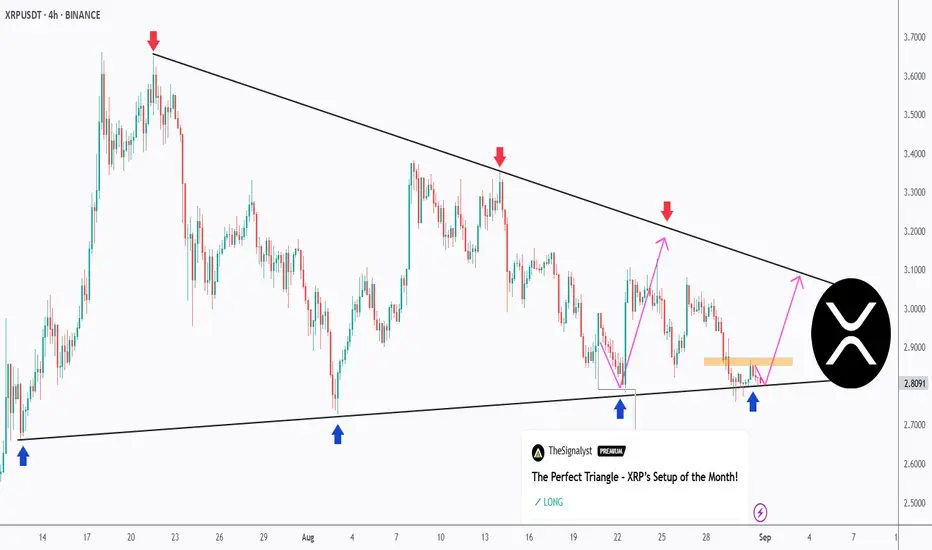
Let’s Do It Again – XRP Retests the Triangle Support!XRP continues to coil inside a textbook symmetrical triangle on the 4H timeframe.
🔻 Sellers remain active at the descending trendline (red arrows).
🔹 Buyers are once again stepping in at the rising support (blue arrows).
📉 Price is now retesting the lower bound of the structure. As long as this zone holds, we can anticipate another potential bounce toward the upper boundary.
🚀 For the bulls to take full control, a break above the last high marked in orange is needed. A confirmed breakout from this triangle will likely define XRP’s next major move — either continuation higher or a bearish breakdown.
This clean and well-defined triangle keeps XRP among the most exciting setups to watch right now!
⚠️ Disclaimer: This is not financial advice. Always do your own research and manage risk properly.
📚 Stick to your trading plan regarding entries, risk management, and trade execution.
Good luck!
All Strategies Are Good; If Managed Properly!
~Richard Nasr
XAU/USD Technical Outlook – Short-Term Dip, Bigger Upside AheadHello guys.
It is what I see:
We can see that Gold is currently trading around $3,404, consolidating after a strong bullish move inside a rising wedge formation. The wedge has now broken out to the upside, and price action is showing a potential head and shoulders pattern near the top.
Head and Shoulders:
The left shoulder, head, and right shoulder are clearly visible, and the neckline is sitting around the $3,399–$3,400 zone. If price dips and retests this neckline, we could see a short-term bearish move toward the target of the head and shoulders around $3,399. This is a healthy pullback after the recent rally.
Bigger Picture (Wedge):
Even though we might see a short-term correction, the larger wedge breakout suggests continuation to the upside. The measured target of the wedge points toward $3,430, which lines up as the next resistance level.

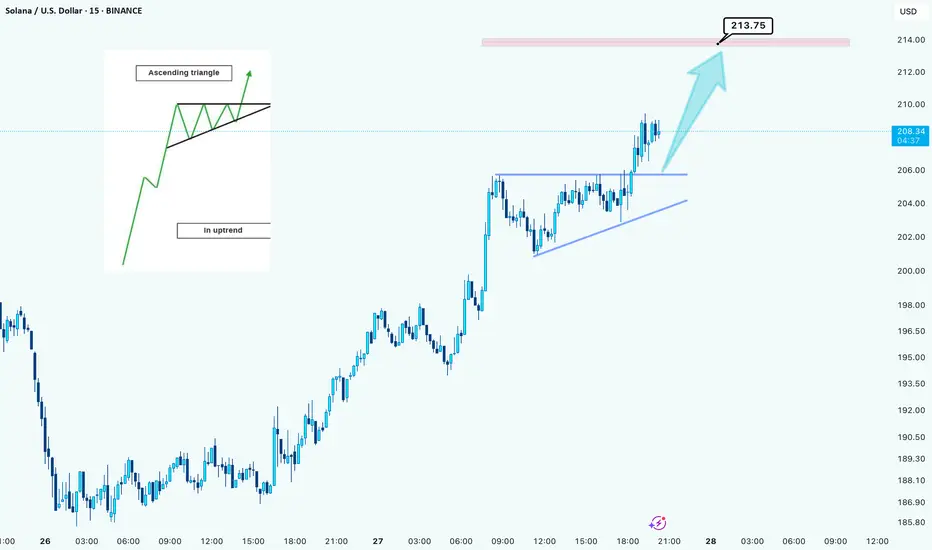
Solana Breaks into an Ascending Triangle – Bullish Continuation Hello guys!
The chart shows Solana (SOL/USDT, 15m timeframe) forming a classic ascending triangle pattern during an ongoing uptrend. The upper resistance level around $206 has been tested multiple times, while the rising trendline from the bottom confirms consistent buying pressure and higher lows.
This setup is a textbook bullish continuation signal, where buyers gradually squeeze sellers against a flat resistance until a breakout occurs. The breakout has already taken place, with SOL pushing above the resistance zone and heading toward the next key target around $213.75, which aligns with the projected move from the triangle’s height.
As long as price holds above the broken resistance (now support), momentum favors further upside. If bulls maintain control, we could see a continuation toward higher resistance zones. However, a drop back below the rising trendline would weaken the setup and signal caution.
most important levels:
Support (retest zone): $206
Immediate target: $213.75
Next potential resistance: above $214
Overall, the breakout from this ascending triangle suggests bullish momentum remains strong for Solana in the short term.