VIRTUAL - MAJOR BREAKOUT, Long-Term Resistance Under Pressure!📊 Technical Analysis — VIRTUAL/USDT
🪙 Coin: SPARKS:VIRTUAL
⏳ Time Frame: 5D
📐 Pattern: Long-Term Descending Triangle + Descending Trendline Breakout 📉➡️📈
---
🔎📊 MARKET STRUCTURE
SPARKS:VIRTUAL has been trading under a long-term descending yellow trendline 📉🟡 since the major high around $5.25. This trendline has repeatedly acted as dynamic resistance 🧱🔴 and has kept the broader structure bearish.
However, price has spent an extended period consolidating above the $0.40–$0.55 demand/suppo
Virtualanalysis
$VIRTUAL approaching a very important zone!BINANCE:VIRTUALUSDT is hitting a Strong Resistance zone ($1.05 – $1.15) that has capped multiple recovery attempts since early 2025. While the recent Coinbase listing and Base robotics cohort expansion provided a boost, the price is now struggling against a multi-year descending trendline.
BINANCE:VIRTUALUSDT is testing the major $1.05–$1.15 resistance zone while struggling below a long-term descending trendline.
Recent Coinbase and Base robotics news boosted price, but momentum is fading
False Breakout Above Triangle — Expecting Real Breakdown to 0.25Price has been compressing inside a large symmetrical triangle for an extended period. Recently, we saw a false breakout to the upside , which was quickly rejected and followed by a return back inside the structure — a classic sign of bull trap.
At the moment, price is holding near the lower boundary of the triangle. After a small corrective bounce, I expect the true move to start with a breakdown below the triangle support, confirming bearish continuation.
If the breakdown is confirm
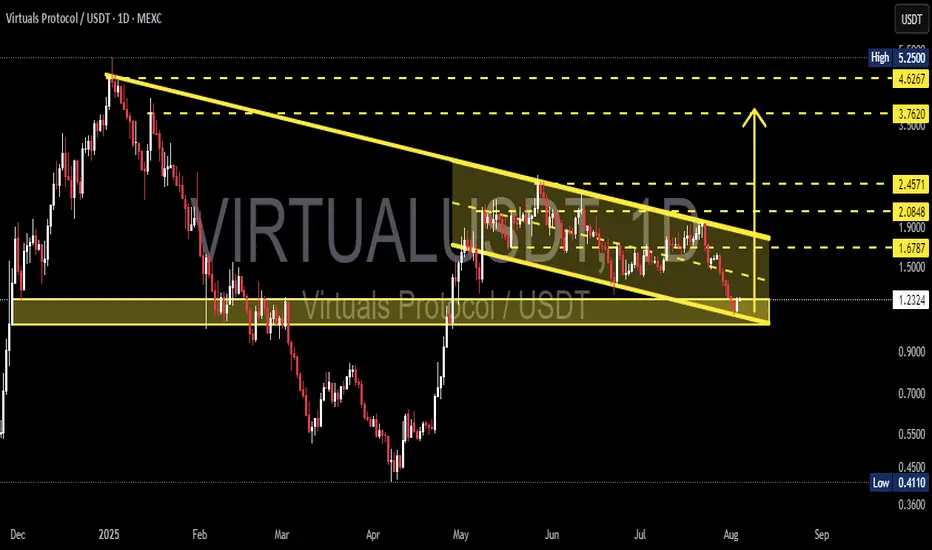
VIRTUAL/USDT – Rebound Incoming or Deeper Collapse?🔍 Overview: Bearish Pressure, But Structure Holds
VIRTUAL/USDT is currently consolidating within a well-defined Descending Channel pattern that has been forming since early May 2025. While the trend is bearish, price action remains within a controlled structure — a potential sign of hidden accumulation or smart-money positioning.
What makes this setup compelling is that price has just touched the lower boundary of the channel while also interacting with a historical demand zone around 1.20–1.2
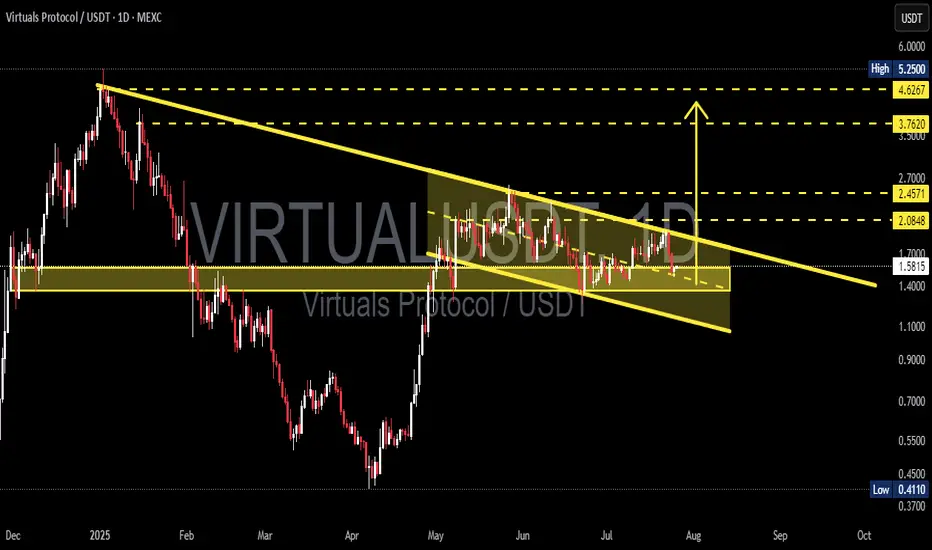
VIRTUALUSDT – Is the Wedge Nearing Its End? A Breakout Could!⏳ Current Situation:
VIRTUALUSDT is approaching a crucial moment after months of sideways price action. Following a steep decline from its all-time high ($5.25), price action has formed a Falling Wedge pattern — a well-known bullish reversal formation.
Now, as price consolidates toward the wedge's apex, the potential for a breakout grows stronger with each passing day.
---
📌 Pattern Structure:
Pattern: Falling Wedge (Bullish Reversal)
Duration: Since May 2025 (multi-month)
Support line:
$VIRTUAL Breakout Alert!!A clean inverse head and shoulders pattern has just triggered, and we’ve already seen a strong breakout above the neckline!
This is a classic bullish reversal signal, and the chart is screaming momentum
🟢 Key Levels:
• Entry around the neckline breakout
• Targets lined up: $2.36, $2.59, and $2.89
• SL below right shoulder: $1.91 for risk control
The 200 EMA is now sloping upward — further confirmation of trend shift!