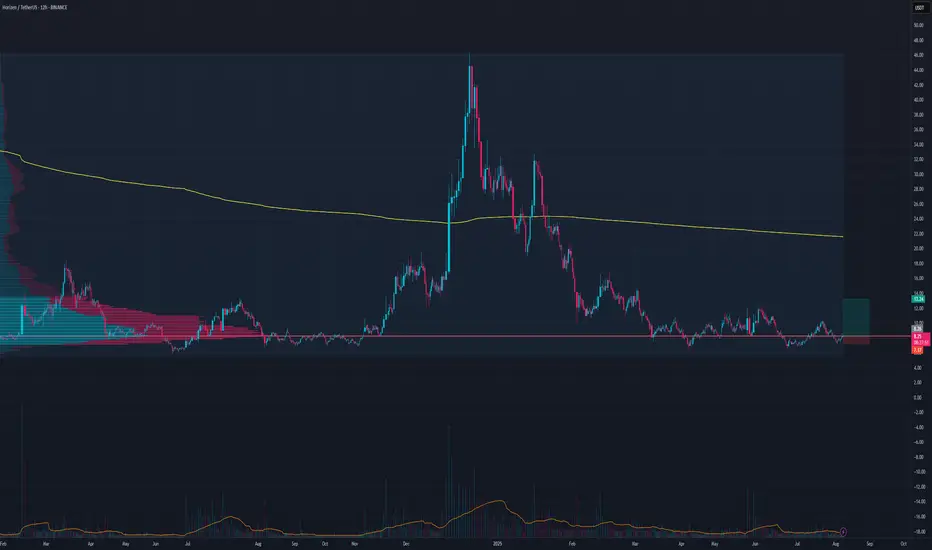
XRP - MacD selling divergenceCan you see it?
Don't forget the backtest out of the flag.
I don't think it'll be too big yet, they still want the daily pivot squeeze into Oct for the ETF's.
It also looks like coinbase isn't selling off XRP, big money are moving their XRP off coinbase itself into more secure places. Prepare yourself.
Volume

Gold (XAUUSD) Long Setup — VWAP SMC + Liquidity Sweep ConfirmatiOn the 1H chart of Gold (XAUUSD), price has swept liquidity below recent lows (ABS & BT confirmation), then reclaimed Weekly VWAP support with strong bullish momentum.
The AlcoTrade Omega — VWAP SMC with Liquidity Sweeps indicator shows:
HTF Bias: LONG
Score above threshold (Score L 2.0 vs Thr 1.3)
Clear absorption and BigTrades aligning with VWAP band support
Trade Idea:
Entry: After bullish reclaim of VWAP band
Stop Loss: Below recent swing low / VWAP band support
Target: Previous highs and Weekly VAH
Risk-to-Reward ratio is favorable (>1.5).
This aligns with Smart Money Concepts (SMC) principles: liquidity grab → VWAP confirmation → trend continuation.
Tags:
#XAUUSD #Gold #VWAP #SMC #LiquiditySweep #OrderFlow #SmartMoney #TradingStrategy #VolumeAnalysis #PriceAction

BTCUSD 1D Bitcoin making new climbing plansAfter the summer correction Bitcoin is once again showing strength.
The chart is shaping a rising channel and the pullback to the 108500 support worked textbook-style.
Moreover, a breakout above 113000 will open the way directly to 125000.
Volume profile supports the buyers’ side while the price action looks like a healthy pause before the next impulse.
Fundamentally the backdrop stays bullish with institutional flows into ETFs and Fed rate cuts still on the table for year-end.
The irony is that while many were waiting for 94k or lower Bitcoin just secured its rope and started climbing higher.

Technical Analysis – Chainlink (LINK/USDT)Chainlink has been consolidating for over 3 years inside a large symmetrical triangle on the weekly chart. Now it’s reaching the final stage of the pattern, close to a decisive breakout.
Chart highlights :
Ascending support since 2022, respected multiple times.
Major resistance around $25 – $27, the key breakout level.
A confirmed breakout could target $50 – $52, near the all-time high.
Ichimoku cloud shows a bullish bias, with price attempting to hold above it.
Main scenario : If LINK breaks above $25 – $27 with strong volume, it could trigger a rally toward the $40 – $52 zone.
Alternative scenario : A drop below $15 would invalidate the pattern and potentially drag price back to the $10 – $12 range.
What I think: Chainlink is about to make a major move after years of accumulation. The breakout direction will define the market trend for the coming months.

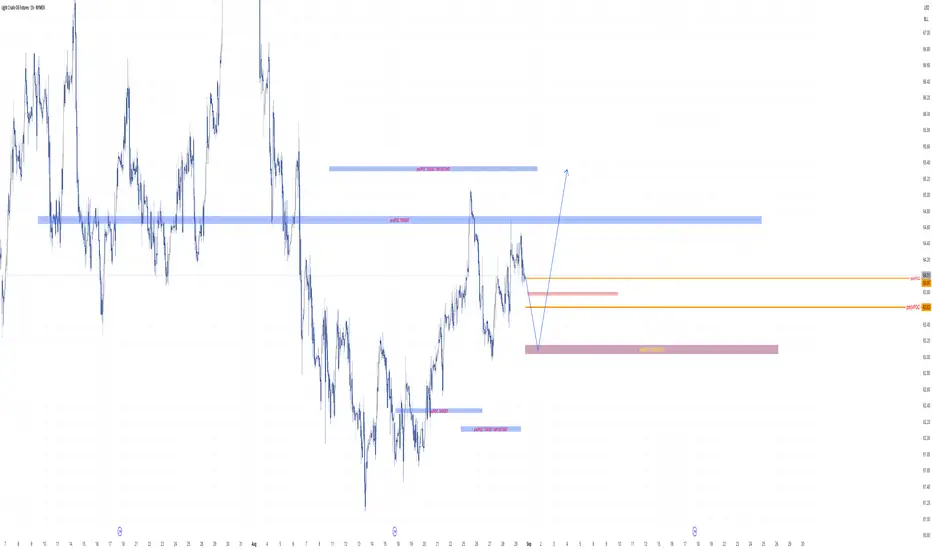
WTI: weekly seller targets reached, monthly targets still lowerHi traders and investors!
This analysis is based on the Initiative Analysis concept (IA).
The sellers have reached the targets mentioned in the previous review (65.628 and 64.378).
What to expect next.
Daily timeframe
On the daily timeframe (D1) for WTI, we see a manipulation of the 65.771 level, which may indicate that the market is moving toward the monthly targets I mentioned earlier — 61.818 and 58.504.
Hourly timeframe
On the hourly timeframe (H1), this manipulation appeared as a false breakout of the upper boundary of a sideways range. The range boundaries are clearly defined: the upper boundary at 65.771 and the lower boundary at 63.580.
Wishing you profitable trades!

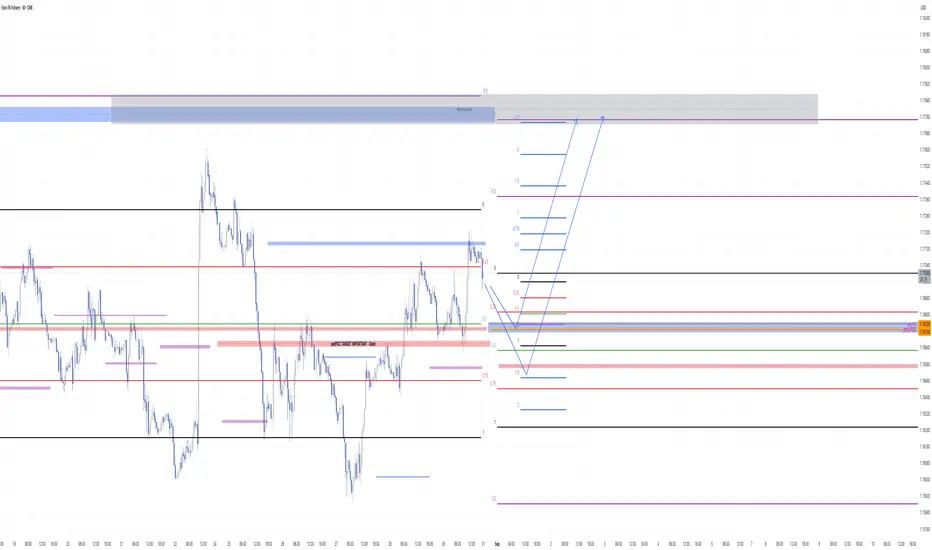
BTC - WEEKLY PRICE UPDATE🟩 #BITCOIN - Weekly Price Update
🔸 Monthly: Bullish, macro uptrend is intact! 📈
🔸 Weekly: Neutral zone between $116,000 - $110,700
Following my previous outlook and livestream, price tapped the $107,000 area as expected. ✅
Here’s what I’m watching: If CRYPTOCAP:BTC pushes and holds above $110,000 daily, we could see another wave up and potentially new ATHs, trend would stay strong!
Currently, the technical setup is bullish📈
→Daily lagging span still above the cloud and SSB
→D1 candle just closed inside the KUMO = classic bullish continuation signal!
💡 My expectations:
Short-term:
→If bulls defend $110,000+ = bullish zone, see a leg to $115,600 - $116,000 next!
→If we get a D1 close & breakout above $116,000, expect further upside toward $120K+ 🚀
→Breakdown under $107,000 = negative, could trigger deeper selloff.
📊Big picture:
Momentum remains solid above $100,000 and especially $94,000 support.
Expect some green days for #alts if we hold above level mentionned as well in the coming sessions!

Sep 2, 2025 - SOLUSDT Long Position ReviewFollowing up on yesterday’s analysis, with each reaction to the 204.34 level, I became more confident about the presence of sellers above this zone. At the same time, since every rejection off this level was also creating a higher low , I decided to treat it as a risky long trigger.
After the breakout of this line and the 15m and 1H candle closing above it, I was still cautious, suspecting that the main sellers might be sitting around 206.24 .
At that point, as the RSI also reached its resistance line, I placed a buy stop order at 207 , just above the highest previous wick. I intentionally set the buy stop at the highest possible point to ensure that both price and RSI had convincingly broken their resistances.
This position is still open, and I’m now waiting for higher targets to be reached.

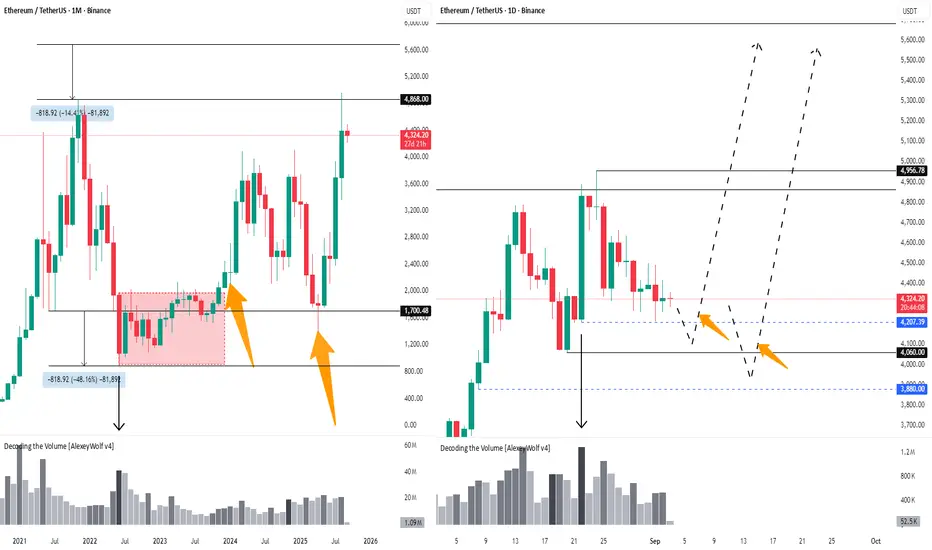
ETHUSDT. Where to Go Long and Where to Take ProfitsHi traders and investors!
This analysis is based on the Initiative Analysis concept (IA).
August has ended, and it’s time to look at the monthly charts. Let’s focus on Ethereum. The price is trading within the 1,700–4,868 range. The August candle touched the upper boundary of this range and we saw a pullback.
If we go back a bit to June 2022, we can see a strong seller candle that broke through the lower boundary of the range on high volume. After that came accumulation, and then the buyer absorbed the seller’s candle. That was the moment when investors could look for long entries with the goal of reaching the upper boundary of the range. The second good entry opportunity for investors came in April–May of this year, when the price retested 1,700.
So, where should we be looking for trades now? Let’s first identify where the price could go. To do this, we measure the price deviation downward from the 1,700 level and project it onto the upper boundary of the price range. I estimate the price could reach around 5,681.
Now it’s important to understand where we can find an entry. For this, let’s look at the daily chart.
On the daily timeframe, the price is also trading within the 4,060–4,956 range. There’s a strong buyer candle with high volume, but so far the buyer hasn’t been able to resume the move from it. That’s why I expect the price might dip below 4,207 and then head toward a new ATH. That’s the first scenario.
The second scenario is a dip below 4,060 into the 3,880–4,060 range, followed by a move to a new ATH. The target of about 5,700 was already defined on the monthly chart.
So, where should you enter? The entry comes after the price, in either of these scenarios, moves back above the broken level.
Wishing you profitable trades!
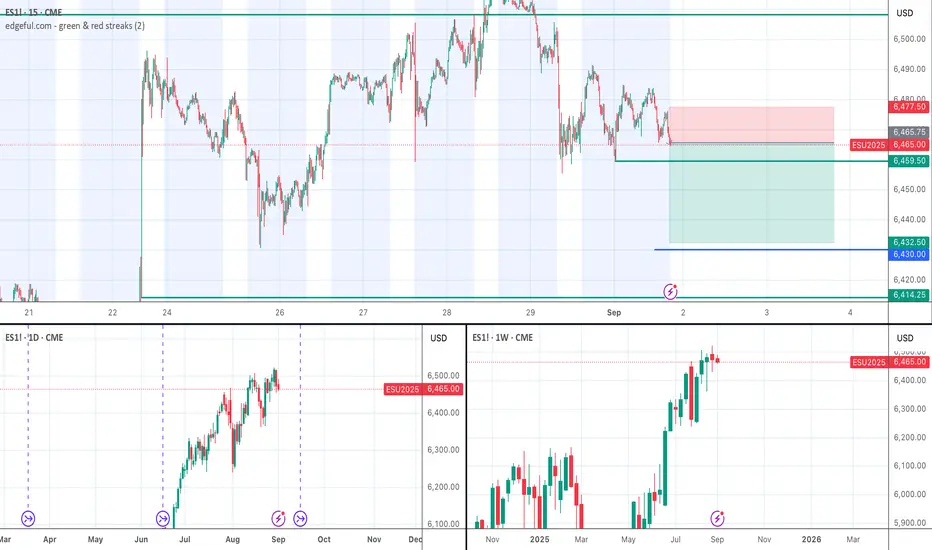
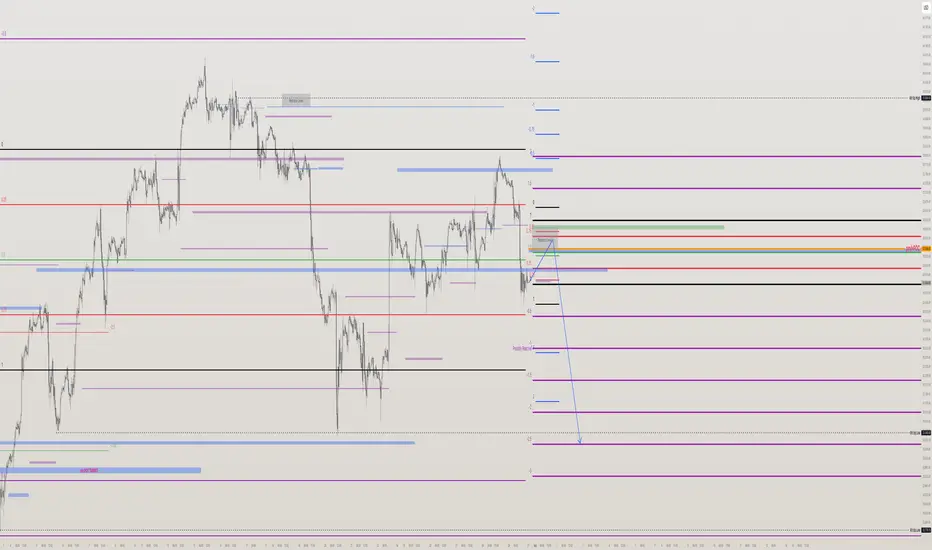
Short ES to Last Week's LowES is looking heavy with a steady decreasing Cumulative Volume Delta this evening. There is a 500 order block sitting at last week's lows just below 6430, so I'm thinking we head down to that level and test the support there.

EUR/USD Vol Profile Trading: Support Levels at 1.1664 & 1.1644On the EUR/USD 30-minute chart, it's nice to see two strong support levels: 1.1664 and 1.1644. At 1.1664, the market rejected lower prices with heavy volume, showing strong buyer activity. This is the peak volume zone in the cluster and also aligns with past heavy trading. The second support at 1.1644 comes from another heavy volume zone where buyers accumulated longs.

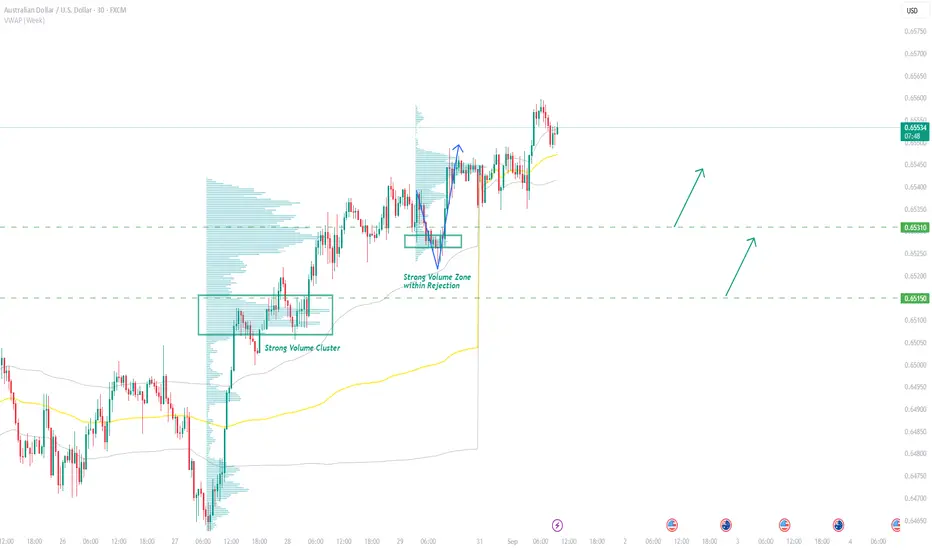
AUD/USD Trading Plan: Two Key Support Levels to Watch!On AUD/USD (30-min chart), two strong supports are in play. The first at 0.6531 comes from a heavy volume zone aligned with a Fair Value Gap, making it a high-probability long setup on a pullback. The second at 0.6515 is based on another volume cluster where buyers previously accumulated before driving price higher. Both levels show where buyers are likely to step in again to defend the uptrend.
USD/CAD Breakdown: Rejection at 1.3766 & Weak Low Liquidity GrabOn USD/CAD 30-min chart, price showed a strong rejection of higher levels as sellers stepped in hard. The key level is 1.3766, where a heavy volume cluster aligns with a bearish Fair Value Gap. If price pulls back here, sellers will likely defend the zone and push it lower. Also note the weak low—markets often test below such areas, making it a natural downside target.

Sep 1, 2025 - SOLUSDT 4H Chart Big Picture
At a broader look, the SOLUSDT chart is currently testing a major historical resistance at 203.36 — a level first seen back in 2021 and again in early 2024. This zone was finally broken toward the end of 2024, but the breakout lacked momentum, and after touching around $300, the price fell back below this level.
Now, Solana appears to be making another attempt to break through this ceiling, forming a very interesting structure. On the first retest, strong selling pressure was clear and pushed the price lower. However, it didn’t take long before price came back to the zone again — this time slightly pushing sell orders higher. Since then, each touch of this level has repeated the same story, gradually forming a triangle-like shape.
To measure the strength of buyers vs sellers in this zone, I analyzed the volume across each leg. What stood out was the rising volume on bullish legs, which suggests stronger buying pressure compared to selling.
Another important observation: while price is struggling to print significantly higher highs, it’s consistently forming higher lows — another clear sign of buy-side pressure.
This analysis provides a broader, medium-to-long-term perspective on SOLUSDT. In the next post, I’ll break down the entry triggers and target levels.

Bullish on EU for week 1-7/09 2025I have to targets lower that I want to see price reach and show willingness to turn bullish!
Price might even go higher than my target!
Bullish on Oil week 01-07/09 2025Will wait to see price reach and react from the previous month POC. That should be the play off the week. Bullish setups only. I the week starts going higher we should expect for this to reverse in the middle of the month.
NQ Prediction for week 1-7/09 2025After NQ reaches the reaction area above, we should wait and see if it's start rejecting it to start go lower. Overall bearish, so only bearish trades taken this week until proven wrong (see go higher from rejection)
KC | Massive Break Out Incoming | LONGKingsoft Cloud Holdings Ltd. provides cloud storage and cloud computation services. It offers cloud platform consisting of cloud infrastructure, cutting-edge cloud products and architected industry-specific solutions across public cloud, enterprise cloud and AIoT cloud services. The firm's products include computing, networking, storage & CDN, database, data analysis and security. It offers medical & healthcare solutions, supply chain finance solutions, e-government solutions, internet of vehicles solutions, media cloud solutions, big data education & training solutions, cloud integrated service and cloud gaming service. The company was founded in 2012 and is headquartered in Beijing, China.

JEF | Strong Move Incoming | Capital MarketsJefferies Financial Group, Inc. is a holding company, which engages in the provision of financial services. It operates through Investment Banking and Capital Markets, and Asset Management. The Investment Banking and Capital Markets segment involves the provision of underwriting and financial advisory services in the Americas, Europe and the Middle East, and Asia-Pacific. The Asset Management segment includes investing seed and additional strategic capital. The company was founded in 1968 and is headquartered in New York, NY.

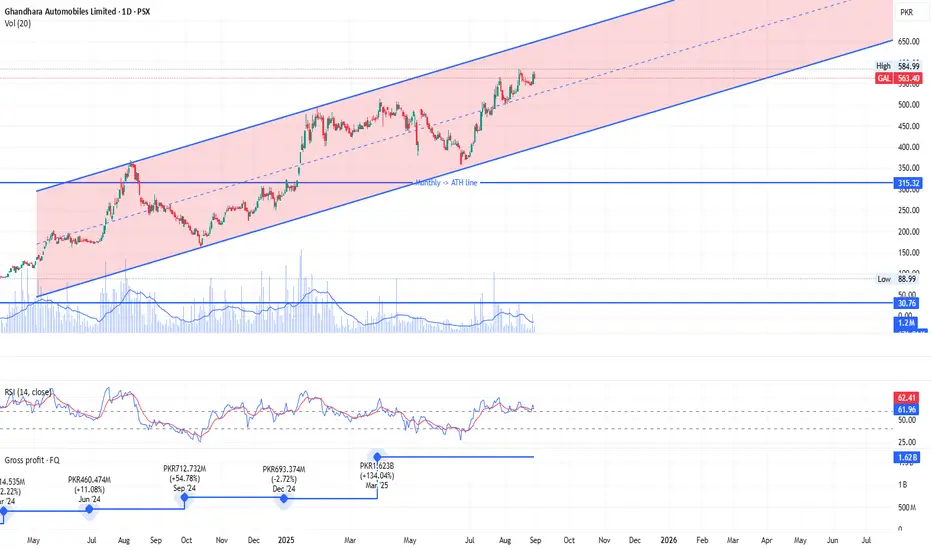
PSX: GAL - Daily TFGAL daily timeframe, moving in a channel
Great fundamentals turnaround - Sales of JAC T-9 Hunter.
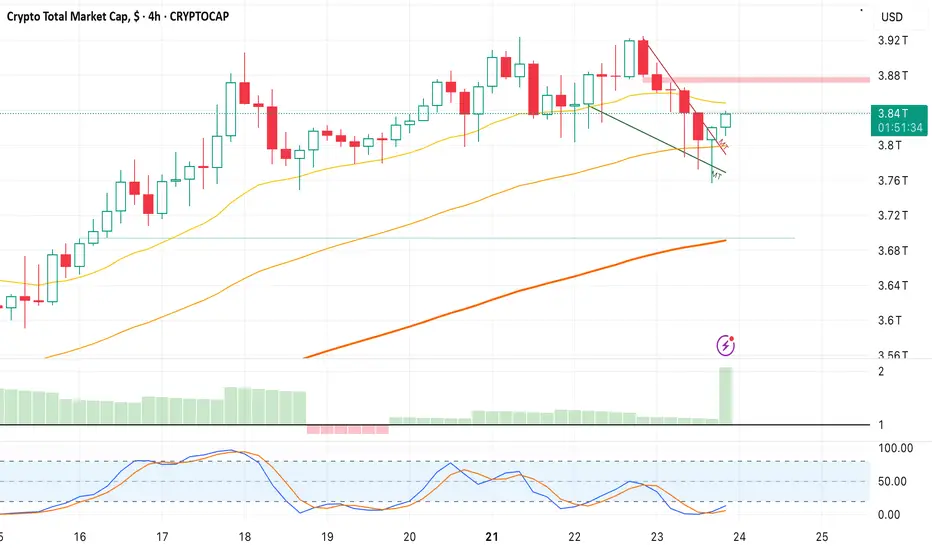
Bounce on Crypto Cap-Falling Wedge breakout at 3.836T, Target- 3.88 and 3.9.
-Looking for Bullish Crypto trading opportunities that align with this bias.
DDOG | Strong Momentum | LONGDatadog, Inc. engages in the development of a monitoring and analytics platform for developers, information technology operations teams and business users. Its platform integrates and automates infrastructure monitoring, application performance monitoring and log management to provide real-time observability of its customers' entire technology stack. The company was founded by Olivier Pomel and Alexis Le-Quoc on June 4, 2010 and is headquartered in New York, NY.

I'm bullish alt coinsThis is just one setup but I'm bullish on this sector
TP1 13.24
TP2 21
TP3 29
TP4 65