WLFI Is About to Explode or Collapse — Don’t Miss This Trigger!Yello Paradisers! Are you prepared for a potential sharp move on #WLFI, or are you still underestimating what’s quietly building behind the scenes? At first glance, this structure might seem like a simple and healthy pullback. But when we strip away emotions and analyse the chart objectively, a completely different narrative emerges. This is not random price action — this is a high-risk, high-opportunity zone where discipline matters far more than opinions.
💎#WLFI has just printed a classic sel
Wlfianalysis
EA Ready To "Spill The Tea"?!Price on OANDA:EURAUD has made a sharp decline after a rapid rally. With price currently trading just above the Support area, a familiar Bearish Reversal pattern begins to emerge, the Inverted Cup and Handle!
With an Inverted Cup and Handle pattern, after price forms the "Bowl" of the pattern and finds Support at the level that mustered the rally at the beginning of the pattern, we should expect a Retracement in price.
Typically a Pullback to the 38.2% level, but no further than 50% level, i
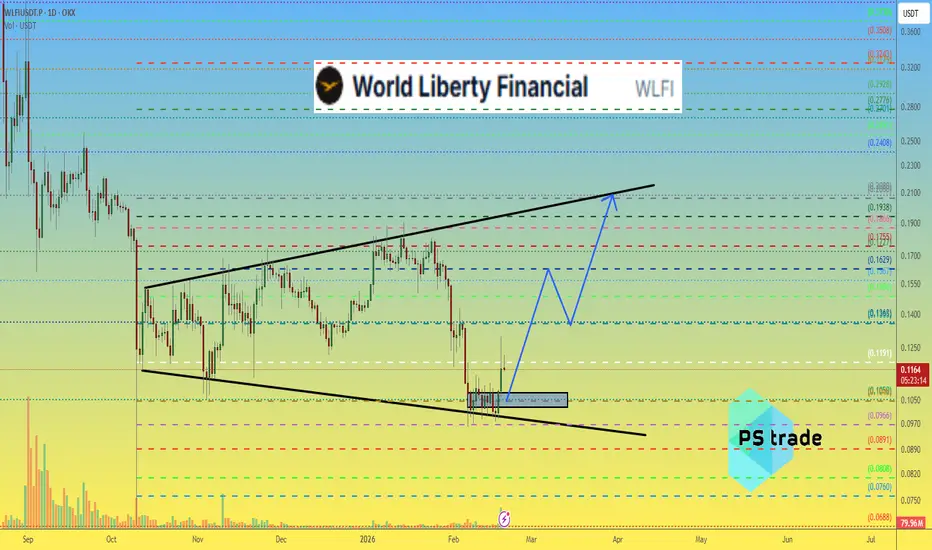
World Liberty Financial WLFI price analysis 5 months later since we publish $WLFI idea - levels worked out exactly as planned
Back then, we projected the key support, and price eventually dropped to $0.07, hitting the level with precision before bouncing.
This confirms one thing: technical levels on OKX:WLFIUSDT still matter.
📊 Current key zone:
If buyers manage to hold price above $0.1025–0.1075, this area could become a strong accumulation zone
🎯 Upside target:
Potential move toward $0.20–0.21, which represents nearly 2x f
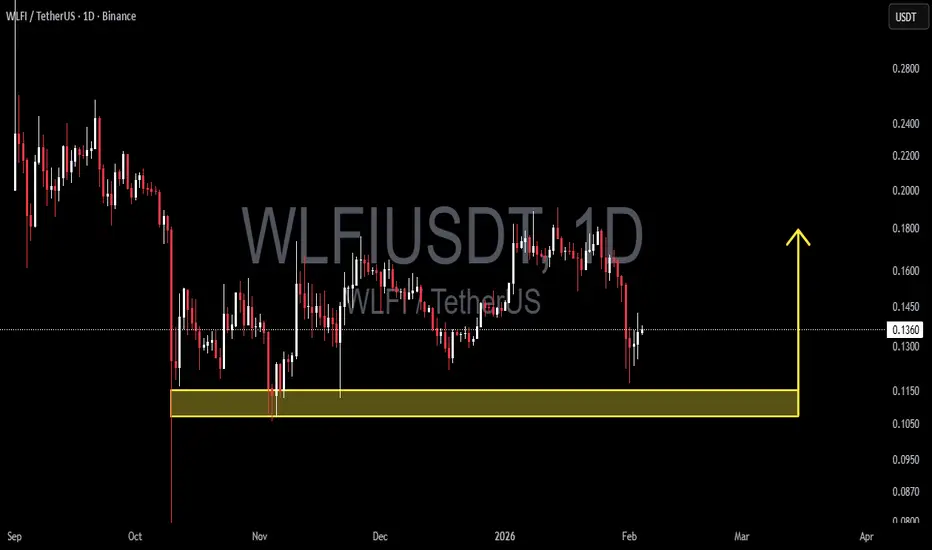
WLFI/USDT Near Accumulation Zone – Potential Reversal?WLFI/USDT on the Daily (1D) timeframe is still moving within a mid-term consolidation phase after experiencing strong selling pressure previously. The current price is trading around the 0.13 – 0.14 area, approaching a major demand zone highlighted by the yellow box at 0.115 – 0.107, which has repeatedly acted as a strong reaction area.
From a structural perspective, the market has not yet formed a valid uptrend and remains range-bound, with increasing volatility as price approaches the demand
Breaking: World Liberty Financial ($WLFI) Token Spike 19% The price of World Liberty Financial ($WLFI) Spike 19% Albeit market turmoil. This week was short of surprise for many as CRYPTOCAP:BTC tanked to the $80k resistant zone with other altcoins following suit.
As per the 4-hour price chart, the asset is in a bullish flag pattern with possible retracement to the $0.13 support point before picking liquidity up.
About World Liberty Financial
USD1 Stablecoin: A fully reserved, dollar-pegged stablecoin deployed across Ethereum, BNB Chain, Solana, a
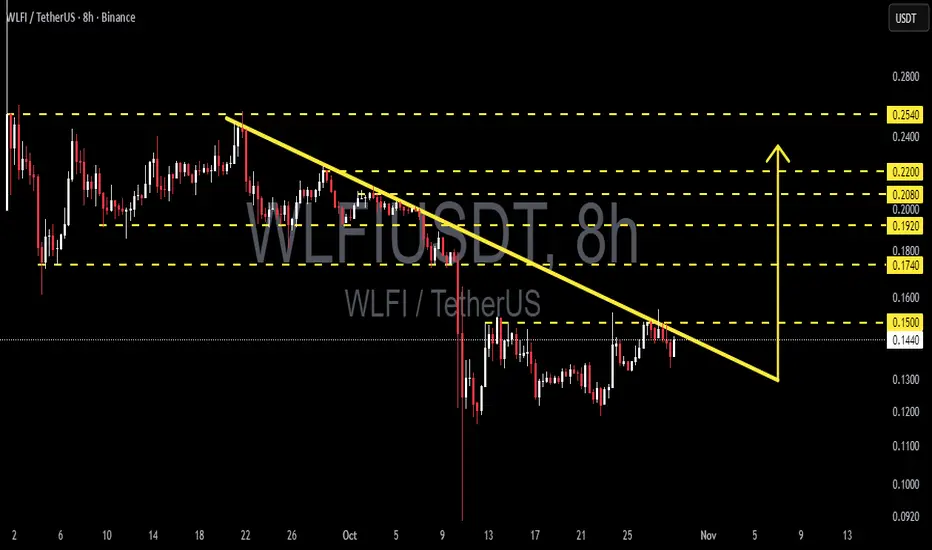
WLFI/USDT — Ready to Explode from Final Consolidation Zone?After weeks of staying under heavy selling pressure within a descending trendline, WLFI is finally showing early signs of life around the 0.13–0.14 demand zone.
The current structure indicates a phase of capitulation followed by silent accumulation, where sellers are losing strength while smart money gradually steps in.
A clear series of lower highs has formed since early October, pressing the price down under a strong descending resistance line (yellow) — and now, price is testing that barrier
WLFI/USDT — Ascending Triangle Pressing: Major Breakout?📊 Full Analysis
The WLFI/USDT pair on the 4-hour timeframe is forming a clear Ascending Triangle pattern:
A strong horizontal resistance around 0.2410, repeatedly tested but not yet broken.
Higher Lows along the ascending trendline (yellow) show growing buyer strength and continuous accumulation.
This structure is a classic bullish continuation pattern, signaling that the market is building momentum for a potential breakout.
Still, crypto markets are never one-sided. Failure to break highe
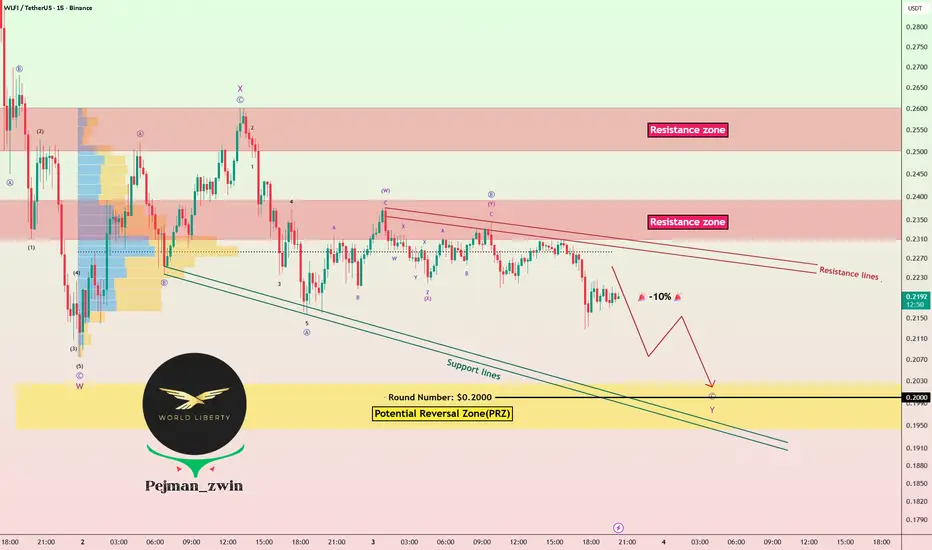
WLFI Token Faces Key PRZ – Will the Downtrend End Soon?The World Liberty Financial project with the WLFI token ( BINANCE:WLFIUSDT ) continued its downtrend as I expected in yesterday's idea .
The question is, when will this downtrend of the WLFI token end?
The WLFI token is currently moving near the Potential Reversal Zone(PRZ) , Cumulative Long Liquidation Leverage($0.1576-$0.1500) , and the round number of $1,500 .
In terms of Elliott wave theory , the WLFI token seems to be completing the main wave 3 . The main wave 3 could c
WLFI Faces -10% Risk! Will PRZ Trigger a Strong Reversal?Today, I’m going to analyze World Liberty Financial ( BINANCE:WLFIUSDT ) from a fundamental and technical perspective .
WLFI is the governance token (non-equity) with a 5% per-wallet voting cap.
USD1 is a fully backed U.S. dollar stablecoin (T-Bills + cash).
Total WLFI supply is 100B, with ~24.6B circulating at launch (TGE).
A large share of economic benefits (75% of net revenues) goes to a Trump-affiliated entity, raising concentration and political/regulatory risk.
Key partnership :
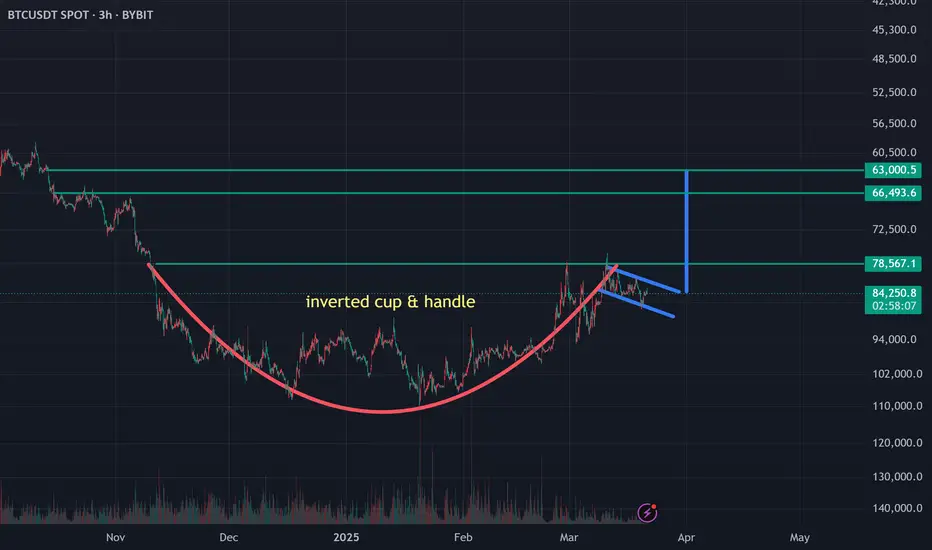
Bitcoin Inverted Cup & handle Bitcoin is forming an inverted Cup & handle pattern with a target of 63k-66k. I was surprised to see this when I inverted the chart. Just sharing with you what I see, and I hope the pattern changes and we continue to go up. However the highest probability at the moment is further downside, but we may still have a bounce toward 89k-91K before seeing the blood.
AGIX coming down in the short term 15 time frameAGIX is about to make its decent to the down side, first stop 0.3050, Inverted adam and eve also invert cup and handle, happy trading
AShort
$SPY $SPX $ES1! Massive Inverted Cup and Handle & Bear Flag?? 🤔AMEX:SPY SP:SPX CME_MINI:ES1! Analysis, Key Levels & Targets
One day at a time, right… BUT doesn’t this look like a MASSIVE INVERTED CUP AND HANDLE + A BEAR FLAD… sorry for yelling but YIKES!!!
Not to mention the MASSIVE Divergence going back to when the market should have corrected prior to intervention….
Stay alert, y’all… there will be rallies, but there will be DROPS as well 😅
BITCOIN : Btc/usdt Inverted Cup shape BINANCE:BTCUSDT
Hi , Trader's as per my analysis , inverted Cup shape chart pattern forming Which indicate
Bearish reversal pattern , if this is the case than market could fall to 20k area again
There is significant profit booking at area of 28K buyer's exit there long position's
400m$ long position's exited till now from 28k area , which indicate's powerful reversal
Maximum 30k will be the target for btc .
Market need's to break 30k and candle of 4hr or daily closes above that point
Overhyped Defense Stock Trading at over 670x EPSWe have another Overhyped Defense Stock trading well above EPS ; This time trading well over 600 times earnings while the price is breaking below trend. It could be argued that we have an Inverted Cup with Handle at the Highs and if 46 Breaks we could quickly come down to $18 a Share but due to how high the PE is i wouldn't even be against targeting the 1.618 Extension all the way down at 72 Cents.
BTCUSDT | Wave Analysis | Mega Bull Flag Formation +80%Price action and chart pattern trading
> A possible downtrend continuation for C-leg with the current bearish PENNANT pattern
> The downtrend TP @ 1.618 extension zone at 13K USD price - same target with the previous bearish INVERTED CUP pattern
> An upcoming mega bull flag formation with target reversal +80% upside @ 28K USD price.
> Close short position once a divergence signal presented.
Always trade with affordable risk and respect your stoploss!
Inverted Cup and handle pattern in XAUUSDGold against the Dollar have been sideways since September I st, 2022 , traded between 1700 to 1726 for almost a month for almost half of the month, Stronger CPI data on Tuesday affect the gold market by making the Dollar strong,
Bearish momentum has supported by Inverted Cup and handles pattern ,
Market sentiment on Gold also mostly bearish, it can be understood from the following statement
Société Générale sees gold prices falling to $1,550 in 2023 and recovering to $1,900 by 2024
Standard Chartered Short IdeaSTAN on the daily chart has put in a double top.
An inverted cup with handle pattern is forming down towards the 200 EMA.
Once price closes below the 200 EMA I will be looking for a short position. Around £5.40
Measured move (Size of Cup) will be my first profit target at £4.32 which is also an historical support level.
Stop initially at top of handle around £5.96.
Deja Vu Tooin 2021, I noticed some patterns on both the BTC chart and the QQQ chart.
Now these patterns are happening again on both charts.
Last time, they didn't confirm. The market bounced back up.
It bounced in mid-Oct 2021 - when the fourth stimulus check hit people's banks while a ton of extra unemployment benefits were given to people.
I'd say it was a coincidence, but I don't believe in those.
One possible explanation was that the fourth check and benefits went into the market (just like a lot
Will We "Affirm" A New Direction This WeekWill We “Affirm” ( NASDAQ:AFRM ) A New Direction This Week?
I strongly believe that a new direction will be affirmed for Affirm Holdings, Inc. (AFRM) this week. I've identified several reasons why I anticipate a new direction for the stock.
Bullish divergence on the daily chart.
AFRM is in the buy zone.
AFRM is in a range on the daily chart.
Outcome Expected- Break from range through the upper channel
*Identified risks-
-It will be very important to watch price action because the sto
"Is NIO Emptying The Cup?"NYSE:NIO
www.tradingview.com
Is NIO Emptying The Cup?
Please drink water my fellow traders because we all need to stay hydrated. Summer time will be here before you know it. Therefore, I encourage you to increase your water intake.
On another note, NIO developed an inverted cup and handle pattern on the daily chart. My question to the trading community is quite simple. Is NIO emptying the cup? I have my cup and am ready to catch the water in case it..."pours". If it does I will "hydrate"!