#WOO MACRO BREAKOUT CONFIRMED – PAY CLOSE ATTENTION! 🔥 #WOO MACRO BREAKOUT CONFIRMED – PAY CLOSE ATTENTION! 🚀📈
CRYPTOCAP:WOO (WOO Network/USDT) has officially broken out of its multi-year descending resistance trendline on the 1W timeframe! After a prolonged accumulation phase near macro bottom levels, price has pushed cleanly past the trendline, signaling a major structural trend reversal.
Holding above this converted diagonal support line opens the door for a massive expansion rally toward multi-month horizontal targets! 🎯
📊 Technical Snaps
WOO
WOO / WOOUSDT Bullish Setup | Futures Trade IdeaMARKET ANALYSIS
WOO is currently reacting from a key technical area highlighted on the chart.
As long as the protected support zone remains intact, the bullish market structure remains valid and higher liquidity targets may continue to attract price action.
A breakdown below the invalidation level would weaken the current bullish scenario and require a reassessment of market conditions.
📍 Entry, Stop Loss and Take Profit levels are marked directly on the chart.
━━━━━━━━━━━━━━
⚠️ DISCLA
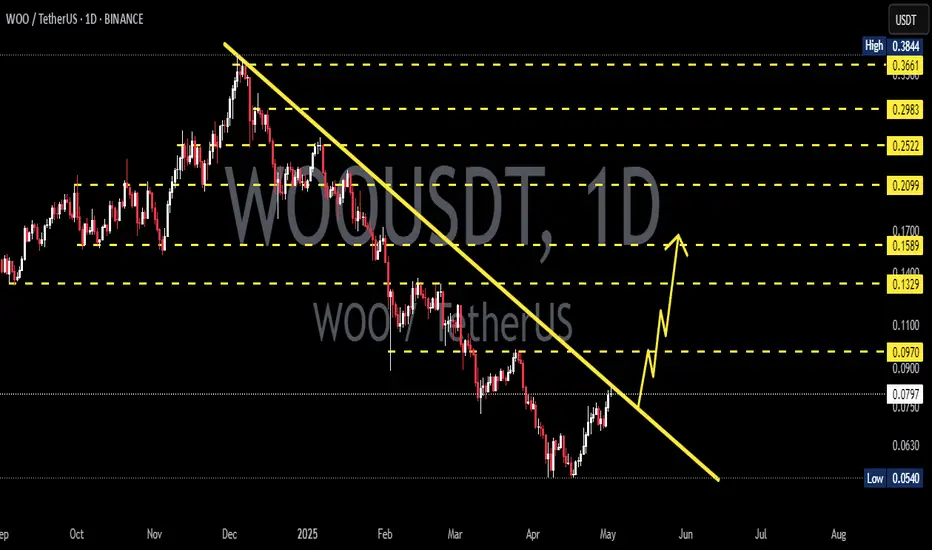
WOO Descending Trendline, Reversal or Another Rejection?The chart shows that WOO remains within a long-term bearish structure, with price trading below a Descending Trendline that has been forming since the major high around $0.38. However, the current price is approaching an important area around the trendline, making a potential breakout or rejection increasingly important to watch.
---
📐 Pattern: Descending Trendline
🔻 A Descending Trendline forms when price consistently creates Lower Highs (LH) and remains below a declining resistance line.
O
WOO / WOOUSDT Bullish Setup | Futures Trade IdeaMARKET ANALYSIS
WOO is currently reacting from a key technical area highlighted on the chart.
As long as the protected support zone remains intact, the bullish market structure remains valid and higher liquidity targets may continue to attract price action.
A breakdown below the invalidation level would weaken the current bullish scenario and require a reassessment of market conditions.
📍 Entry, Stop Loss and Take Profit levels are marked directly on the chart.
━━━━━━━━━━━━━━
⚠️ DISCLA
WOO / WOOUSDT Long Setup | Breaker Block ReclaimMARKET ANALYSIS
WOO is currently reacting from a key technical area highlighted on the chart.
As long as the protected support zone remains intact, the bullish market structure remains valid and higher liquidity targets may continue to attract price action.
A breakdown below the invalidation level would weaken the current bullish scenario and require a reassessment of market conditions.
📍 Entry, Stop Loss and Take Profit levels are marked directly on the chart.
━━━━━━━━━━━━━━
⚠️ DISCLA
WOO / WOOUSDT Long Setup | Breaker Block ReclaimSOMI / SOMIUSDT Bullish Setup | Futures Trade Idea
SOMI / SOMIUSDT Long Setup | Breaker Block Reclaim
MARKET ANALYSIS
WOO is currently reacting from a key technical area highlighted on the chart.
As long as the protected support zone remains intact, the bullish market structure remains valid and higher liquidity targets may continue to attract price action.
A breakdown below the invalidation level would weaken the current bullish scenario and require a reassessment of market conditions.
WOO Buy/Long Setups (4H)The order blocks at the top of the chart have been consumed, and most sellers have lost a large portion of their orders.
Price has completed a strong CH and is currently trading around a key level. There is also a liquidity pool visible above the chart near the Swing High (SW H).
All of these signs indicate that if a pullback occurs, price could move back toward higher levels.
The targets are marked on the chart, but the main target is the red supply zone.
For risk control, a pullback is nee
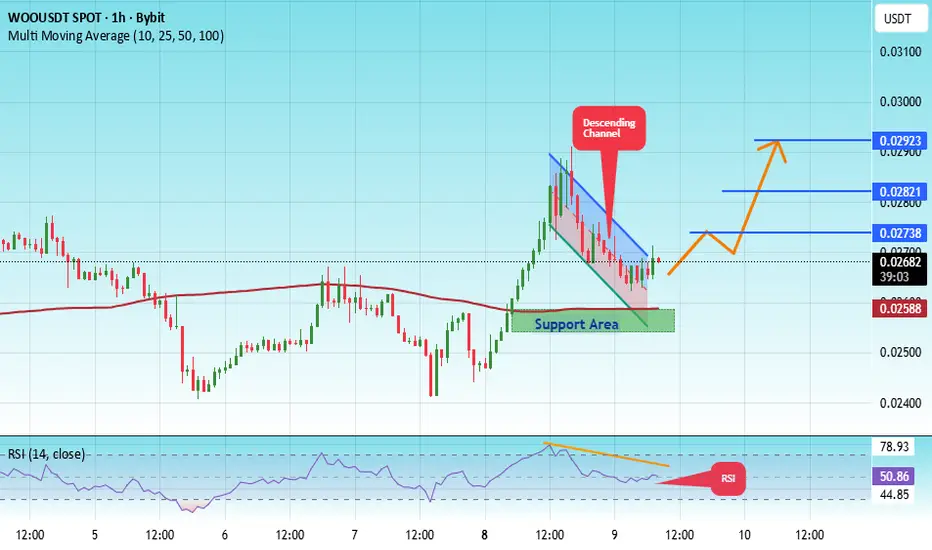
#WOO/USDT Ready for Breakout After Long Consolidation!#WOO
The price is moving in a descending channel on the 1-hour timeframe. It has reached the lower boundary and is heading towards breaking above it, with a retest of the upper boundary expected.
We have a downtrend on the RSI indicator, which has reached near the lower boundary, and an upward rebound is expected.
There is a key support zone in green at 0.02557. The price has bounced from this level multiple times and is expected to bounce again.
We have a trend towards consolidation above t
WOO Looks Bullish (2H)At the top of the chart, we have a large liquidity pool.
Currently, WOOUSDT has created conditions that, with an appropriate risk-to-reward ratio, may move toward the targets and sweep the liquidity pools.
We have a bullish CH and BOS on the chart, and the momentum is strong.
Remember, if you enter a position, stick to your stop-loss, as the risk-to-reward is only valuable if you respect it.
Touching the invalidation level will invalidate this analysis and signal.
Do not enter the position w
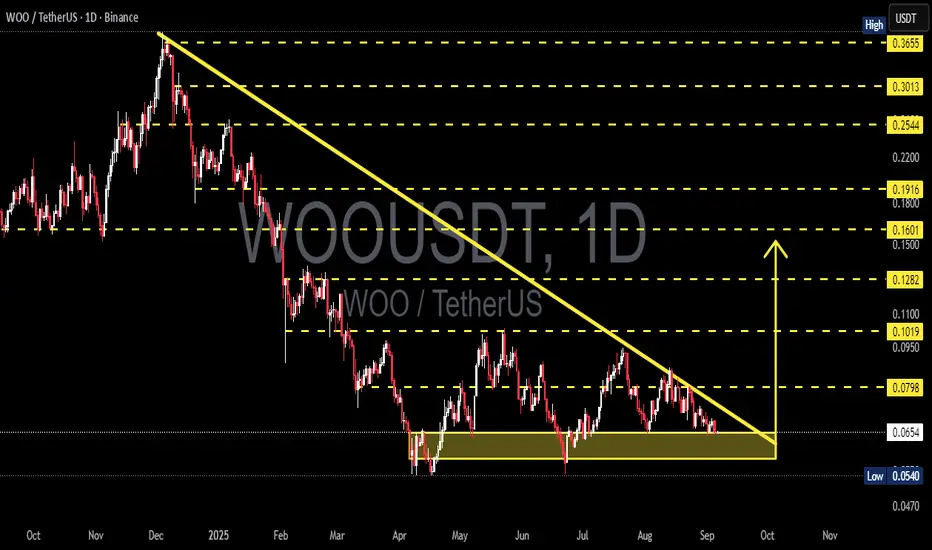
WOO/USDT – Descending Triangle Pressing Price at Key Zone!📌 Technical Overview
WOO/USDT is currently trapped inside a Descending Triangle on the daily timeframe. Sellers are consistently creating lower highs, while buyers are defending the critical support zone at 0.054–0.066.
This structure reflects the final stage of accumulation or distribution before the market makes a decisive move. With the triangle’s apex approaching (late September – early October), a major breakout or breakdown is likely imminent.
---
📊 Pattern Details
Main pattern: Descend
WOO/USDT Ready for Breakout After Long Consolidation!Chart Analysis (1D Time Frame):
This WOO/USDT chart shows a potential breakout setup after months of accumulation and downward pressure.
📉 Descending Trendline Resistance:
The price has been in a steady downtrend since December 2024, repeatedly rejecting from a descending resistance line.
🟨 Strong Accumulation & Support Zone (0.0540 – 0.0643 USDT):
A strong horizontal support zone has formed since April 2025. Price has bounced multiple times from this area, indicating growing buying pressure.
WOOUSDT at weekly support, eyeing for 0.25$Here is how I see WOOUSDT to play out.
The price is currently dipping into weekly support zone WS1.
It is likely that the price will bounce from here towards weekly resistance zone WR1.
In case the price reaches this weekly resistance zone WR1, it is likely to experience some pullback.
However, this pullback will be only to gather some momentum to break WR1 on the next attempt and move towards next weekly resistance WR2.
Other indicators are also looking healthy for this one, thereofore, it
WOO Buy/Long Setup (4H)The trigger line has been broken, we have a bullish CH, and a double bottom is also visible.
As long as the green zone holds, it can move toward the TPs. The targets are marked on the chart.
A daily candle closing below the invalidation level will invalidate this analysis.
For risk management, please don't forget stop loss and capital management
When we reach the first target, save some profit and then change the stop to entry
Comment if you have any questions
Thank You
Wootrade Network: Your Altcoin Choice (S5)The downtrend has been broken. When the downtrend is broken the bearish action ends. When the bearish action is over it is the start of the bullish cycle. Cycle implies long-term not only a bullish jump like we saw before. In late 2024, in late 2023 and so on, no! This time it will be different of course because the market takes time to grow big, to accumulate to prepare for the bull run phase in late 2025. We will have a mini bull run within 1-2 months.
So the downtrend is represented by the u
#WOO/USDT#WOO
The price is moving in a descending channel on the 1-hour frame and is adhering to it well and is heading to break it strongly upwards and retest it
We have a bounce from the lower limit of the descending channel, this support is at a price of 0.1200
We have a downtrend on the RSI indicator that is about to break and retest, which supports the rise
We have a trend to stabilize above the moving average 100
Entry price 0.1210
First target 0.1248
Second target 0.1290
Third target 0.1335
#WOO Getting Ready for a Major Breakout | Key Levels to WatchYello, Paradisers! Will #WOOUSDT finally break out of its descending channel, or are we heading for another drop? Let’s break it down #WOO:
💎#WOO has been trading within a descending channel on the 8-hour chart, showcasing a classic consolidation structure. Currently, the price is approaching a critical descending resistance, making this a pivotal moment for traders.
💎A break above the resistance at $0.3041 could confirm a bullish breakout which would set the stage for an extended rally. If bu
Woolish not yet well i am a fan of Woo and their team the way they have managed to bring all the things together is awesome but i may be biased but still think that box is yet to filled i may miss the bottom entry but my gut says that it will fill any ways if it don't i don't run this market flip the orange level and stay ther for a week or two and then lets go woolish
bitcoin is bullish so that may be a push ahead for sure
#WOO Ready for a Major Upward Move Or Not? Key Levels to WatchYello, Paradisers! Are #WOO bulls ready to maintain momentum above or not? Let's discuss the latest analysis of #WOO and see what's happening:
💎#WOO has recently broken above the resistance of its ascending channel, igniting bullish momentum and raising expectations for a potential rally toward higher price levels. However, the next move will depend heavily on the $0.34-0.37 supply zone, a critical barrier that traders must closely monitor.
💎If #WOO can decisively break above $0.34, it would c
WOOUSDT: Strong Bullish Breakout Signals Next Big Move!BINANCE:WOOUSDT has shown a strong bullish setup after a successful breakout from a falling wedge pattern, followed by an extended period of consolidation. This consolidation phase allowed the price to stabilize and gather momentum. Now BINANCE:WOOUSDT broke out of its consolidation box, indicating the start of a potential upward trend towards new highs. With strong volume supporting this breakout, the chart signals a bullish continuation. Traders should watch for key resistance levels and mo
$WOOUSDT Ready for Takeoff: Breaking Out of the Falling Wedge!BINANCE:WOOUSDT recently broke out from a falling wedge pattern and took a small retracement. It’s now starting to move upward again with strong volume behind it. Expecting significant jumps in the coming days as momentum builds! Keep an eye on key levels for potential entries.
GETTEX:WOO Currently trading at $0.186
Buy level: Above $0.185
Stop loss: Below $0.154
TP1: $0.22
TP2: $0.35
TP3: $0.5
TP4: $0.65
Max Leverage 3x
Follow Our Tradingview Account for More Technical Analysis Upda