Gold at a Critical Crossroads: Surge to $4700 or Drop to $3500?If the price breaks through the yellow zone, it could reach the red zone range. And if it doesn't cross the yellow zone, there's a chance it could head toward the 4700 range
Xauusdforex

GOLD ON SELL#XAUUSD price will continue bearish on 2 times breakout below 4058, we expect price to multiple break there before more dropping.
Entry 4058 2 times breakout, target 4022, stop loss 4075.
Price can sell from Market price also. The bullish depends on the cpi data release.

Gold Breakout Potential: Descending Wedge Signals Bullish ReversAnalysis:
The XAU/USD (Gold vs. USD) chart on the 45-minute timeframe shows price action forming a descending wedge pattern, a typically bullish reversal formation. The price has been compressing between lower highs and lower lows but is now testing the upper trendline resistance, indicating a possible breakout.
Key observations:
Trendline Breakout Zone: The narrowing wedge suggests weakening bearish momentum. A confirmed breakout above the trendline could trigger strong upward momentum.
Targets: The projected upside targets are around 4,300, 4,400, and 4,500, aligning with previous resistance zones.
Support Zone: Immediate support remains near 4,050–4,000, where the lower wedge boundary provides buying interest.
Momentum Indicator: Gradual bullish recovery and decreasing downside pressure indicate renewed buyer strength.
GoldXAUUSD
- Change of Characteristics
- Strong Bullish Trend Line
- Completed " 12345 " Impulsive Waves and " ABC " Corrective Waves
- Order Block
- RSI - Divergence

gold on short reverse#XAUUSD price have been trading between price correction and continuation, now we await for 2 times breakout above 4034 to sell.
2 times breakout at 4034 sell, target 3998, stop loss 4050.
Below the 3998 holds bullish reverse which will target 4070.

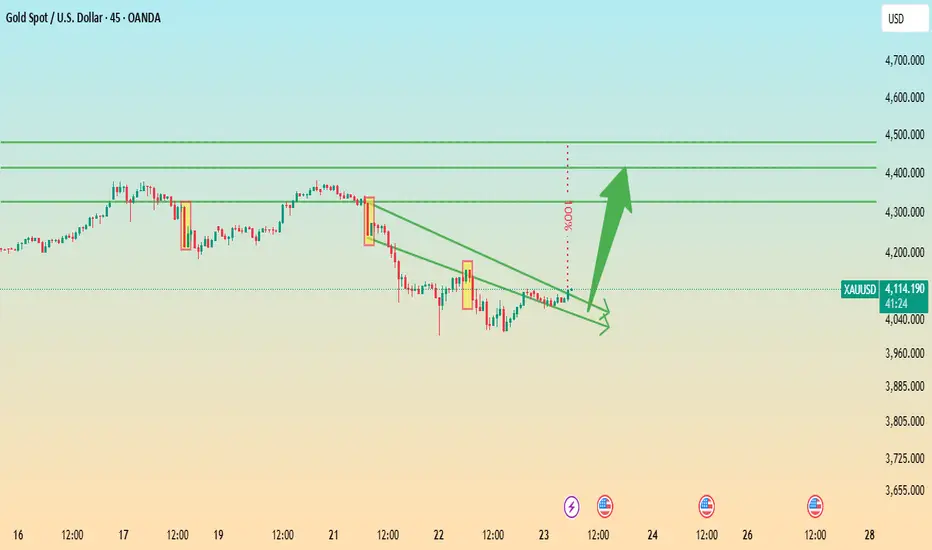
Gold (XAU/USD) Potential Bullish Reversal Setup – Entry Zone For**Analysis:**
The chart illustrates a possible bullish reversal scenario after a recent downward move in Gold (XAU/USD). The marked *Change of Character (ChoCH)* indicates an early sign of a trend shift from bearish to bullish momentum.
Price has entered a **consolidation zone** near the support area, where the **entry level** is highlighted. This zone suggests accumulation and potential preparation for an upward move.
The setup shows:
* **ENTRY:** Around current support, within the highlighted range.
* **STOP:** Below the recent low, providing risk control if the reversal fails.
* **TARGET:** The projection points to a **100% measured move**, aligning with a strong bullish continuation potential toward 4,700 levels.
If price maintains structure and confirms a breakout above the short-term resistance, it may initiate a new **bullish impulse phase**.

gold on reverse#XAUUSD we wait price on M15 closure above 4265 to buy.
Entry 4265 M15 closure short target 4278, second target 4302 and last 4320. Stop loss 4250
Below the 4246 on one time breakout will drop the pair till 4206 limit.
4278 holds reverse but breakout above 4283 will continue bullish.

gold on buying#XAUUSD price have formed a double range below 4256-4259. Now we wait for breakout below the 4259 to buy on 2 times breakout.
Target 4315, stop loss below the 4249.
Below the 4249-47 holds bearish continuation which will reach 4190.

gold on buy before sell#XAUUSD price still moving uptrend, now price needs to break 4283 for little correction on sell.
Buy limit on 2 times breakout 4250,target 4283, stop loss 4235.
Below the rectangle 4233-4230 holds bearish confirmation.

Gold Maintains Upward Channel Toward $4320 TargetAnalysis:
The XAU/USD 45-minute chart shows gold continuing its steady rise within a well-defined ascending channel. The price action maintains higher highs and higher lows, confirming a sustained bullish trend.
Currently, gold is testing the midline of the channel, suggesting a possible minor pullback before resuming upward momentum toward the projected resistance near $4320. This level aligns with the upper boundary of the channel, acting as the next potential target zone for buyers.
As long as the price remains above the lower channel support, the bullish structure remains intact. A breakout above $4320 could open further upside potential, while a drop below the channel could signal early weakness or short-term consolidation.

gold on sell#XAUUSD price await for correction below the 4059 limit. We wait for 2 entries on 2 times breakout before selling.
4200 holds confirmation on sell, target 4151-4059, stop loss 4217.
Below 4186-4180 holds strong confirmation on 2 times breakout, target 4059.
Above 4217 on H1 close above there will continue bullish.

gold on sideway until breakout#XAUUSD We await for price breakout between the two entry.
Firstly breakout below 4090 on 2 times breakout, will drop the price till 4025, stop loss at 4108.
Above 4135 on 2 times breakout will go bullish till 4195.
We await for breakout before trading.

GoldXAUUSD
- Break of Structure
- Supply Zone
- Bullish Channel as an corrective pattern in Short Time Frame
- RSI - Divergence
- Completed " 1234 " Impulsive Waves

Gold Eyes New Highs Within Ascending ChannelAnalysis:
The XAU/USD 1-hour chart shows gold trading firmly within an ascending parallel channel, maintaining a clear pattern of higher highs and higher lows — a hallmark of sustained bullish momentum.
Currently, price action is consolidating near the mid-level of the channel, preparing for a potential breakout toward the upper boundary near $4,110–$4,120. The projected path (blue arrows) suggests a minor retracement or sideways move before buyers push prices higher again.
As long as gold remains above the lower channel support around $4,000–$3,990, the bullish outlook stays intact. A confirmed breakout above the upper boundary could open the door for a new leg upward, supported by ongoing momentum and strong market sentiment.
Key Levels:
Resistance: $4,110 – $4,120
Support: $3,990 – $4,000
Trend Bias: Bullish within ascending channel

Gold: Continue its rally to reach an all-time highGold has successfully stood firm above the key psychological level of 4000, continuing its rally to reach an all-time high. From the perspective of capital flows, although specific position data is lacking, the price-volume surge following the breakthrough,evidenced by both New York Gold and London Gold recording "rising prices with increasing trading volume" that confirms the continuous inflow of safe-haven funds. Additionally, the seasonal upward momentum of gold in October has not yet faded, and the momentum-driven uptrend continues, further strengthening the confidence of bullish investors.
The 4000-4050 range has been effectively broken through, and this former resistance level has now transformed into a short-term support level. If gold can maintain a stable position above 4050 in the subsequent sessions, the next target range can be set at 4100-4150. For short-term support, focus on the key psychological level of 4000; a breakdown below this level may trigger a pullback to the 3950-3980 range.
Buy 4010 - 4020 TP 4030 - 4040 - 4050
Daily-updated accurate signals are at your disposal. If you run into any problems while trading, these signals serve as a reliable reference—don’t hesitate to use them! I truly hope they bring you significant assistance

gold on sideways untill limit breakout#XAUUSD price have rebound above 3977, now we expect and wait for M15 closure breakout before we can buy or sell.
Below the 3950 limit on M15 closure, price will continue bearish till the 3909, stop loss 3961.
Above 3967-3971 on M15-M30 closure price will move on buy till the 3991 limit.

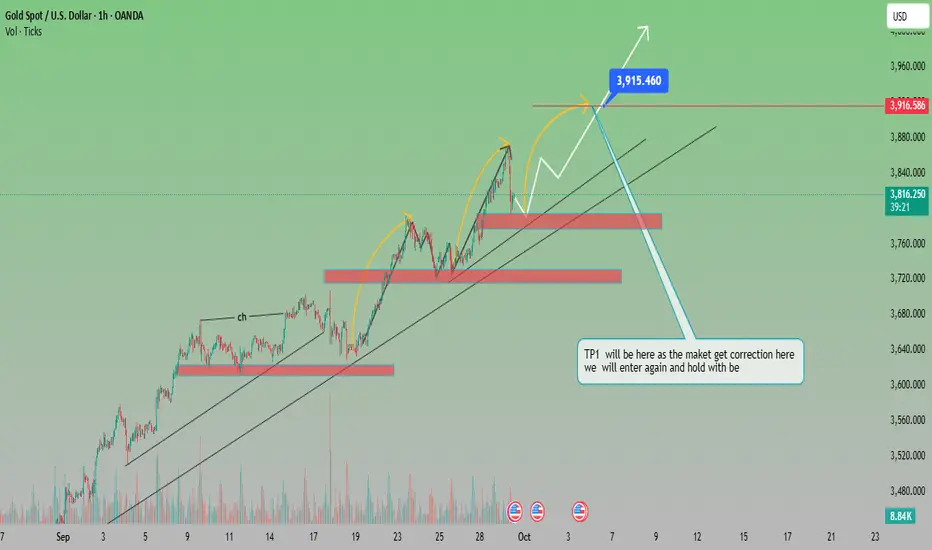
“Gold Price Action: Bullish Momentum with Key Correction Zones
Analysis of XAU/USD (Gold Spot)
The chart shows a clear uptrend channel, supported by higher highs and higher lows.
Price recently pulled back after testing the $3,915 zone, which is acting as a short-term resistance.
Multiple support zones are highlighted (around $3,760 and $3,700), which can provide strong buying opportunities on retracement.
The structure suggests impulse–correction–impulse movement, aligning with bullish continuation patterns.
Bullish Scenario
If price holds above the $3,760–$3,780 support, continuation towards $3,915 (previous high) is expected.
A breakout above $3,915–$3,920 will open the door for further upside, targeting $3,960–$3,980.
Bearish Scenario
If price breaks below the trendline support (~$3,760), deeper correction is possible toward $3,680–$3,640 (TP1 zone).
That zone is mentioned on the chart as a strong re-entry point for long positions.
✅ Suitable Target (Bullish):
Immediate Target: $3,915 (previous high)
Extended Target: $3,960 – $3,980
⚠️ Correction Target (Bearish Pullback):
$3,680 – $3,640 (strong buy zone for re-entry)
Gold Maintains Bullish Momentum Above Uptrend SupportAnalysis:
The 1-hour chart of XAU/USD shows a strong upward trendline, which has been consistently respected by price action. After a clear bullish momentum breakout around September 25th, gold has continued to post higher lows, confirming buyers’ control of the market.
Currently, gold is trading at $3,878, consolidating just below the $3,924–$3,935 resistance zone. The chart suggests two possible scenarios:
Continuation: If the price respects the upward trendline and breaks above the $3,924–$3,935 resistance, gold could aim for new highs, extending the bullish run.
Short-Term Pullback: A minor correction to retest the trendline is possible, but as long as the trendline holds, the bullish structure remains intact.
Technical Outlook:
Support: $3,855 / $3,785
Resistance: $3,924 – $3,935
Trend: Strongly bullish, supported by ascending trendline
Bias: Buy on dips towards the trendline, targeting a breakout above $3,935

gold sideways#XAUUSD await 2 times breakout above 3893 to buy, target above 3910, stop loss at 3883.
Below the 3883 holds short bearish move, which will drop till 3876-3870.

XAU/USD – Bullish Trendline Support Targeting 3,910–3,950Analysis:
The chart for XAU/USD (Gold Spot vs. U.S. Dollar) on the 1-hour timeframe shows a clear upward trajectory supported by a strong ascending trendline.
Support Trendline: Price recently retested the rising support line, confirming buyers are still defending this level.
Short-Term Pullback: After a sharp drop from the recent high around 3,820–3,830, price has stabilized near the trendline, signaling healthy retracement within a bullish structure.
Bullish Scenarios:
If price respects the support line, a rebound towards 3,870 and then 3,910 levels is expected.
A successful break above 3,910 may open the door toward the next resistance near 3,950.
Risk Factor: A sustained break below the support trendline would invalidate the bullish scenario, potentially dragging the price back towards 3,790 or lower.
Conclusion: Gold remains in a bullish trend as long as it holds above the support line. Traders may look for buying opportunities on dips, targeting 3,870 → 3,910 → 3,950 in the short term.

gold selling from 3858.5#XAUUSD price have rejected following today drop below 3793, now price is trading at 3848, we await for breakout above 3858.5 to sell, target 3778, stop loss 3871.8 today high.
Any possibility of breakout above today high then we see a new high above 3876-3888 to sell.

XAU/USD – Bullish Trendline Support Targeting 3,910–3,950Analysis:
The chart for XAU/USD (Gold Spot vs. U.S. Dollar) on the 1-hour timeframe shows a clear upward trajectory supported by a strong ascending trendline.
Support Trendline: Price recently retested the rising support line, confirming buyers are still defending this level.
Short-Term Pullback: After a sharp drop from the recent high around 3,820–3,830, price has stabilized near the trendline, signaling healthy retracement within a bullish structure.
Bullish Scenarios:
If price respects the support line, a rebound towards 3,870 and then 3,910 levels is expected.
A successful break above 3,910 may open the door toward the next resistance near 3,950.
Risk Factor: A sustained break below the support trendline would invalidate the bullish scenario, potentially dragging the price back towards 3,790 or lower.
Conclusion: Gold remains in a bullish trend as long as it holds above the support line. Traders may look for buying opportunities on dips, targeting 3,870 → 3,910 → 3,950 in the short term.

The Unstoppable Rise of Gold**Technical Analysis (XAU/USD):**
Gold is trading around **$3,816**, showing continued bullish strength along the upward trend line. Price has respected higher lows, confirming buyers remain in control. Key short-term support levels are visible at **$3,797**, **$3,759**, and **$3,718**. As long as price stays above the **$3,718 zone** (major support), the bullish structure remains intact.
The chart indicates two bullish scenarios:
1. A direct continuation higher from current levels.
2. A potential retest of the **$3,797 – $3,759 zone** before another push upward.
Upside targets in the coming sessions stand between **$3,860 – $3,900**, with further momentum potentially extending beyond **$3,925**.
**Fundamental Analysis:**
* **Safe-Haven Demand:** Persistent geopolitical uncertainties and global economic slowdown fears are keeping gold attractive as a safe-haven asset.
* **Central Bank Policies:** If the Fed maintains a dovish stance or signals rate cuts, real yields may decline, further boosting gold.
* **Inflation Hedge:** Despite cooling in some regions, sticky inflation supports long-term gold demand.
* **Central Bank Purchases:** Record gold buying by global central banks continues to provide a solid floor under prices.
**Conclusion:**
Gold remains in a strong bullish phase, with technicals showing steady upward momentum and fundamentals reinforcing demand. Any dips toward **$3,759–$3,718** may offer buying opportunities as long as the trendline holds, while the broader outlook points toward further gains.
