Is This the Start of the Next Natural Gas Upswing?💨 Natural Gas (XNG/USD) — “Profit Pathway Setup” 🎯 Swing / Day Trade Edition
📊 Market Overview:
The Energies Market is heating up — and Natural Gas is showing its next potential boom move! After a confirmed Moving Average Breakout, bulls are sneaking back in. 🕵️♂️
This setup blends discipline + creativity, using the Thief-Trader layered entry method — designed to catch price action efficiently while minimizing emotional errors. ⚙️
⚔️ Trade Plan (Bullish Setup):
Entry Zones (Layered Buys):
🟩 3.500
🟩 3.600
🟩 3.700
(You can expand your buy layers depending on your own comfort and risk plan.)
Stop-Loss (Thief SL):
🧯 3.350 — just below the nearest lower-low candle wick.
💬 Dear Ladies & Gentlemen (Thief OG’s) — this SL is a personal style choice, not a fixed rule. Manage your risk your way.
Target (Profit Escape Zone):
🎯 4.100 — a strong resistance + overbought + trap + distribution zone.
💬 Reminder: I’m not forcing my TP; you’re the boss of your own bag — make your profits, then take them! 💰
📈 Why This Setup Works:
🧠 Technical Confirmation: MA breakout = bullish continuation in progress.
🎯 Layering Strategy: Multiple limit orders reduce average cost + improve flexibility.
🏗️ Structural Setup: Clear accumulation → breakout → markup pattern emerging.
🧩 Exit Logic: Resistance + trap-zone = high-probability exit zone for profit capture.
🌍 Related Assets to Watch (Correlation Check):
💹 NYMEX:NG1! — Natural Gas futures benchmark, strong global mirror.
AMEX:UNG — U.S. NatGas ETF; sentiment confirmation.
🛢️ BLACKBULL:WTI / BLACKBULL:BRENT — closely tied to energy flow; when oil strengthens, gas often follows.
⚡ TVC:DXY — dollar strength can inversely impact commodity demand.
💵 FX:EURUSD — macro correlation to risk appetite across energy & FX.
Keep eyes on these pairs — their momentum helps confirm or contradict your NatGas bias. 👀
📌 Key Takeaways:
✅ Trend Bias: Bullish
💪 Setup Type: Swing / Day Trade hybrid
🧮 Risk : Reward: Favorable above 1 : 3
⏳ Holding Window: Short-term → Mid-term (2 – 5 days typical)
🧭 Trade Management: Stick to your plan — don’t chase, layer smart.
⚠️ Pro Tip:
If price breaks below 3.350, it’s a signal to step aside — no hero moves. 🛑
Price structure > emotions. Stay patient, and let the plan do the heavy lifting. 🧘♂️
✨ “If you find value in my analysis, a 👍 and 🚀 boost is much appreciated — it helps me share more setups with the community!”
#NaturalGas #XNGUSD #EnergyTrading #SwingTrading #DayTrading #TechnicalAnalysis #BreakoutStrategy #CommodityTrading #ForexTrading #TradingIdeas #RiskManagement #MarketAnalysis #EnergyMarkets #TradingView #ChartAnalysis
Xngusdbuy

Is This the Start of a Fresh Bull Run in Natural Gas (XNG/USD)?🎯 XNG/USD Natural Gas: The Great Energy Heist! 💰⛽
📊 Market Overview
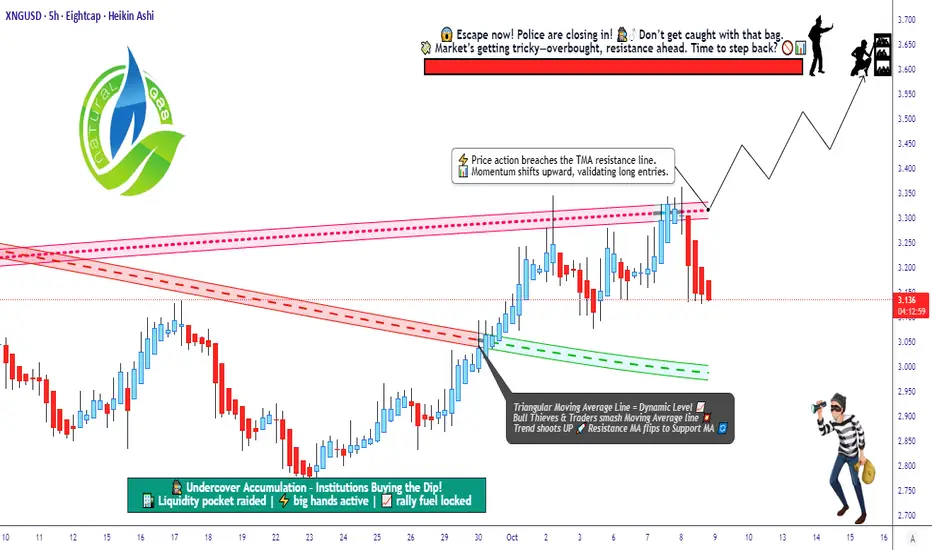
Natural Gas is setting up for a classic "Ocean's Eleven" style breakout! The 382 Triangular Moving Average has been breached by the bulls, and the trend confirmation is IN. Time to plan our strategic entry into this energy market opportunity!
🔥 The Master Plan: BULLISH Setup
Strategy Type: Swing/Day Trade - Cash Flow Management
Confirmation Signal: 382 Triangular Moving Average breached to the upside ✅
Entry Method: Buy the dip when TMA confirms the bullish trend
💎 Layered Entry Strategy (Scale In Like a Pro!)
⚠️ IMPORTANT: You can enter at ANY price level after the breakout confirmation! Set alerts on your trading platform to catch the breakout easily.
Recommended Entry Layers:
🎯 Layer 1: $3.100
🎯 Layer 2: $3.150
🎯 Layer 3: $3.200
🎯 Layer 4: $3.250
🎯 Layer 5: $3.300
This layering approach helps average your entry and reduces risk!
🛡️ Risk Management Zone
Stop Loss: $3.000
⚠️ Disclaimer: This is MY stop loss level based on my risk tolerance. YOU should determine your own stop loss based on YOUR risk management rules and account size. Trade at your own risk!
🎪 Target Zone: The Great Escape!
Primary Target: $3.600 🚀
Why $3.600? This level acts as:
🚧 Strong resistance (Police barricade zone!)
📉 Oversold bounce area
Potential bull trap zone
Exit Strategy: Lock in profits BEFORE reaching the target zone. Secure your gains and don't get greedy!
⚠️ Disclaimer: This is MY target based on my analysis. YOU should take profits at levels that match YOUR trading plan and risk tolerance. Always trade at your own risk!
🔗 Correlated Assets to Watch
Keep an eye on these related markets for confirmation:
AMEX:UNG (United States Natural Gas Fund) - Direct correlation
AMEX:BOIL (2x Leveraged Natural Gas ETF) - Amplified moves
AMEX:KOLD (Inverse Natural Gas ETF) - Opposite direction
AMEX:XLE (Energy Sector SPDR) - Broad energy sector correlation
NYMEX:CL1! (Crude Oil) - Energy sector correlation
COMEX:HG1! (Copper) - Industrial demand indicator
Key Correlation Point: Natural Gas often moves with broader energy sentiment. Watch crude oil and energy sector strength for confirmation of bullish momentum.
📝 Key Technical Points
✅ 382 Triangular Moving Average breakout = Trend confirmation
✅ Layered entries reduce average cost and risk
✅ Multiple timeframe confluence at target zone
✅ Energy sector showing relative strength
✅ Risk-reward ratio favors bulls above $3.000
⚡ Trading Notes
This setup combines technical precision with proper risk management. The TMA breach is a strong momentum indicator, and the layered entry approach allows for strategic position building. Remember to manage your position size according to your account and always have a plan before entering!
🎭 The "Thief Style" Disclaimer
🎪 FOR ENTERTAINMENT & EDUCATIONAL PURPOSES ONLY!
This "thief style" trading strategy is presented with a fun, heist-themed twist to make technical analysis more engaging. This is NOT financial advice. I'm not a licensed financial advisor, and you should NOT blindly follow any trading setup. Always do your own research, consult with licensed professionals, and never risk more than you can afford to lose. Trading is risky, and past performance doesn't guarantee future results. This is my personal analysis shared for educational purposes only! 🎭
✨ If you find value in my analysis, a 👍 and 🚀 boost is much appreciated — it helps me share more setups with the community!
#NaturalGas #XNG #XNGUSD #EnergyTrading #SwingTrading #DayTrading #TechnicalAnalysis #TriangularMovingAverage #TMA #Breakout #BullishSetup #TradingStrategy #RiskManagement #LayeredEntry #CashFlowManagement #EnergyCommodities #NatGas #CommodityTrading #TrendTrading #PriceAction
Profit Blueprint on XNG/USD! Is This the Bullish Energy Move?😎 Steal the Show with XNG/USD: The "Thief" Day Trade Blueprint! 🚨
Asset: XNG/USD (Natural Gas CFD) - Energies MarketVibe: A cheeky, calculated heist to snag profits with a slick Ichimoku breakout strategy! 💰
📜 The Master Plan: Ichimoku Kijun Line Breakout
🎯 Confirmed Bull Trend: The price has broken above the Ichimoku Kijun-Sen line, signaling a bullish move in the Natural Gas CFD market. This breakout is our green light to execute the "Thief Strategy" with precision!
🕵️♂️ Entry: The Thief’s Layered Approach
🔍 How It Works: The "Thief Strategy" uses a layering method with multiple buy limit orders to scale into the trade safely, protecting your capital while maximizing profit potential. No fear, just finesse! 😎
Buy Limit Layers:
🥉 2.960
🥈 2.980
🥇 3.000
🏆 3.020
💡 Pro Tip: Add more layers based on your risk appetite and account size for extra flexibility!
Alternative Entry: If you prefer a single entry, jump in at the current market price after the Kijun-Sen breakout confirmation. Your call, Thief OG! 😏
🛑 Stop Loss: Protect Your Loot!
🚨 Thief Stop Loss: Set at 2.900, just below the breakout level to guard against reversals.
Customize It: Adjust your stop loss based on your risk tolerance and strategy. This is your heist—own it!
Note: Dear Thief OG’s (Ladies & Gentlemen), I’m not dictating your stop loss. Manage your risk and keep your profits safe! 💪
🎯 Target: Escape Before the Trap!
🏃♂️ Profit Target: Aim for 3.150, where strong resistance, overbought conditions, and a potential trap await. Cash out before the "police" (market reversal) catch you!
Note: You’re the mastermind here. Take profits at your own discretion—don’t let me cap your gains! 💸
🔗 Correlation & Related Markets to Watch
Natural Gas (XNG/USD) often correlates or reacts with:
ICMARKETS:XBRUSD (Crude Oil Brent) – Energy sector movements can impact gas demand.
FOREXCOM:USOIL (Crude Oil WTI) – Supply/demand shocks in oil can spill into gas pricing.
OANDA:XAUUSD (Gold) – Inflation hedge & safe-haven flows can influence energy sentiment indirectly.
TVC:DXY (US Dollar Index) – A stronger/weaker dollar impacts commodity pricing.
SP:SPX (S&P 500 Index) – Risk-on/risk-off sentiment across markets.
Keeping an eye on these pairs helps confirm energy market momentum and macro sentiment.
Key Correlation Point: Natural Gas prices often lead or lag other energy markets due to supply/demand dynamics and seasonal factors. Confirm your trade with cross-asset analysis for a sharper edge! 📊
🧠 Why This Setup Rocks
Ichimoku Precision: The Kijun-Sen breakout is a reliable signal for short-term bullish momentum.
Layered Entry Safety: The Thief Strategy’s multiple limit orders spread risk and allow scaling without overcommitting.
Risk Management: Clear stop loss and target levels keep your heist disciplined and profitable.
Market Context: Energy markets are volatile, but this setup leverages technical confirmation to ride the wave. 🌊
✨ If you find value in my analysis, a 👍 and 🚀 boost is much appreciated — it helps me share more setups with the community!
#ThiefStrategy #XNGUSD #NaturalGas #Ichimoku #DayTrading #EnergyMarkets #TradingView

Natural Gas Short Term Buy IdeaH1 - Higher highs
Strong bullish momentum
Until the strong support zone holds I expect the price to move higher further after pullbacks

Natural Gas LONG TERM TRADE analysisHello Traders
In This Chart NATGAS HOURLY Forex Forecast By FOREX PLANET
today NATGAS analysis 👆
🟢This Chart includes_ (NATGAS market update)
🟢What is The Next Opportunity on NATGAS Market
🟢how to Enter to the Valid Entry With Assurance Profit
This CHART is For Trader's that Want to Improve Their Technical Analysis Skills and Their Trading By Understanding How To Analyze The Market Using Multiple Timeframes and Understanding The Bigger Picture on the Charts

NATGAS LONG TERM TRADE analysisHello Traders
In This Chart NATGAS HOURLY Forex Forecast By FOREX PLANET
today NATGAS analysis 👆
🟢This Chart includes_ (NATGAS market update)
🟢What is The Next Opportunity on NATGAS Market
🟢how to Enter to the Valid Entry With Assurance Profit
This CHART is For Trader's that Want to Improve Their Technical Analysis Skills and Their Trading By Understanding How To Analyze The Market Using Multiple Timeframes and Understanding The Bigger Picture on the Charts

NATURAL GAS LONGHelloooooooo PIPPIN TRADERS!!! I'm back with another one. Natural gas is showing a sign of a small correction down to around 6.70 before we have another push upwards to 8.00. Good risk to reward...trade with care!!
