XPL at a Critical Demand Zone โ Is a Major Rebound Coming?๐ต Coin: AMEX:XPL / TetherUS
โ Time Frame: 2D (2 Days)
๐ Market Structure: Sideways Consolidation
๐ก Key Support Zone: $0.081 โ $0.070
### ๐ 1. Price Structure Analysis
XPL is once again testing its major demand and support zone around $0.081 โ $0.070.
This zone is particularly important, as it has repeatedly acted as an area of price reaction and potential support formation since February 2026.
Currently, XPL is approaching this zone again following selling pressure from previous resistance
Xplanalysis
XPL โ Descending Triangle: Breakout or Breakdown Next?๐โก Technical Analysis โ XPL/USDT
๐ต Coin: AMEX:XPL
โ Time Frame: 2D
๐ Structure: Descending Triangle / Descending Resistance Structure
๐ฏ Major Support: $0.072 โ $0.082 ๐จ
๐ Current Price Area: ~$0.086
๐ป Major Trendline Resistance: Around $0.095โ$0.100 and gradually declining over time
---
๐ป๐ 1. Descending Trendline โ Major Resistance
The descending yellow trendline represents the main dynamic resistance ๐๐ป on the chart.
Since the rejection from around $0.21, XPL has continued forming a low
Plasma XPL price analysis to the end of 2026๐ CRYPTOCAP:XPL is starting to look very interesting.
According to market trackers, the daily trading volume of #Plasma is now running at roughly 3x the project's market capitalization.
By itself, that doesn't guarantee anything.
But it definitely gets our attention.
What's even more interesting is the chart.
๐ Despite the unusually high trading activity, OKX:XPLUSDT isn't showing signs of panic or distribution.
Instead, price continues to consolidate in a relatively tight range.
And whil
XPL/USDT - Major Breakout or Another Rejection?XPL/USDT is currently showing signs of recovery after experiencing a sharp decline that formed a low around $0.0601. Price has successfully rebounded from a strong demand zone and is now testing a key resistance level represented by a ๐ Descending Trendline that has been suppressing price action for several months.
โก This area is critical, as a breakout above the trendline could potentially shift the market structure from bearish to bullish.
---
๐ Current Technical Structure
๐ Descending Tre
XPL/USDT - Descending Trendline Ready to Break?XPL/USDT on the 1D timeframe is still moving within a medium-term downtrend structure since its initial listing ๐ However, the current price action is starting to show signs of a potential trend shift after once again testing the major descending trendline that has acted as strong resistance for months โก
Selling pressure appears to be weakening, while price is beginning to form an accumulation base around the lower support area ๐งฒ If buyers manage to push a valid breakout above this trendline, t
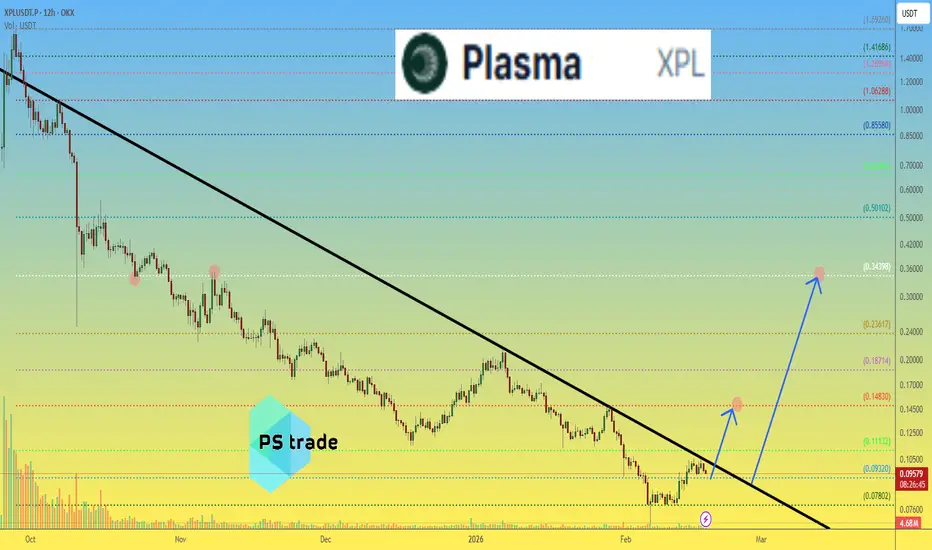
Plasma XPL price analysisIs it time for CRYPTOCAP:XPL to โcome back to lifeโ? The chart strongly suggests it might be.
Right now, OKX:XPLUSDT is being squeezed right under the descending trendline โ a classic setup that often precedes a breakout.
Whatโs more interesting is that CRYPTOCAP:XPL barely reacts to CRYPTOCAP:BTC and major altcoin movements, which may indicate accumulation and preparation for an independent move.
๐ Minimum scenario:
A +50โ60% move toward $0.144โ0.148,
as long as price holds above $0.
XPL/USDT at Critical Resistance โ Breakout or Another Rejection?On the 1D timeframe, the price movement of XPL/USDT (Plasma) remains within a strong downtrend structure since the distribution phase at the previous top area.
Clearly visible sequences of:
Lower High
Lower Low
Dominant selling pressure
Weakening volume during retracements
The descending trendline acts as a major dynamic resistance that continues to suppress price movement.
Price is currently trading in the lower structure area โ approaching a minor demand zone after printing a new low.
XPL : The rise of a star or an illusion?Hello friends
Technically, this currency has formed two important supports after its decline and a resistance level has been identified.
Note that for price growth, it is very, very important that resistance is broken, so don't go buying and then say why it didn't grow. We need volume for growth, and with volume, resistance is broken, and in that case, we can wait for the specified targets to move.
This coin is on the Swift blockchain in the DeFi space, which has attracted a lot of market att
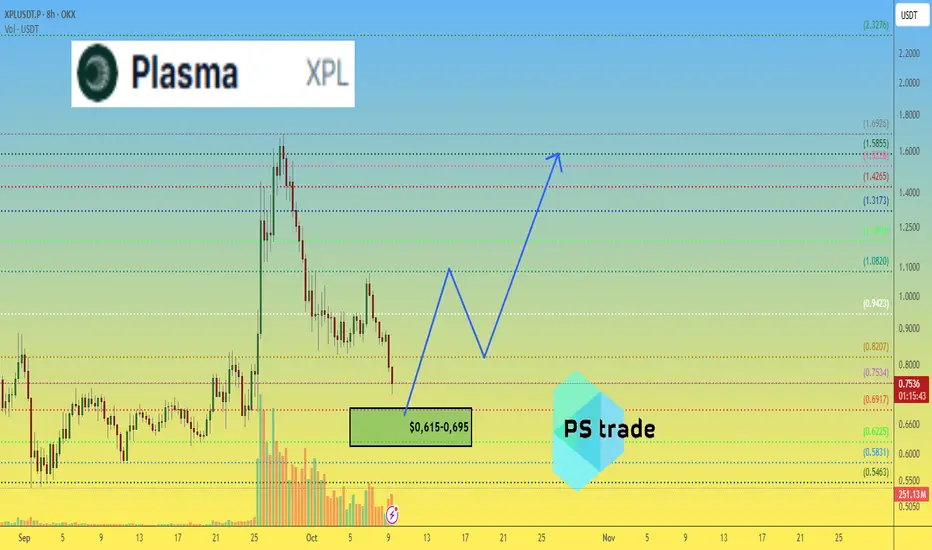
Plasma XPL price analysis๐ค Hard to believe all this FUD around #XPL isnโt just a setup to let the big players buy cheaper ๐
๐น The OKX:XPLUSDT chart has entered the previous consolidation zone โ technically, it looks like the market is trying to build a solid base before the next move.
๐ Ideally, market makers and buyers wonโt let the price drop below $0.6150โ0.6950, which could become a perfect accumulation zone before the next wave up ๐
๐ค What do you think โ just short-term FUD or the start of a deeper correction