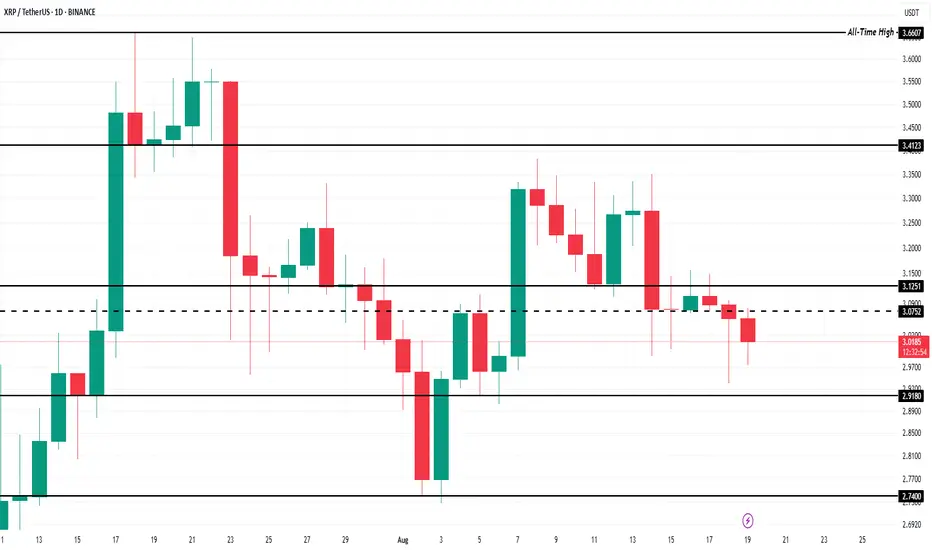
Did Xrp just print a local bottom? My take profit targets...Xrp just put in a local low at $2.9 today and going in heavy on the retrace (off that low) was a good idea. I expect my Bullish T1- take profit zone, to be hit relatively soon. I then anticipate a retrace to my bearish targets. My ideal target will be in my red T2 box. I remain cautiously bullish after Xrp spends some time developing this bottoming range. Lower lows are welcome as the provide excellent re-entry points for me.
May the trends be with you.
Xrpusdforecast

XRPUSD continues to declineXRPUSD continues to decline
XRPUSD has been trading within a descending channel since August 11. The asset trades below the SMA200 on hourly timeframe, breaking through and then retesting the support levels. Currently, the price trades below the SMA50 and has recently retested the former 3.00000 support level. MACD on 1- h timeframe has crossed into the red zone. The further decline towards 2.72000 is expected.

$950 Million XRP Moved Off Exchanges – Price Impact ExplainedBINANCE:XRPUSDT current price is at $3.01 after losing the support at $3.07. The decline in price is largely due to a lack of bullish momentum, compounded by broader market negativity. Without a clear catalyst, XRP might face further consolidation as the market waits for stronger buying signals.
Investors are still actively accumulating BINANCE:XRPUSDT , as reflected in the declining exchange net position. The indicator currently sits at a 5-month low, signaling net outflows from exchanges. In the past week alone, over 312 million XRP worth approximately $950 million has been bought by holders, showing optimism toward the asset's potential recovery.
In the coming days, BINANCE:XRPUSDT may test the $2.91 support level , marking a potential 2-week low. A drop below this level is unlikely, suggesting that this range could act as a temporary consolidation zone. As long as the price holds within this range, the market may await clearer direction.
However, if BINANCE:XRPUSDT reclaims the $3.12 support , the cryptocurrency could recover its recent losses. This would depend on continued accumulation by investors, as well as sustained optimism for a price rebound. Only with this renewed interest would XRP be able to push for higher levels.
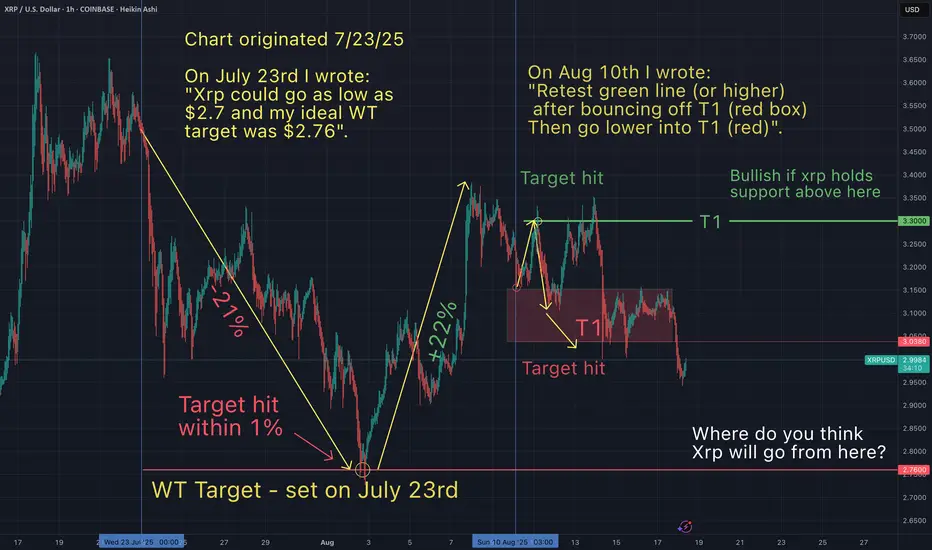
You continue to ask "how did he know Xrp would do that"?I like to keep stats on my predictions, and so should you. How else can you tell if someone is worth following? So, here's a recap since my first Xrp post ever, made on July 23rd 2025.
July 23rd- I suggested Xrp could go as low as $2.7 (a -25% dump from that day).
July 28th- As Xrp approached $2.7 I refined my predicition to a WT target of $2.76
Aug 2nd- My $2.76 WT target was hit (within 1%). See below
Aug 7th- I expected a big bounce from my WT target (20+%) and I followed up with a post, as we started to get close to that next top.
Aug 10- I called "the top was in", and I suggested that Xrp would drop to my support range of $3.03-$3.15 within 1-3 days. That target was hit 1.5 days later. I also suggested Xrp would bounce from my red T1 box and retrace up to my T1 green line...and then go lower into my red box. My calls on direction and target for each of these 3 moves were confirmed. See below.
Aug 11th- Xrp went lower into my red box as anticipated.
Notice in all of my charts, I do not simply offer support and resistance zones (as some influencers do). I anticipate the direction the asset will take as it travels through these zones. Simply identifying support and resistance is not enough to execute profitable trades. I hope that my accuracy in determining directionality and precise targets has been of benefit to you. I would like to see us all succeed.
Please note, I'm not sure how much longer I will continue to chart at this pace, being that it takes a lot of time & effort to bring you these free gold nuggets. Let me know if you want me to show you how I draw these maps to the gold mine.
Xrp - It all comes down to this!🚀Xrp ( CRYPTO:XRPUSD ) has to break structure:
🔎Analysis summary:
After Xrp created the previous all time high in 2018, we have been seeing a consolidation ever since. With the recent all time high retest however, Xrp is clearly showing some considerable strength. It all comes down to bulls being able to push price higher, above the massive horizontal structure.
📝Levels to watch:
$3.0
SwingTraderPhil
SwingTrading.Simplified. | Investing.Simplified. | #LONGTERMVISION

Xrp - Is it time to panic sell?It's never a good idea for me to sell out of fear. Understanding how price action moves and why, helps me navigate my emotions. A confluence of factors lead me to believe that Xrp will soon bounce up to my target

XRP Whales’ $3.8 billion Accumulation May Drive Price To ATHBINANCE:XRPUSDT is currently trading at $3.18 , having faced a slight decline over the last four days. The altcoin remains 15.3% below its ATH of $3.66, which investors are targeting. The ongoing bullish sentiment, coupled with whale accumulation, keeps the price within range of a potential breakout.
If the whales’ efforts succeed, BINANCE:XRPUSDT price could rise to $3.41 . If the $3.41 level is flipped into support, XRP could continue its ascent toward its ATH of $3.66 . This scenario would signal a sustained bullish momentum, with strong backing from both large holders and retail investors. The support level at $3.41 would play a crucial role in sustaining XRP’s price growth.
However, if BINANCE:XRPUSDT faces bearish cues from the broader market or selling pressure from retail investors, the price could dip to $2.99 or even lower . This would invalidate the bullish thesis and raise concerns about the sustainability of the upward trend.

Xrp - This is the bullrun breakout!🔑Xrp ( CRYPTO:XRPUSD ) breaks the triangle now:
🔎Analysis summary:
After the recent bullish break and retest, Xrp managed to already rally another +100%. This is a clear indication that bulls are still totally in control of cryptos and especially Xrp. It all just comes down to the all time breakout, which will then lead to a final parabolic rally.
📝Levels to watch:
$3.0
SwingTraderPhil
SwingTrading.Simplified. | Investing.Simplified. | #LONGTERMVISION

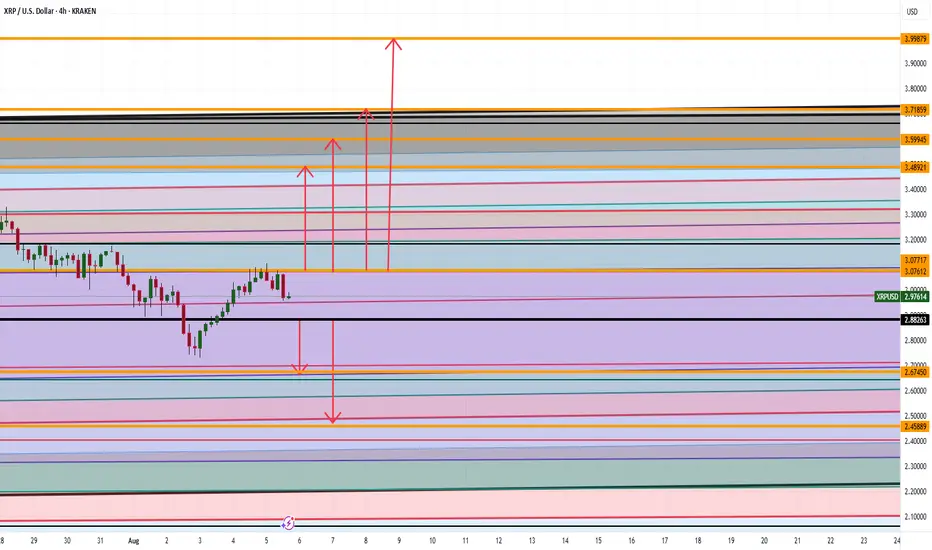
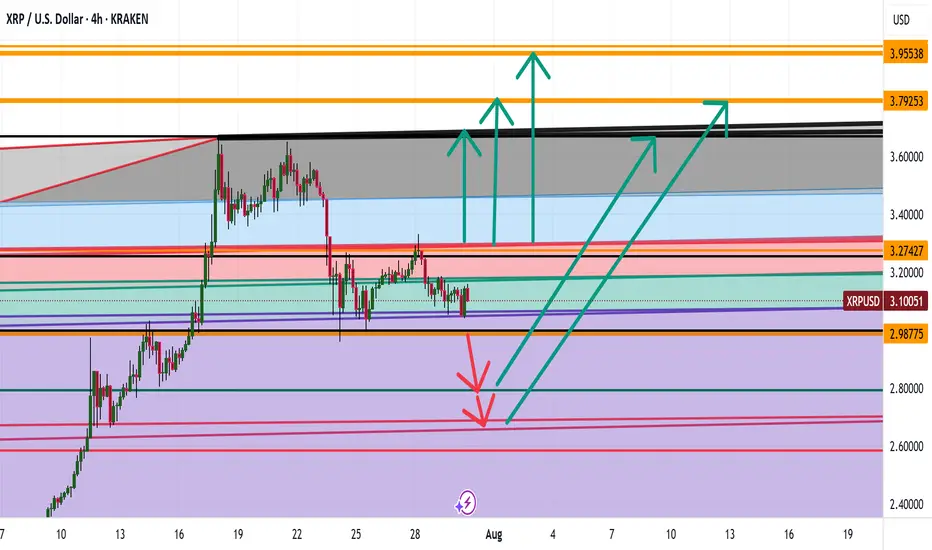
XRP ARE WE GOING TO $4 ANALYSIS Good afternoon
So looking at XRP we can spot a couple things :
Bullish Side: If we can break the high at 3.07 then 3.48,3.59,3.71, and 3.99 makes sense
Bearish Side: If we go below 2.88 then a drop down to 2.67 then 2.45 makes sense
Trade Smarter Live Better
Kris
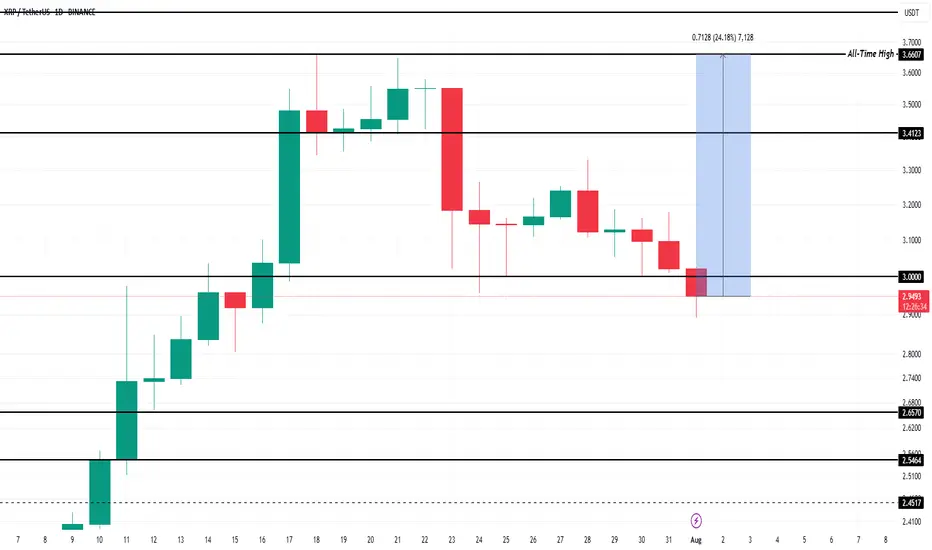
What To Expect From XRP In August 2025?Currently, BINANCE:XRPUSDT is trading at $2.99, slipping through the key support level of $3.00. While the altcoin is still over 22% away from its ATH of $3.66 , the foundation for potential growth remains strong. Historical data has shown that August typically brings bearish momentum for BINANCE:XRPUSDT , with median monthly returns of -6% .
However, given the strong buying activity observed recently and the positive technical indicators, this August might defy the usual trend. If BINANCE:XRPUSDT manages to secure support above $3.41, the altcoin could push towards its ATH once again . Alexis Sirkia, Captain at Yellow Network, discussed with BeInCrypto how XRP’s future could be looking like.
“Institutions that have been in the market for a while are gaining momentum. We're also, in the meanwhile, in a macro environment where funds are doing risk rotation… BINANCE:XRPUSDT is taking its stand with regulation and infrastructure, not hype. That's what will endure in the long run. Short-term flows are fleeting, but the groundwork laid today will define the cycle to follow.”
However, there’s a downside risk. If BINANCE:XRPUSDT fails to reclaim the $3.00 support, the price could fall to $2.65, invalidating the bullish thesis. A drop to this level would mark a four-week low and would likely lead to further selling pressure.
XRP WHERE ARE WE HEADED ? LEVELS TO LOOKOUT FORHey trading fam
So XRP is a fun one but based on BTC correcting and what we are seeing there are a couple thesis's that we currently have for it
Thesis 1: We break south from 2.98 lows: Levels to look out for:
2.80
2.70
2.68
Thesis 2: We break the highs of 3.29: Levels to look out for:
3.65
3.79
3.99
Trade Smarter Live Better
Kris
XRP: Support at $2.960 Holds the Bullish SetupFenzoFx—XRP dipped from $3.666 but stabilized near the monthly anchored VWAP at $2.960. It now trades at $3.142 above the ascending trendline.
Immediate resistance lies at $3.332, aligned with the descending trendline. A close above this level may propel XRP to $3.432. Strong buying could extend gains to the recent high of $3.666.
The bullish outlook stands while XRP/USD holds above key support at $2.960. A drop below this level would invalidate the bullish scenario.

$500 Million XRP Accumulation To Drive 15% Price Rise to ATHBINANCE:XRPUSDT is currently trading at $3.20, which places it 14% away from reaching its ATH of $3.66. The support at $3.38 is crucial, and securing it could lead to further gains.
BINANCE:XRPUSDT has been seeing significant inflows in the past three days. Over 163 million XRP, worth around $519 million , have been accumulated by investors. This buying surge suggests that a wave of optimism is returning to the market, signaling that investors are positioning themselves for a potential price increase.
If BINANCE:XRPUSDT can reclaim support at $3.38 , it will be well-positioned to push past its ATH and reach new highs. This would mark a significant milestone for the altcoin, setting the stage for further price gains.
However, should the investor sentiment shift and selling pressure increase, BINANCE:XRPUSDT could face a decline. If the price falls below $3.00, it could slide to $2.96 or lower , invalidating the bullish thesis.

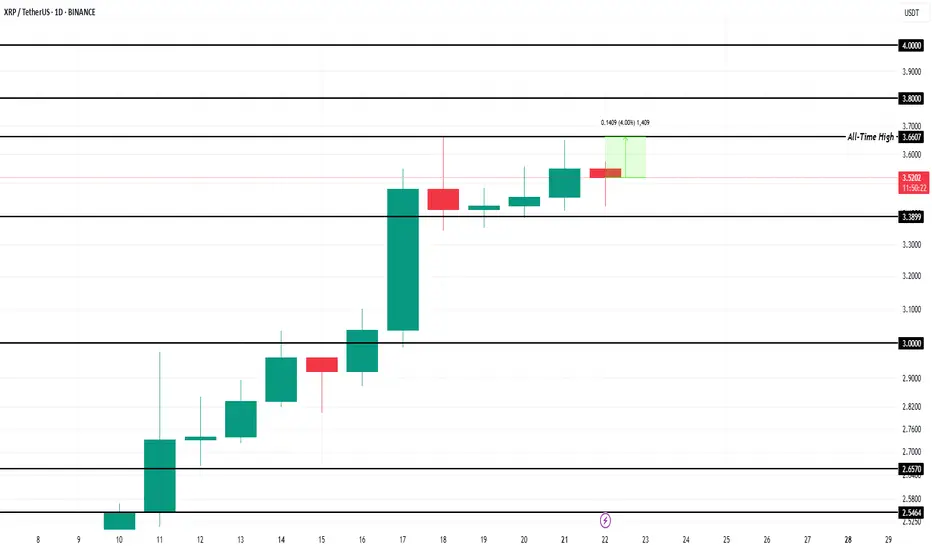
XRP Price Reversal Likely After $2.81 Billion Selling In 7 DaysBINANCE:XRPUSDT is currently trading at $3.48, only 4% away from its all-time high . Over the past week, exchange wallets saw an influx of nearly 450 million XRP, valued at more than $2.81 billion . This spike in supply indicates that holders are moving their assets to sell, usually a bearish indicator in market cycles.
Despite the proximity, BINANCE:XRPUSDT price is showing signs of weakness and is clinging to the $3.38 support level . Without renewed buying interest, this support may not hold much longer.
If investor selling continues, BINANCE:XRPUSDT could fall through $3.38 and test the $3.00 support . A drop to this level would erase the recent gains and confirm a near-term bearish reversal. The loss of $3.00 could signal a longer consolidation phase or deeper correction.
However, if market participants absorb the sold supply and restore demand, BINANCE:XRPUSDT could rebound quickly . In this scenario, the altcoin might surpass $3.66, breach $3.80, and aim for $4.00 . Such a move would invalidate the bearish outlook and set a new all-time high.
XRP new movement soon !XRP / USDT
XRP is on a long retest after breakout of accumulation zone weeks ago
successful retest here will result in strong bullish rally !
Keep an eye on it in the coming days 👀
XRP Cools Near $3.00 Amid Overbought SignalsFenzoFx—XRP remains bullish after piercing $3.00 earlier this week but cooled near resistance. Trading around $2.90, Stochastic (~84) and RSI 14 (80) indicate overbought conditions, suggesting consolidation.
We anticipate a pullback toward $2.66 support before resuming the uptrend. Alternatively, a decisive break above $3.00 would target $3.21 next.

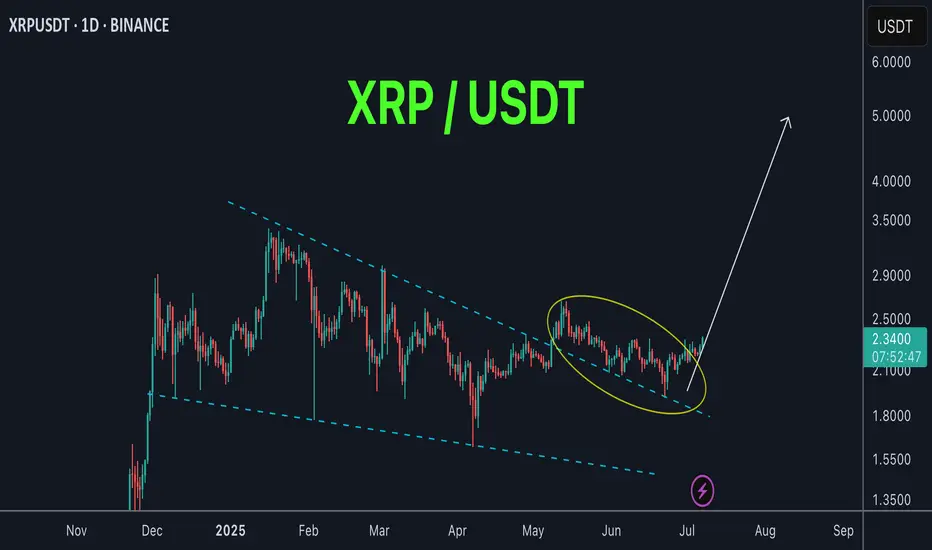
XRP Technical Analysis – Massive Breakout in Play!After months of tight consolidation inside a symmetrical triangle, XRP/USDT has finally broken out with strong bullish momentum on the daily timeframe.
🔹 Chart Pattern: Symmetrical Triangle
🔹 Breakout Confirmation: Daily candle closed above the descending trendline resistance
🔹 Support Zone: ~$2.00 – $2.20 (Held multiple times since April)
🔹 Breakout Level: ~$2.48 – $2.50
🔹 Next Resistance Levels:
▫️ $2.62 – Minor horizontal resistance
▫️ $3.39 – Major resistance from previous highs
▫️ $4.92 – Long-term macro target (measured move from triangle)
🧠 Why does this breakout matter?
✅ Strong Volume: Breakout happened with increased volume – a sign of genuine breakout
✅ Multi-month Base: The longer the consolidation, the stronger the breakout
✅ Support Respect: XRP respected the demand zone repeatedly, showing accumulation
✅ Momentum Building: A clean break could trigger trend-following bots and new buyers

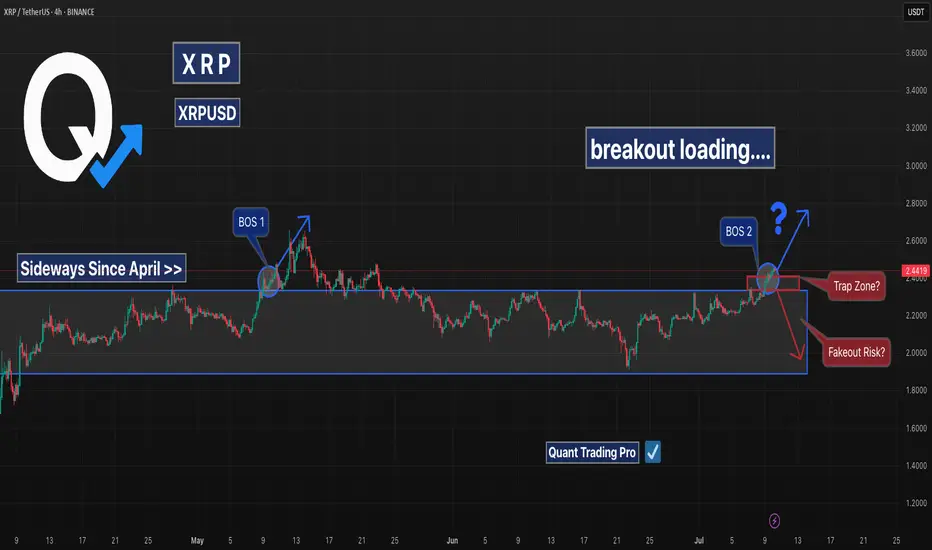
XRP Breakout Loading… or Just Another Trap?XRP has been locked in a sideways range since early April, bouncing between $1.90 and $2.45 for nearly 3 months.
Now, it’s pressing into the top of that range once again — and traders are watching closely for either a confirmed breakout or another fakeout rejection.
📊 Technical Breakdown:
🔹 Sideways Since April: The structure has been consolidative and indecisive.
🔹 BOS 1 + BOS 2: Each break of structure led to temporary rallies — but failed to hold above resistance.
🔹 Trap Zone Identified: ~$2.45–$2.50 has repeatedly acted as a liquidity magnet.
🔹 Fakeout Risk Still Present: Without strong follow-through, this could reverse into the range again.
📈 Breakout Scenario:
• Clean candle close above ~$2.50
• Targets: $2.90 and $3.20
• Look for volume confirmation
📉 Rejection Scenario:
• Wick into resistance + bearish engulfing
• Back to midrange or support zone ~$2.10
XRP: Break Above $2.338 Opens Path to $2.480FenzoFx—Ripple (XRP) eased near weekly highs of $2.338, with Stochastic and RSI 14 signaling overbought conditions. The trend stays bullish above the anchored VWAP or $2.165, but consolidation toward $2.2240 is expected before resuming.
A break above $2.338 would target the next supply zone at $2.480.

XRP .. few weeks before next bull?A new low is possible before Bull run!
it may be huge or one candle ,,
don't take the fractal exactly as you see for every movement

$XRP ALERTCRYPTOCAP:XRP price is pushing toward breakout resistance!
Don't FOMO in yet — confirmation comes above the red zone!
Break and hold above signals bullish continuation
Rejection could lead to a pullback to the demand zone!
Resistance zone: $2.35- $2.63
Support zone: $1.92 - $2.07
Patience brings profits!

XRP Back on the MENU! XRPUSD Ripple next move? XrpUsdtIt's been a while since we looked at this chart.
🌍 SeekingPips 🌎 View remains the same and so we are strictly looking for strategic LONG entry points in
TIME & PRICE. 👌
Yes it's a WEEKLY chart and I understand that many of the trigger happy TRADERS or in some cases GAMBLERS can't stand to look at anything longer than a 30 minute chart BUT really sometimes you really just have to STEP RIGHT BACK to see the BIGGER PICTURE👍
✅️This week's candle CLOSE really has the potential to setup the next few weeks for easy MULTIDAY TRENDING MOVE TRADE SETUPS 👍
ℹ️ Note the price location on what we viewed as a HTF FLAG MANY WEEKS AGO .
Yes it was breached both sides but 🌎SeekingPips🌍 doesn't trade the patterns themselves but the HUMAN PSYCHOLOGY AROUND THESE PATTERNS.🤔
ℹ️ Note where most of the volume has been trading and also note the moves around the extreems of the dead patteren too.💡
In an even higher TIMEFRAME THE FLAG would still be valid and forming the flag itself too.
📊 [ b]CHECKOUT the MONTHLY chart for the example. 📉
Anyway we will see what the next 48 hours🕦 hold but no doubt this one is on our RADAR this week.
✴️ 2.048 to hold otherwise a potential for current low of this year to be tested.
✴️ Alternatively if support starts to form on the 240min chart at current levels last weeks high could expected to be tested
✴️ if so Xrp could easily give a multiday upside trending move.
Now like a NINJA we wait and stalk...
As always ladies and gentlemen whilst Seeking Pips 🌍 SeekingPips 🌎 says
" NO TRIGGER NO TRADE"
& "STICK TO YOUR PLAN"✅️
👍 Have a GREAT WEEK and we will see you soon with an UPDATE...

XRPXRP just created a Inversion FVG on the 1h timeframe, paired with a sweep of the Previous Day Lows, indicates a strong move upwards.
We should see a retest of Previous Day High at $2.36 which may lead to a test of a 4h FVG between $2.38 - $2.40.
If we get any big announcements this weekend, we may see run towards $3 heading into the week.
Have an exit strategy once we have our banana move, it's been a great journey.
LOCK IN.
