Ripple ( $XRP ) is literally the reflection of 2017The current wave movements of XRP appear to be a reflection of the period from 2013 to 2017. We are in a re-accumulation phase before the next major upward wave.
XRPUSDT

Meme Coin Victims Keep Growing, Illusion of Overnight WealthCan you really turn zero into millions overnight?
What makes people throw all their savings into an unknown meme coin?
And if profits are rare, then who is the real winner in this psychological game?
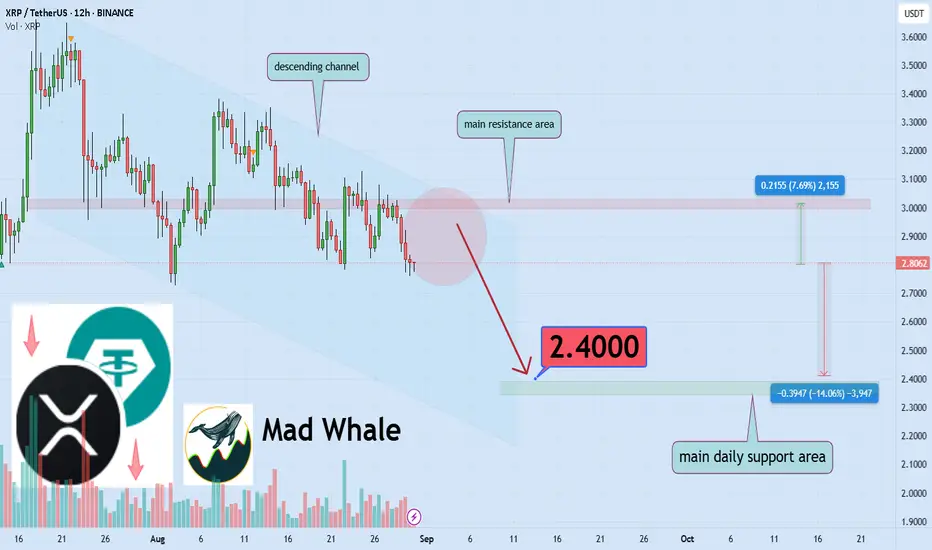
Hello✌️
Spend 2 minutes ⏰ reading this educational material.
🎯 Analytical Insight on Ripple:
BINANCE:XRPUSDT is currently trading within a clearly defined descending channel 📉, facing strong daily resistance. A pullback of at least 14% is likely, with a target near 2.40💰.
Now , let's dive into the educational section ,
🔄 The Repeating Psychological Cycle
Meme coins always follow the same emotional cycle.
It begins with excitement: a few posts in social media (viral posts), and sudden buzz spark positive energy. Then comes greed: people start buying without logic, dreaming of instant riches. After that, the stage of social proof takes over, when friends, influencers, and media shout about the “golden opportunity,” creating fear of being left out. This is when newcomers pile in with full force.
Right here, whales quietly start selling, and the market shifts into collapse. Prices fall sharply, triggering panic. Small traders, desperate to save what’s left, sell at heavy losses. Finally, the capitulation phase arrives — where everyone admits defeat, swearing never to touch the market again.
The bitter twist? At capitulation, whales buy back cheap, restarting the cycle from the ground up. This pattern has repeated so many times that it has become a psychological law of meme coin trading. Recognizing it allows traders to step away from being victims and instead use the cycle to their advantage.
🚀 The Temptation of Fast Wealth
Nothing seduces the human mind like the promise of 1000% gains in a single night. At that moment, greed replaces logic and even experienced traders break their own rules. The dream of instant financial freedom is so powerful that nobody pays attention to the thousands of hidden losers only the lucky screenshots of oversized wallets make it to social media, fueling the next wave of victims.
🐋 The Whale’s Game
Whales are masters of illusion. They buy in large chunks, pump the price, spread rumors, and once the crowd rushes in, they quietly dump their bags. It’s a pure psychological war: retail traders fear being left behind, convinced they’ve spotted a once-in-a-lifetime opportunity. The truth is whales never trust hype they create it.
😱 The Fear of Missing Out
FOMO is the silent killer of traders. The thought that “everyone else is getting rich except me” drives people into reckless entries. The irony is that most of these entries happen at the exact top of the chart. When the crash comes, it not only drains capital but also crushes the trader’s mental stability. Many beginners quit altogether after one devastating loss.
🛡 Security or the Illusion of Security
Believing a meme coin is safe because it pumped 1000% in a week is one of the biggest traps. Real security comes only through risk management. Putting all your money in one meme coin is like driving blindfolded on a highway you might survive for a while, but the crash is inevitable.
📊 TradingView Indicators and Tools
1. Volume Profile
This tool shows where the highest trading volume has taken place. In meme coins, concentrated volume at specific price levels usually indicates whales playing their game.
2. Relative Strength Index (RSI)
RSI reveals overbought and oversold zones. When a meme coin pumps too quickly, RSI often spikes above 70 a sign of extreme greed taking over.
3. Fear and Greed Index
This index captures overall market sentiment. High readings reflect collective greed, while low readings show panic and fear. Overlaying it on your chart gives a psychological mirror of the crowd.
4. Combining the Tools
The real edge comes from using them together. Imagine Volume Profile shows strong accumulation at a level, RSI flashes overbought, and Fear and Greed signals extreme greed chances are high a sell-off is near. Using tools this way transforms hype-driven trading into informed decision-making.
🎯 Summary
Meme coins are less of a financial opportunity and more of a psychological battlefield. Understanding the emotional cycle and applying TradingView tools can be the difference between being a survivor or a casualty.
🔑 Five Practical Tips for Traders
Always set take-profit and stop-loss levels let strategy, not emotions, manage your trades.
Never enter a position without a tested trading plan you trust.
Invest only what you can afford to lose meme coins are highly speculative.
Remember: news and hype only show the glamorous half; always do your own research.
Protect your peace of mind if a trade causes overwhelming stress, exit immediately.
✨ Need a little love!
We pour love into every post your support keeps us inspired! 💛 Don’t be shy, we’d love to hear from you on comments. Big thanks , Mad Whale 🐋
📜Please make sure to do your own research before investing, and review the disclaimer provided at the end of each post.
XRP/USD: Potential Bullish BreakoutXRP/USD is currently in a consolidation phase, holding strong above the support level at $2.75. We have also observed a positive divergence on the RSI, which is holding within a similar consolidation pattern. This suggests a potential shift in momentum.
Trade Plan:
Support: $2.75
Target: $3.80
Entry Options:
Aggressive Entry: A buy entry can be considered around $2.80.
Safe Entry: For a more conservative trade, wait for a confirmed breakout and retest above $3.01.
This is not financial advice. Always do your own research before trading.

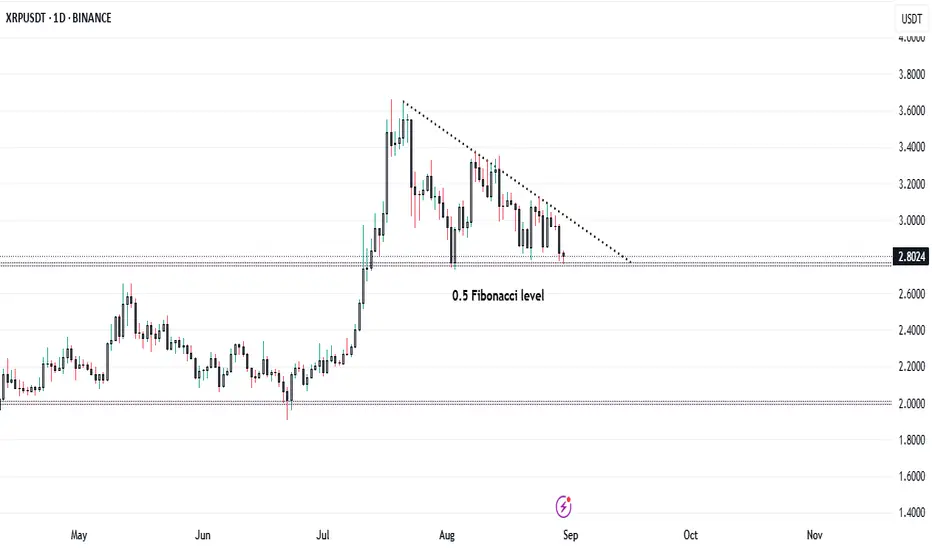
Descending Triangle Showdown: XRP Bulls vs Bears at $2.80..!XRP is currently hovering around the $2.80 level, sitting precisely at the 0.5 Fibonacci retracement zone, which has been acting as a strong support level in recent sessions.
📉 Technical Structure:
* Price action has formed a descending triangle pattern, indicating a period of consolidation following the sharp rally in July.
* The 0.5 Fibonacci level ($2.80) is a critical zone to watch; a strong bounce here could signal renewed bullish momentum.
* A break below $2.80 could open the doors for a retest of the 0.618 Fibonacci level ($2.60) or even deeper support near $2.00.
* On the upside, a breakout above the descending trendline would be the first sign of strength, potentially driving XRP back towards $3.40–$3.80 resistance levels.
⚠️ Key Takeaway:
XRP is at a make-or-break level. Bulls must defend $2.80 to keep the broader uptrend intact, while bears are eyeing a decisive breakdown to extend the correction phase. Traders should stay alert for a confirmed breakout or breakdown from this tight consolidation range.
💡 Strategy Watch:
* Aggressive traders may look for long entries near $2.80 support with tight stops.
* Conservative traders can wait for confirmation: a break above the trendline for bullish momentum or a clean break below $2.80 for bearish continuation.
XRP Price Struggles Below $3 As Outflows Reach 9-Month HighAt the time of writing, BINANCE:XRPUSDT trades at $2.87, remaining stuck under the $2.95 resistance level. The altcoin has attempted to reclaim the $3.00 threshold for the past two weeks but has repeatedly failed to close above it, highlighting the weakness in bullish momentum.
The Chaikin Money Flow (CMF), a metric tracking capital inflows and outflows, has dropped to a nine-month low. This decline confirms that outflows are currently overwhelming inflows, a bearish sign for XRP's short-term outlook .
Given these conditions, BINANCE:XRPUSDT could face further declines. A drop toward $2.74 remains likely if selling pressure continues, with the asset consolidating above this zone.
If investor sentiment shifts, BINANCE:XRPUSDT could attempt recovery. Reclaiming $2.95 as support would provide momentum to test higher levels. A successful breakout above $3.07 and later $3.12 would invalidate the bearish thesis.

XRP/USDT – Breakdown & RetestCRYPTOCAP:XRP recently broke below its key trendline and has now retested the level, showing rejection — a strong bearish continuation signal.
Structure
Breakdown of the ascending trendline
Retest rejection confirms selling pressure
Supports stacked below at key levels
Trade Plan
Entry: After rejection near the trendline retest
Stop Loss: Above broken trendline
Targets: 0.3540 → 0.3422 → 0.3310 → 0.3240
Bias
Bearish unless XRP reclaims the trendline with a strong close. If reclaimed, the short setup is invalid.
Trading Insight
This is a classic breakdown + retest setup, often signaling continuation to lower support zones. Manage risk with SL.
DYOR | Not Financial Advice
XRP - LONG SET-UP (SUPER BULLISH)BINANCE:XRPUSDT
Looking Good To Long Between 2.39 - 2.49
With SL Below 2.24
Safe Target 2.56 , 2.8++
Low Lev only as per your risk capacity
JUST FOR EDUCATIONAL PURPOSE

#XRPUSDT - UniverseMetta - Analysis#XRPUSDT - UniverseMetta - Analysis
Setup for potential wave 5 continuation
📆 W1 – Weekly Timeframe
🔹 Price has spent over a month in a corrective structure following the completion of wave 3
🔹 A continuation of the 5th wave in the broader uptrend is possible — if price breaks and closes above the trendline
🔹 A down fractal may serve as a key trigger for the next bullish impulse
🎯 Medium-term structure target: $4.32 (Wave 5 — 2.618 Fib from Wave 1)
📉 D1 – Daily Timeframe
🔹 Price has formed a triangle consolidation — signaling potential breakout soon
🔹 Breakout of the upper trendline could lead to a strong upward continuation
🔹 If the move extends as part of a broader correction, we may see targets up to $5.17 (2.618 Fibonacci extension)
🎯 Key resistance zones:
• $4.32
• $5.17
🎯 Trade Idea:
#XRPUSDT #BUY
Entry: 3.1275
Take Profits (TP):
• 3.5193
• 3.7917
• 4.0420
• 4.4544
• *5.1642
Stop Loss: 2.7723
‼️ Risk exposure should not exceed 1–3% of your portfolio
This signal/idea is not financial advice

XRP to $5.50XRP is in its 5th wave, and based on this weekly bull flag, it could reach $5.50 after breaking the resistance line.

XRP 4H – Golden Pocket Rejection, Can Support Zone Hold?XRP is consolidating between major Fibonacci levels and clearly defined supply/demand zones. Price has rejected the golden pocket (0.618–0.786) around 3.15–3.25, leaving resistance stacked above near 3.30–3.35.
The downside focus is now on the support zone at 2.85–2.90, which has provided reaction in recent sessions. A breakdown beneath this box could open further downside, while a successful defense could keep XRP ranging under the golden pocket.
Key levels to watch:
Resistance: 3.15–3.35 (Golden Pocket + Supply Zone)
Support: 2.85–2.90
Until one of these boundaries breaks, price remains locked in a range with Fib retracements providing the roadmap.

XRP New Higher Low and Break of Structure, LONG PlayThe 45min chart is powerful for Crypto, and is showing a new Higher Low.
Break of structure to the upside. (See "bos" horizontal lines).
An upward channel is present on 45min chart and 1h chart.
Bull Pennant Pattern is showing on my candle times, including 4h and daily. These usually break bullish.
On the 45min chart the 200ma has just crossed above the 314ma. In my methodology that's a bullish MA cross.
ADX/DI and Squeeze and Wadda indicators are favorable on the lower time frames including 4h's.
This is slightly high octane speculation, but mostly TA with a slight bit of front running and TIGHT stop loss.
Overall looks like the ALT market is green today for many pairs against USD and USDC on Coinbase. If nothing else today should offer a stop loss in the green while XRP makes a move.
XRP *UPDATE*Hello friends
After the drop we had, the price was supported by buyers in the support area marked with Fibonacci and is now near an important resistance that if this resistance is broken, the price can grow to the specified limits.
The specified support areas are good points where you can buy in steps and with risk capital management.
*Trade safely with us*

XRPUSDT📊 The BINANCE:XRPUSDT is correction-trend. I think the short-term downtrend has come to an end.
🟢 Best support: 2.8640$
🔴 Targets: 3.2060$ - 3.6020$
⚠️ Please control risk management.

XRP Above Support · 5X Lev Trade-Numbers · Mid-Range (PP: 388%)XRP is trading above support. We can see EMA34 (green) being safe on the chart and not yet tested, a signal of strength. Our "support" range is also unmolested on the second drop. So far, support holds.
You know what we always say: "Sell at resistance, buy at support."
This looks like a good chart setup now but it can go wrong. You can have a good trade do bad, just like a bad decision can end up yielding good results. Our goal is to make the right decision all of the time and produce positive results more often than not.
At support, we have lower risk for a drop and higher chance for reversal. If we go deeper and look for other signals, we can wait for a stronger chart setup. Not all chart setups are the same.
Some trades have higher risk, others lower. Some trades move fast others slow. Some trades are a win; certainly, some other trades are a loss.
Our focus is not necessarily on winning once but on producing a positive outcome consistently. Can we achieve or goals? Can we reach success?
This chart setup is bullish but also a mix, prices have been dropping but again, we are looking at support.
Prices have been dropping since 18-July, more than a month. Why would a retrace go for longer? Is it necessary?
I don't know. XRP has been rising since November 2024 and is likely to resume going up. It will do so within hours or days. It will do so within weeks. You can decide to jump now or maybe later, there is no reward without risk.
Go ahead and take the plunge. We are ready for the bullish jump.
______
LONG XRPUSDT 5X (PP: 388%)
ENTRY: 2.73 - 2.95 (STOP: 2.65)
TARGETS: 3.08, 3.30, 3.46, 3.66, 4.02, 4.28, 4.59, 4.85, 5.17
______
You can notice some difference in the trade-numbers compared to previous posts. This is because we have different methods for extracting targets and it all depends on the goals and the timeframe. A daily chart setup will not give you the same targets as a weekly or monthly one.
Normally, I using the long-term targets for all ranges. These targets have been extracted with the mid-term range. But the move can cover a long space.
I am wishing you health, wealth, good luck, profits and success.
Namaste.

XRPUSDT:Trade 15 min FractalConsidering the Ripple chart and the fact that the majority of the movement is bearish, we can have this view, so we can expect the decline to continue even to $2.5.

AltcoinPioneers | XRP Daily Analysis Day1BINANCE:XRPUSDT
AltcoinPioneers | XRP Daily Analysis Day1
👋 Welcome to Altcoin Pioneers Group TRADING ™!
Let’s analyze XRP. Let’s explore the reason behind it and what Bitcoin’s next move might be.
It features a falling wedge pattern 🔻, marked with red lines ❌, indicating a potential reversal ⬆️.
The price rose initially 📈, then declined 📉 within the wedge, forming lower highs and lower lows.
A target price 🎯 is indicated around 3,0881 USDT 💰, suggesting a possible upward breakout 🚀.
The current price is near 2,829 USDT 📍.

XRP NEW VOLUME INCREASE AFTER CASEXRP can show in the coming time new trend volume, since it has shown the first signal.
For this reason there will be a follow at XRP
XRPUSDT: Trade 15 minHello, I opened a trade on Ripple, the points where the price is likely to reverse are marked, so in the lower timeframe there is a short-term trend towards gain. Be profitable.

XRP Confirms Support · Good NewsWill XRP resume growing right away? Yes!
Continue reading below for the full details... I shall explain.
My fellow reader and long-term supporter, it is my pleasure to write again for you today. We have good news here, we have strong signals to support our highly profitable and successful LONG trades. You can go all-in right now, timing is great.
XRP confirms support in two different ways. The main low happened the 28-July week and this week we have a shy higher low. The action stopped right at EMA13 and all selling was bought. All the losses this week have been recovered within a few hours, this is a major development.
If the market can recover this fast in just a few hours, what happens in a matter of days? What happens in 10 days or 21 days? Amazing possibilities; expect something great.
With support confirmed we know prices can move higher but it can happen that resistance is also confirmed and we continue—get—sideways forever more... And it becomes boring and we turn off the computer and find something to do at home.
Well, the last peak happened 14-July. Counting this week, we have a total of five weeks and that's a standard retrace for you. Prices move lower only a little, briefly and then the market continues with its main trend.
With five weeks of retrace and the retrace being over, we can expect higher prices right away.
Our targets continue to be the same. We will be aiming first at $4.4444 but just to move higher. Main target short- to mid-term is $6.28. Depending on how the market is doing at this point, we adapt and continue to trade.
Thank you for reading.
Namaste.

XRP Game PlanXRP Game Plan
📊 Market Sentiment
Market sentiment has slightly shifted as expectations for a 0.25 bps cut in September are no longer strongly priced in. Current probabilities still show around a 60% chance of easing, but overall, the market remains uncertain. This uncertainty has led to risk-off moves and sell-offs across multiple assets, starting with NQ and extending into crypto.
📈 Technical Analysis
Price is retracing towards a higher timeframe (HTF) key support level.
The main liquidity zone sits around $2.73, where I would expect a significant bounce.
📌 Game Plan
I expect price to run into the $2.73 liquidity zone and close back above it. From there, I will look for price to reclaim the HTF key level as confirmation of bullish continuation.
🎯 Setup Trigger
I will monitor the 4H market structure for confirmation before initiating a position.
📋 Trade Management
Stoploss: 4H swing low confirming the BOS
Targets:
TP1: $3.14
TP2: $3.38
💬 Like, follow, and comment if you find this setup valuable!
⚠️ Disclaimer: This content is for informational and educational purposes only and does not constitute financial, investment, or trading advice. Always do your own research before making any financial decisions.

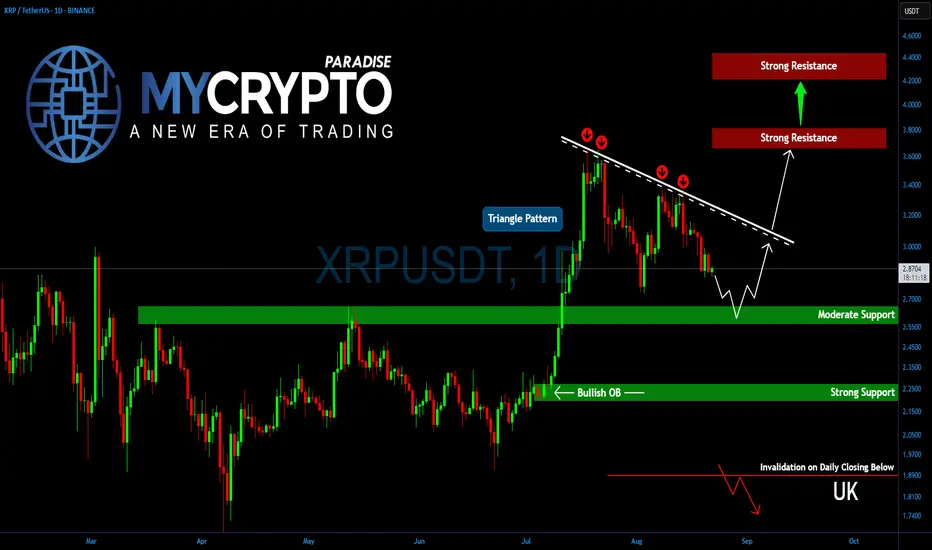
Triangle or Trap? XRP’s Next Move Could Shock TradersYello, Paradisers! Is #XRP quietly preparing for its second explosive leg? The chart is tightening fast, and the next move will decide everything.
💎XRP has been one of the strongest altcoins in this rally, holding momentum after July’s major leg up. Price action is now consolidating inside a triangle formation, which often signals continuation before the next move. This consolidation is also beginning to resemble a potential bull flag, a strong bullish setup.
💎For #XRPUSDT, the key to confirmation lies at $3.15. A breakout above the descending resistance with strong volume would trigger the second bullish leg, sending XRP toward $3.70–$3.85. If momentum carries through, the move could even extend to $4.20–$4.40, which aligns with the 161.8% Fibonacci extension.
💎On the downside, solid support sits between $2.65–$2.55. The longer price holds above this range, the stronger the base bulls will have to push higher. In the case of aggressive profit-taking, XRP could retest $2.25–$2.20, a strong support zone that is expected to withstand any deeper breakdown attempts.
Paradisers, strive for consistency, not quick profits. Treat the market as a businessman, not as a gambler.
MyCryptoParadise
iFeel the success🌴
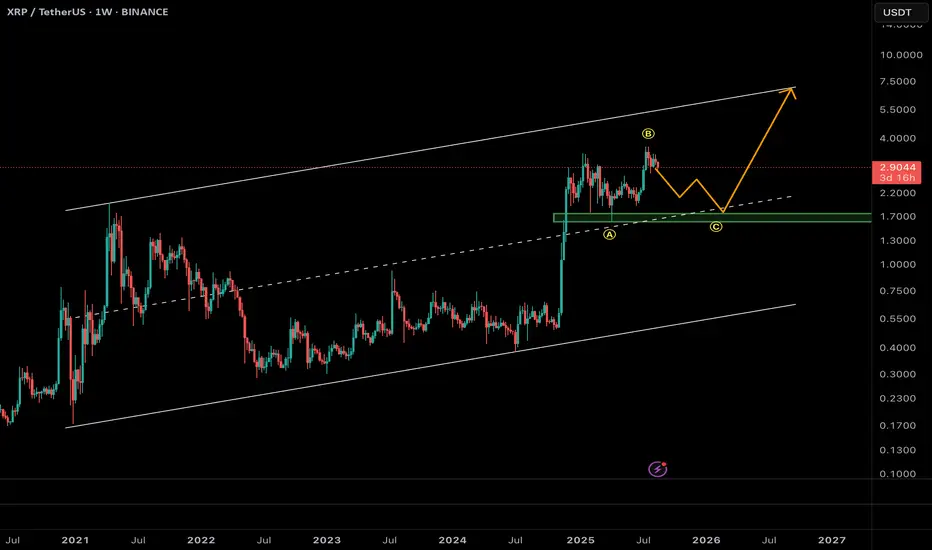
XRP – Corrective Move Before the Next Rally?XRP is currently showing signs of completing a corrective structure after its strong bullish rally earlier this year.
🔹 Technical Outlook:
• Price is trading inside a long-term ascending channel.
• After marking the swing high near $4.0, price seems to be unfolding a ABC corrective wave.
• Currently in wave C, with potential downside extension toward the midline of the channel (~$1.9 – $2.0).
• This zone also aligns with strong historical support and the 0.618 Fibonacci retracement of the last impulse (confluence area).
🔹 Possible Scenario:
1. Completion of wave C around $1.9 support.
2. Start of a major impulsive leg targeting the upper boundary of the channel around $6.5 – $7.0.
📊 Market Implication:
Short-term caution is needed as corrective pressure might continue, but long-term structure still supports a bullish outlook.
✅ Conclusion:
As long as XRP holds above $1.7 – $1.9 support zone, the bullish scenario remains valid. Mid/long-term traders may watch this level as a potential re-accumulation zone before the next impulsive rally.
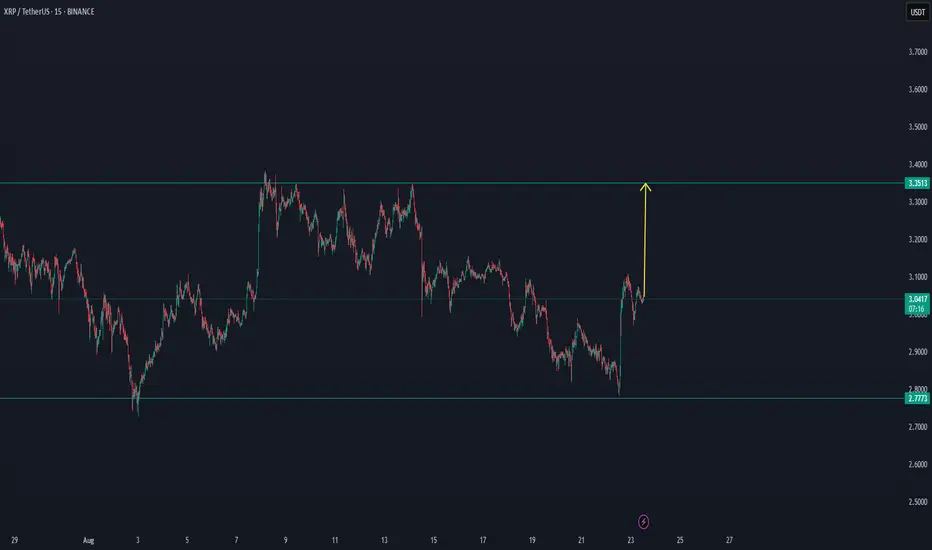
#XRP How Long To Reach 3.31 ?#XRP
The price is moving within a descending channel on the 1-hour frame, adhering well to it, and is heading for a strong breakout and retest.
We have a bearish trend on the RSI indicator that is about to be broken and retested, supporting the upside.
There is a major support area (in green) at 2.80, which represents a strong basis for the upside.
For inquiries, please leave a comment.
We are in a consolidation trend above the 100 Moving Average.
Entry price: 2.90
First target: 3.30
Second target: 3.14
Third target: 3.31
Don't forget a simple matter: capital management.
When you reach the first target, save some money and then change your stop-loss order to an entry order.
For inquiries, please leave a comment.
Thank you.
