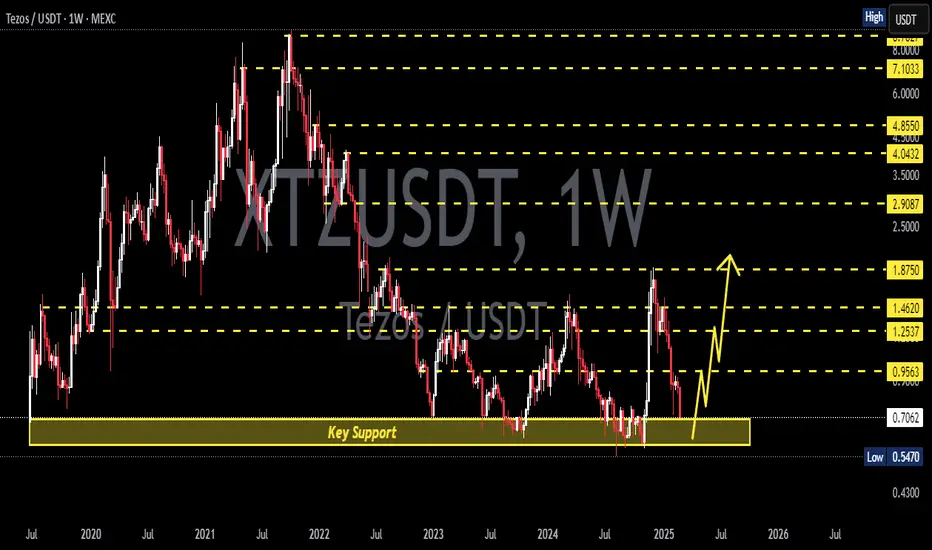
XTZ at a Critical Resistance — Breakout or Rejection?📊 Technical Analysis — CRYPTOCAP:XTZ
⏳ Time Frame: 3D
📍 Current Price: ± $0.2717
📐 Pattern: Descending Trendline
🎯 Key Resistance: $0.3400 → $0.4000 → $0.4400 → $0.6000
🛡️ Major Support: $0.2200 → $0.1915
---
📐 PATTERN ANALYSIS — DESCENDING TRENDLINE
🔻 A Descending Trendline forms when price consistently creates Lower Highs (LH) and remains below a declining trendline.
On the XTZ/USDT 3D chart, the yellow line represents dynamic resistance that has been suppressing price for an extended p
Xtzusdtperp
#XTZUSDT : Looking For Break of Structure | Bullish#XTZ
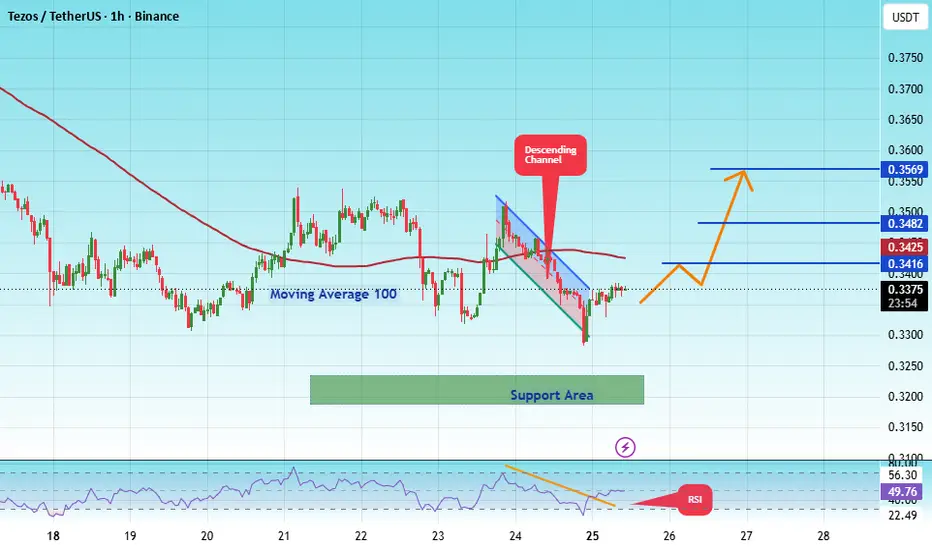
The price is moving within a descending channel on the 1-hour timeframe and has reached the lower boundary. It is now poised for a bounce and is expected to retest this boundary.
The Relative Strength Index (RSI) indicates a downward trend, which is likely to continue given the overbought conditions.
There is a key support zone (in green) at 0.3200. The price has bounced off this zone several times, making it a strong support level.
The price is trending towards the 100-period moving av
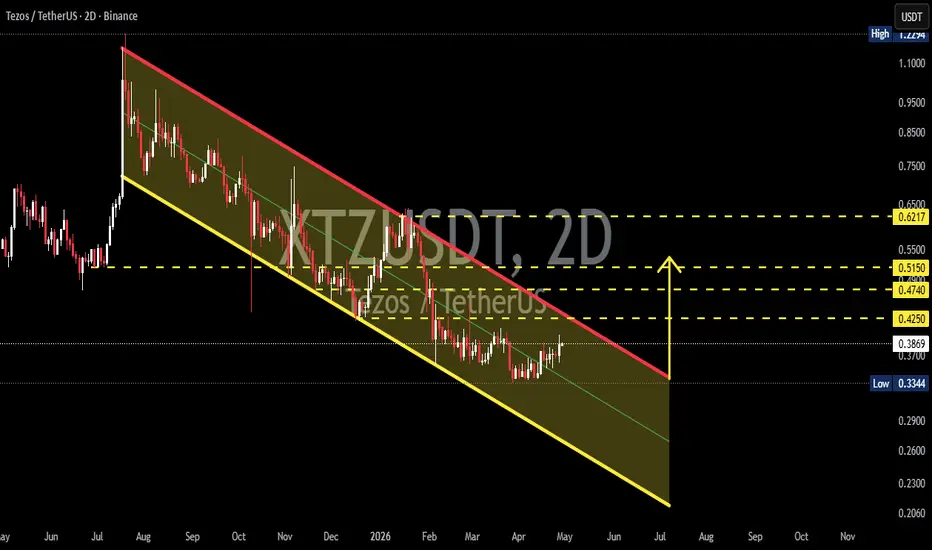
XTZ/USDT — Descending Channel, Reversal or Further Drop?On the 2D timeframe, XTZ/USDT is clearly moving within a Descending Channel pattern, characterized by:
Consistent Lower Highs (LH) and Lower Lows (LL)
A descending resistance (upper trendline) and descending support (lower trendline)
Price currently moving in the mid-to-upper area of the channel
This indicates the market is still in a downtrend structure, but signs of a potential relief bounce are emerging.
---
📐 Pattern Explanation: Descending Channel
A Descending Channel is typically
#XTZ/USDT : Looking For Break of Structure | Bullish#XTZ
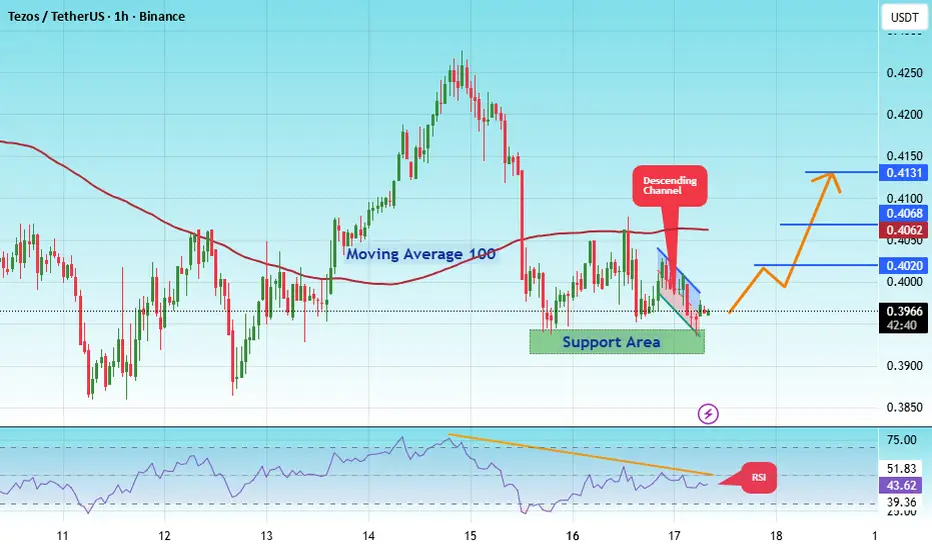
The price is moving within a descending channel on the hourly timeframe. It has reached the lower boundary and is heading towards a breakout, with a retest of the upper boundary expected.
The Relative Strength Index (RSI) is showing a downward trend, approaching the lower boundary, and an upward bounce is anticipated.
There is a key support zone in green at 0.3934, and the price has bounced from this level several times and is expected to bounce again.
The indicator is showing a trend t
#XTZ failed to stabilize above the S/R line📊#XTZ failed to stabilize above the S/R line ⚠️
🧠From a structural perspective, we failed to stabilize above the S/R line, therefore no buy signal was generated here. Meanwhile, a bearish structure exists above, and the target area of this structure overlaps with the lower low L and the trend support line. Therefore, this area is considered an excellent entry point for long positions and deserves our attention.
Let's see 👀
🤜If you like my analysis, please like 💖 and share 💬
BINANCE:XTZUSD
#XTZ Falling Wedge📊#XTZ Falling Wedge 🚀
🧠From a structural perspective, we've been in a downtrend on larger timeframes. The price is currently approaching its limit of consolidation; closely watch for a breakout and subsequent upward move.
➡️Currently near a resistance zone, if the price can return to the lower yellow support zone (S/R), we can look for long positions to potentially capitalize on a larger upward move.
Let's see 👀
🤜If you like my analysis, please like 💖 and share 💬
BINANCE:XTZUSDT.P
XTZ/USDT - Breakout: Relief Rally or Trend Continuation?XTZ/USDT on the Daily (1D) timeframe remains in a medium-term downtrend, clearly structured within a Descending Channel. Price action continues to respect this bearish structure, while the recent bounce from the lower boundary indicates a short-term relief rally rather than a confirmed trend reversal.
Volume remains relatively stable without significant expansion, suggesting that bullish momentum is still limited and primarily technical.
---
Pattern Explanation
Descending Channel (Bearish C
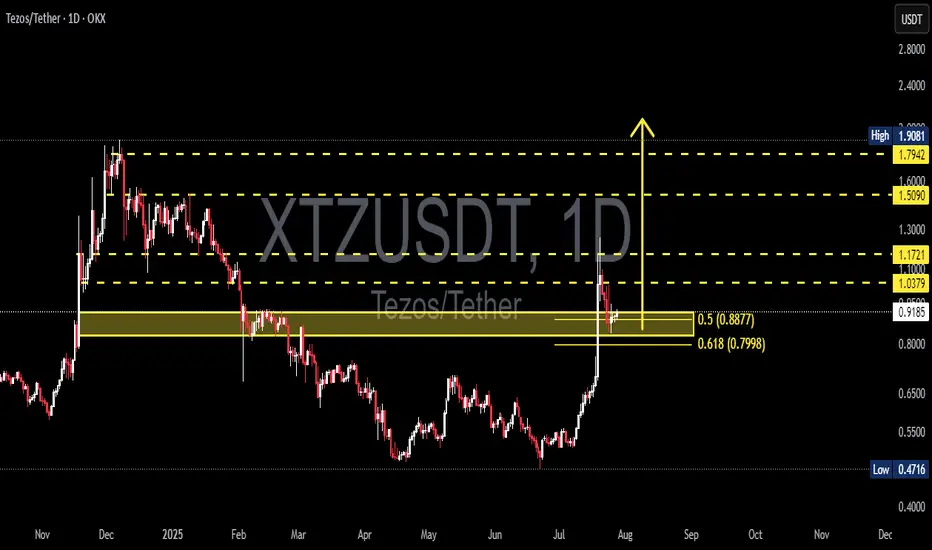
XTZUSDT Fibonacci Retest and Rebound Potential: Is Tezos Ready?Detailed Analysis of XTZ/USDT Chart (Daily Timeframe):
The XTZUSDT pair (Tezos vs USDT) has shown strong momentum following a breakout above previous support zones, with a sharp rally toward $1.17 before retracing.
Currently, the price is testing the Fibonacci Retracement levels, specifically the 0.5 ($0.8877) and 0.618 ($0.7998) zones — which also align with a key previous demand zone. This zone is critical for determining the next directional move.
---
🟢 Bullish Scenario:
If the price hol
XTZ Is Waking Up – Next Stop $2.25?SEED_DONKEYDAN_MARKET_CAP:XTZ is currently bouncing from the lower boundary of a broadening wedge pattern on the weekly chart, signaling a potential trend reversal. This structure, characterized by widening price swings, has been developing since mid-2022.
The recent bullish move has pushed the price above a key resistance zone, with rising volume supporting the momentum. The upper boundary of the wedge aligns with the next major target zone near $2.25.
Resistance 1: $1.00
Resistance 2: $1.4
XTZ/USDT Ready for a Massive Breakout After Prolonged Downtrend!Technical Analysis (1D Timeframe):
The XTZ/USDT pair is forming a well-defined descending triangle pattern, with sustained selling pressure since late 2024. However, the price action is now signaling a potential breakout as it approaches the apex of the triangle, supported by a strong accumulation zone around $0.4720–$0.5247.
🔍 Analysis Details:
Descending Trendline Resistance: Price has repeatedly failed to break above the descending resistance line since December 2024. It is now testing the
Tezos XTZ price “finally” shoot outOldies here?) Do you remember that there was such a coin as #XTZ ?)
Yes - yes - this is the “stick” that shoots once a year and falls 3y)
It's hard to believe that the current growth of the OKX:XTZUSDT price will be above $1.58-1.78
Therefore, this idea will probably be more interesting for #Tezos holders
Although.... maybe we don't know something about the bright future of this project ?)
_____________________
Did you like our analysis? Leave a comment, like, and follow to get more
#XTZ/USDT#XTZ
The price is moving in a 4-hour channel and sticking to it well
The price rebounded well from the lower border of its neck at the green support level of 0.910
We have a tendency to stabilize above the Moving Average 100
We have oversold resistance on the RSI indicator to support the rise, with a downtrend about to break higher
Entry price is 0.910
The first goal is 0.980
Second goal 1.053
Third goal 1.12
Fourth goal 1.20
XTZ/USDT: Preparing for a Strong Bullish MoveXtz/usdt is showing strong bullish potential as it breaks out of its consolidation box on the weekly time frame. This breakout could signal the start of a significant upward trend, especially since these box patterns have been performing well in recent setups.
Key observations:
- The breakout above the box indicates a shift in momentum, with buyers gaining control.
- Momentum indicators such as RSI and MACD are turning positive, adding confidence to the bullish case.
- Increased volume
Tezos XTZUSDT price is at a critical point, where to go next?Here is the whole trading history of the once quite popular pair XTZUSDT
The XTZ price grew skillfully during 2019-2021 from $0.35 to $9
And then a stable downward trend, which has been going on for more than a year
Now the XTZUSD price is at a critical point.
If buyers can gain a foothold above $0.75 , there will be a good chance of working out the blue scenario. In the medium term, it is the growth to the liquidity zone of $1.20-1.80
If sellers do not meet resistance from Tezos buyers,
XTZ/BTC Bottom is in?Hi folks, welcome back to RS_Crypto Analysis. It appears that the XTZ/BTC pair has been forming a falling wedge pattern for 1659 days. Based on this analysis, it is possible that the current price represents a bottom for the pair. It is expected that the XTZ/BTC pair may see an upward movement within the next 1-3 months.
XTZ/USDT - LONG ----- Welcome, dear followers! -----
- Here is my trading methodology. I trade with a normal system and analysis of resistance and support, as well as price reversal patterns.
- For the record, I do not place a stop loss within my trades. So that I only risk 1.5% of my total capital in order to support the loss due to a price reversal against me.
- If a price reversed against my expectation and touched the drawn line r3, then I transferred targets to the entry point and waited for the price to c
XTZUSDT Long SignalXTZUSDT has made some clear moves in the near-past and it has confirmed the Short term confirmation, which is clearly seen in the chart. It's just a matter of time for it to gain momentum and go sky-rocketing in the upward direction. I am fully bullish on XTZUSDT and currently my setup for $XTZ is as follows:
Entries : 1.21 - 1.40
One time Entry: 1.34
Short Term: 1.42 - 1.52 - 1.60 - 1.72 - 1.85 - 1.94
Mid Term: 2.10 - 2.48 - 2.93 - 3.58 - 4.72 - 6.08
1.08 - 1.02 (Trailing)
Please be