Predictions and analysis
As April unfolds, investors and traders in the corn futures market find themselves at a critical juncture marked by seasonal trends and heightened volatility. Historically, April has been a period of growth in corn prices, driven by various factors including planting intentions, weather conditions, and demand patterns. However, the current landscape presents a...
It is official. Inflation is back. But not everywhere. Food inflation is on the decline. All three major crops, Soybean, Wheat, and Corn have declined substantially. Bearish sentiments rings loud across agri with ample supplies combined with solid harvest expectations. Among crops, corn has fared best. Its prices have not declined as much. Corn outlook is...
Corn's (ZC1!) price action since the COVID recovery in early 2020 is showcasing an amazing resemblance with the previous full Cycle of 2009 - 2014. This is better illustrated on the 1M (monthly) time-frame. Both started the Bull phase on a roughly +175% rebound on the 17 year Support Zone, topping on a Higher Highs (which was a Bearish Divergence with the Lower...
Here I am neutrally bullish, we see a (possible) double bottom, which if it breaks the next level of resistance, could bring buyers and even greater interest. On the other hand, we must take into account that this correction is normal for grain, taking into account that the situation in Ukraine has calmed down and grain exports have resumed, thus all that growth...
10yr Corn outlook: 1 thought (of many) on the potential course of the corn market for the next 10 years. I feel the job of the current market is to find a price high enough to ration future demand. Could be current price, 8.50, or 9.50. The potential is there for any of those numbers to mark a major swing high for Corn. The higher that mark is nearby, the...
Corn Fundamentals ( CBOT:ZCZ2023 ) Corn Harvest Progress 🚜➡️🌽 ▓▓▓▓▓▓▓▓▓░░░░░░ 59% Export Inspections 🚢➡️🌎 437,549 Metric Tons ⬇️ 29,055 Metric Tons week vs. last week ⬇️ 22,514 Metric Tons this week vs. this week last year ⬇️ 370,24 Metric Tons this week vs. 5-year average Export Sales 16,176,285 Metric Tons (Cumulative, Current Marketing Year) ⬆️...
Last week, we were looking for a potential bottom in corn. Since then, we’ve mostly traded sideways to slightly higher. However, the end of this week brings a “triple-witching” event - the end of the month, the end of the fiscal quarter, and the quarterly grain stocks report all occur on Friday. In last quarter’s grain stocks report, the market sold off fairly...
In this idea, I am trying to read and forecast the behavior of the chart in the next 4.5 months . I do not follow corn production, harvest, demand, etc. Since April 2022 (its 9-year highs) has lost about 40% . Its relatively long-going bearish trend means that most of the drop likely has happened. Let's quickly study previous drops that lasted more than a year...
Corn has continued to sell off over the last few days and is now approaching our blue buy zone from USX 496 to USX 470. The downward movement in the form of the blue wave (b) should end there. Subsequently, we expect the blue wave (c) to rise to around USX 600, making it worthwhile for prospective buyers to place long orders in our blue buy zone. Our alternative...
Continuous Corn – Weekly: (Busy Chart) Currently in a sideways grinder going into an acres battle and Weather Market. Do not hesitate to Make decisions. The Red downtrending pitchfork controls the trend. Nearby resistance against the upper red line is set up with the 6.93 retracement target but volume by price resistance at 6.75-6.80. If the red line is broken...
You know the “It’s Corn” song trending on TikTok? It brings a smile to our face every time we hear it. But if you look at Corn’s price chart and fundamental outlook, that’s a whole other story… Corn’s recent breakout of a symmetrical triangle towards the downside caught our attention. With the clear break and an ensuing retest, Corn is now trading right on...
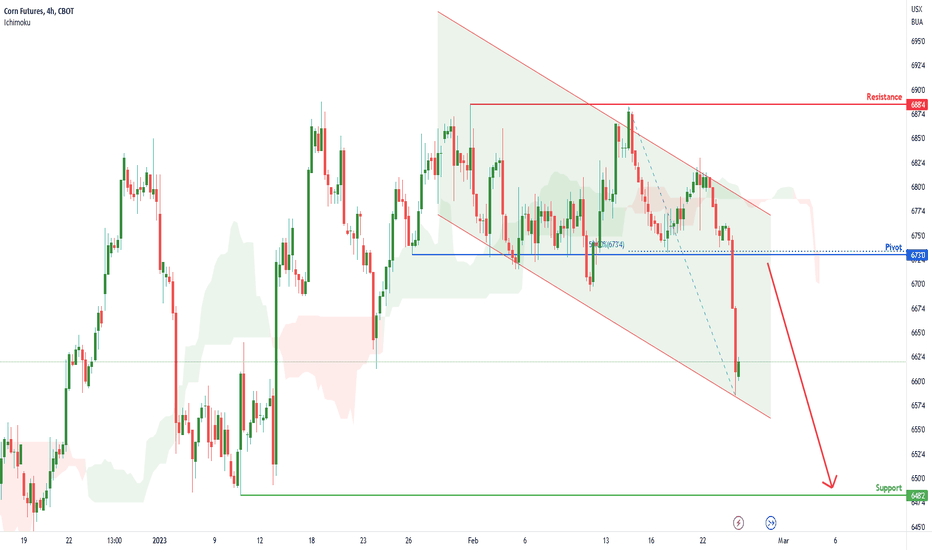
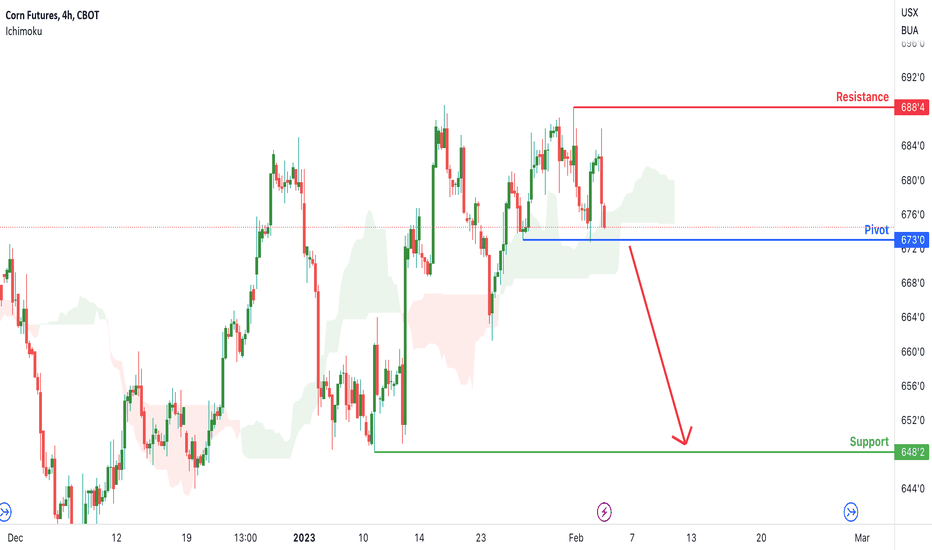
Title: Corn Futures ( ZC1! ), H4 Potential for Bearish Drop Type: Bearish Drop Resistance: 688.50 Pivot: 673.00 Support: 648.25 Preferred case: Looking at the H4 chart, my overall bias for ZC1! is bearish due to the current price crossing below the Ichimoku cloud, indicating a bearish market. To add confluence to this bias, price is also within a descending...
Title: Corn Futures ( ZC1! ), H4 Potential for Bearish Drop Type: Bearish Drop Resistance: 688.50 Pivot: 673.00 Support: 648.25 Preferred case: Looking at the H4 chart, my overall bias for ZC1! is bearish due to the current price crossing below the Ichimoku cloud, indicating a bearish market. If this bearish momentum continues, expect price to possibly head...
Title: Corn Futures ( ZC1! ), H4 Potential for Bullish Continuation Type: Bullish Continuation Resistance: 706.50 Pivot: 6681.00 Support: 673.00 Preferred case: Looking at the H4 chart, my overall bias for ZC1! is bullish due to the current price being above the Ichimoku cloud, indicating a bullish market. If this bullish momentum continues, expect price to...
Title: Corn Futures ( ZC1! ), H4 Potential for Bullish Rise Type: Bullish Rise Resistance: 706.50 Pivot: 688.75 Support: 661.25 Preferred case: Looking at the H4 chart, my overall bias for ZC1! is bullish due to the current price being above the Ichimoku cloud, indicating a bullish market. If this bullish momentum continues, expect price to possibly head towards...
Title: Corn Futures ( ZC1! ), H4 Potential for Bearish Drop Type: Bearish Drop Resistance: 671.75 Pivot: 660.00 Support: 636.00 Preferred case: Looking at the H4 chart, my overall bias for ZC1! is bearish due to the current price being below the Ichimoku cloud, indicating a bearish market. If this bearish momentum continues, expect price to possibly continue...
Looking at the H4 chart, my overall bias for ZC1! is bearish due to the current price being below the Ichimoku cloud, indicating a bearish market. Looking for a sell stop entry at 648.50, to catch the bearish momentum. Stop loss will be placed at 664.00, where the recent high is. Take profit will be at 635.00, where the previous swing low is. Please be advised...


