Update XAUUSDAccording to our analysis, we said that if that large bearish candle failed to confirm continuation, the trend could turn bullish. We saw that it didn’t confirm, and now the price is moving in a range. It’s also getting close to completing the time correction of the previous wave, so we should expect a potential bullish move on gold.
With a stop order at 4.246, it could be a good option to avoid missing that sharp move.
Futures market

Gold Bulls Suppressed Repeated Tests of 4200Gold continued to fluctuate between 4190 and 4240 today, with 4200 being repeatedly tested. This range is expected to be broken soon, as the main support level has been rising over time, currently around 4198. If this level is broken, I expect the price to fall below the low of 4163, reaching the 4150-4130 range. If the price drops rapidly to this area, a rebound is likely, similar to the market reaction after today's data release, although the rebound may not be as significant. Of course, this also needs to be considered in conjunction with news developments.
Therefore, we need to adjust our trading strategy. We should lower the buying range to below 4170, and at the same time, we should lower the selling range to above 4200.

Latest Gold Price Trading Strategies:
I. Overall Market Trend Overview
The gold market has entered a clear phase of wide-range consolidation, with both bulls and bears showing hesitation before key market developments become clear. This consolidation pattern reflects market uncertainty while also providing a clear framework for range-bound trading. Overall, gold has lost its short-term unilateral momentum and shifted into a phase of high-level consolidation.
II. In-Depth Technical Analysis
Multi-Timeframe Technical Resonance Analysis
Daily Chart: A small doji candle formed at a high level, with the closing price below the upper Bollinger Band, indicating a temporary exhaustion of upward momentum but no clear reversal signal yet.
4-Hour Chart: Following the pressure from the high of 4264, a consecutive bearish retracement is observed. However, frequent long lower-shadow candles during the decline suggest some buying support below.
Key Technical Characteristics:
The short-term moving average system has formed a death cross.
The MACD indicator has also formed a death cross, entering a bearish expansion phase.
The price has broken below the support of the 4-hour middle Bollinger Band, indicating a technically weak bias.
Key Price Level Analysis
Resistance Levels:
Strong Resistance: 4230
Secondary Resistance: 4215–4220 (short-term technical pressure zone)
Psychological Resistance: 4203 (previous support/resistance conversion level)
Support Levels:
First Support: 4150–4155
Second Support: 4145
Core Support: 4130
III. Trading Strategy Plan
Trading Approach: Sell high, buy low, with a clear primary and secondary focus.
Primary Direction: Focus on selling during rallies.
Secondary Direction: Consider short-term buying near key support levels.
Trading Rhythm: Remain flexible within the range, avoid excessive chasing.
Specific Execution Strategies:
Short Position Setup
Entry Zone: 4210–4220
Risk Control: Unified stop-loss above 4235
Target Levels:
First Target: 4180–4170
Second Target: 4155 (testing key support)
Extended Target: 4140 (consider after a breakout)
Long Position Setup
Entry Zone: 4140–4150
Risk Control: Strict stop-loss below 4130
Target Levels:
First Target: 4180–4190
Second Target: 4200 (testing the upper range limit)
IV. Key Risk Control Points
Position Management: Avoid excessive position sizing during consolidation.
Stop-Loss Discipline: Always preset stop-losses; strictly avoid holding losing positions. Place stop-losses outside key resistance/support levels.
Dynamic Adjustments:
Monitor breakout situations at key levels 4155 and 4230.
If 4155 is effectively broken, consider adding short positions after a rebound.
If 4230 is unexpectedly broken, reassess the market direction.
Time Windows:
Focus on price reactions during the U.S. trading session.
Adopt a wait-and-see or light-position approach during the Asian and European sessions.
V. Key Market Focus Points
Catalysts from News: Pay attention to U.S. economic data and speeches from Federal Reserve officials.
Dollar Correlation: Closely monitor the impact of U.S. dollar index movements on gold.
Market Sentiment: Observe changes in the VIX index to assess shifts in safe-haven demand.
VI. Summary and Recommendations
Today’s gold trading strategy centers on selling high and buying low within the range, with a clear hierarchy—selling during rebounds as the primary approach and short-term buying at key support levels as the secondary strategy. Maintain patience during trading, wait for ideal entry points, and avoid chasing prices in the middle of the range.

XAUUSD: Bearish Drop to 3885?OANDA:XAUUSD is eyeing a bearish reversal on the daily chart , with price testing resistance near ATH levels after recent rebounds from support, converging with cumulative sell liquidation and a potential entry zone that could spark downside momentum if sellers defend the highs. This setup suggests a pullback opportunity amid the ongoing uptrend, targeting lower support levels with strong risk-reward exceeding 1:3.
Entry between 4280–4340 for a short position (entry from current levels with proper risk management is recommended if price reaches the zone). Target at 3885 . Set a stop loss at a close above 4400 , yielding a risk-reward ratio of more than 1:3 . Monitor for confirmation via a bearish candle close below entry with rising volume, leveraging gold's volatility near peaks.🌟
Fundamentally , gold prices are hovering around $4,207–$4,222 per ounce as of December 3, 2025, after a 0.5% daily gain and a 7.37% rise over the past month, driven by safe-haven demand amid geopolitical tensions and expectations of Fed rate cuts. However, forecasts for 2025 suggest potential volatility with upside to new highs like $4,000+ in the longer term, though short-term corrections could emerge due to overbought conditions, central bank policies, and inflation dynamics. 💡
📝 Trade Setup
🎯 Entry (Short):
4280 – 4340
(Entry from current levels is valid if price reaches the zone with strict risk management.)
🎯 Target:
• 3885
❌ Stop Loss:
• Daily close above 4400
⚖️ Risk-to-Reward:
• >1:3 overall
💡 Your view?
Will gold reject this ATH resistance zone for a deeper correction — or break higher into new territory?
👇 Share your thoughts below! 👇

Gold Puts *I am in no way a financial advisor and you should always do your own due diligence before placing any trade. Do not trade what you are not comfortable with losing. No trade is guaranteed.
Sell down to 4,000 price area

[WEEKLY] ANFIBO | Gold XAUUSD - Purple or Gray? [11.24 - 11.28]Hi guys, Anfibo’s here!
XAUUSD Weekly Trading Plan
Overall Picture:
OANDA:XAUUSD is entering a critical phase as price continues to consolidate within a tightening structure, signaling that a major directional move is likely to occur next week. After a period of strong volatility, the market is now compressing energy between the upper and lower boundaries of the current range. This setup is textbook for a break–retest–continuation model, and that’s exactly why my strategy for the upcoming week revolves around two clear scenarios: the “purple arrow” plan and the “grey arrow” plan.
The market will reveal its next major direction once either the upper boundary is broken or the lower boundary gives way. Until that happens, there is no reason to pre-commit to a biased direction — we trade what price confirms, not what we predict.
Trading Plan for Next Week:
We will react based on breakout confirmation:
>>> Scenario #1: Break ABOVE the range – Follow the “Purple Arrow” plan (BUY)
If gold pushes through the upper boundary with strength and confirms a retest, we will switch to a bullish continuation plan.
Key Resistance Levels to Watch: 4147, 4243, 4340, 4356, 4377.
A clean break above structure opens the path back into macro bullish territory, where gold may attempt to revisit or even surpass recent highs.
>>> Scenario 2: Break BELOW the range – Follow the “Grey Arrow” plan (SELL)
Once price breaks and retests the lower boundary, we will look for sell setups targeting the ladder of support levels outlined below.
Key Support Levels to Watch: 4000, 3917, 3890, 3862, 3820, 3793, 3760
A bearish breakout from the range could trigger a multi-wave continuation pattern, giving us multiple opportunities to scale in according to structure.
Risk Management:
Trade only after confirmed breakouts — avoid guessing tops and bottoms.
Keep tight SLs on retests to avoid liquidity hunts common during range boundaries.
Maintain Risk:Reward ≥ 1:2 across all setups.
Prioritize clean structure; avoid trading inside the choppy middle zone of the range.
Reassess bias immediately if the breakout fails or re-enters the range.
Conclusion:
Next week’s market will be all about patience and reaction, not prediction. With gold coiling tightly, a breakout is imminent, and both the “purple arrow” (bullish) and “grey arrow” (bearish) plans give us a clear and disciplined roadmap. Whether price breaks upward or downward, we already know exactly where our key levels are and how we will execute. Stick to structure, wait for confirmation, and let the market choose the direction for us.
HAVE A POWERFUL NEW WEEK, GUYS!

Gold buy idea Gold Analysis
Gold stopped dropping since yesterday’s NY open. It continued falling during today’s Asia and London sessions, but failed to continue the drop into the Asia close, showing signs of weakening bearish momentum.
How to Trade It
1️⃣ Wait for price to drop to 4210
4210 is the closest psychological level and a key reaction zone.
2️⃣ Look for entry confirmation
At 4210, wait for either:
A bullish engulfing candle
A bullish pin bar
with above-average volume
This signals strong buyers defending the level.
If Price Does NOT Retrace to 4210
If gold continues rising without touching 4210, then:
Check the volume
If volume is above average, this confirms bullish continuation without a retest.
Targets
TP1: 4245
TP2: 4265
Invalidation
❌ If price drops to 4210 but none of the confirmations appear, do not take the trade.

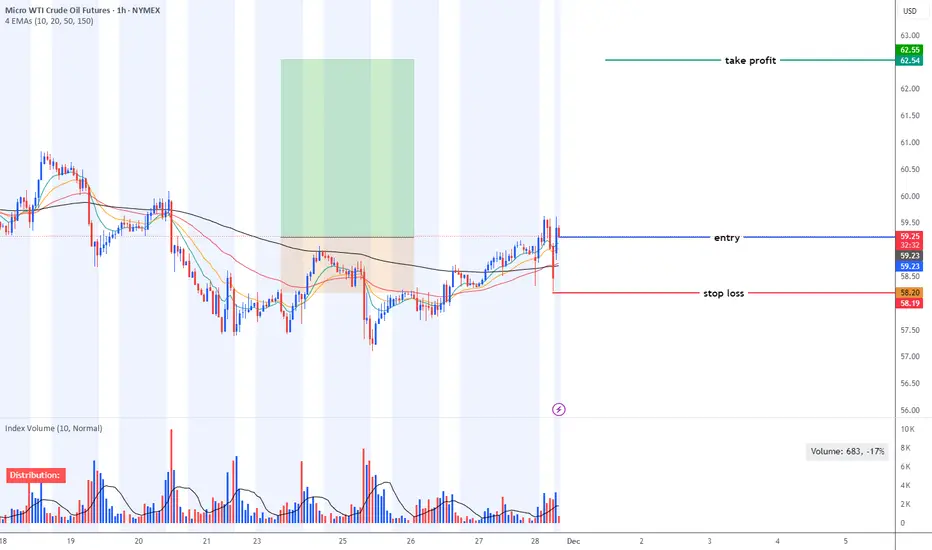
MCL - swing trade opportunity based on technical analysisMCL - swing trade opportunity based on technical analysis.
Gold Analysis & Trading Strategy | December 3–4✅ 4H Chart (H4) Trend Analysis
1️⃣ Clear high-level consolidation on H4
During today’s U.S. session, gold surged to 4241.55, then pulled back quickly.
It failed to break the previous high 4264, indicating weakening bullish momentum.
The decline touched 4195, then rebounded strongly, showing solid institutional buying below, a typical high-level sideways + two-way washout phase.
2️⃣ Bollinger Bands Structure:
Middle band (≈4204–4206) is now the key support & bull-bear divider.
Upper band near 4256 was approached but not broken → strong resistance remains.
Lower band at 4181 has held multiple times → short-term bottom strengthening.
➡️ As long as H4 holds above the middle band 4204, gold maintains a bullish bias.
✅ 1H Chart (H1) Trend Analysis
1️⃣ Sharp rise → sharp drop → secondary rebound pattern
Gold was rejected at 4241, dropped straight to 4195 → bearish pressure released.
Then it quickly rebounded to 4210 → short-term bulls are fighting back.
This is a classic “stop-hunt spike → bottoming rebound” structure, not a bearish reversal.
2️⃣ Bollinger Bands (H1)
▪ Lower band (≈4194) successfully supported the price → valid support
▪ Middle band (≈4212) is the first resistance for short-term bulls
▪ Upper band (≈4230–4235) remains strong resistance
🔴 Resistance Levels:
▪ 4215–4220 (H1 MA20 + H4 moving-average cluster)
▪ 4230–4234 (H1 Bollinger upper band)
▪ 4250–4256 (H4 upper band + major resistance area)
🟢 Support Levels:
▪ 4195–4188 (strong U.S. session demand zone)
▪ 4185–4175 (key support; break = bearish)
▪ 4163 (confirmed swing low)
✅ Trading Strategy Reference
🔰 Main Strategy: Buy on Dips (short-term bullish bias)
🟠 First Buy Zone: 4195–4188
🎯 Targets: 4215 / 4230
⛔ Stop-loss: below 4178
🟠 Second Buy Zone: 4185–4175
🎯 Targets: 4230 / 4250
⛔ Stop-loss: below 4168
🔰 Secondary Strategy: Short on Rejections (short-term only)
🟠 First Sell Zone: 4215–4220
Enter light shorts if ANY of the following appear:
▪ Long upper wick
▪ Bearish 1H candle
▪ Weak breakout with low volume
🎯 Targets: 4195 / 4185
⛔ Stop-loss: above 4228
🟠 Second Sell Zone: 4230–4250 (major resistance zone)
🎯 Targets: 4195 / 4185
⛔ Stop-loss: above 4265
📌 Trend Summary
1️⃣ Today’s high 4241.55 = major resistance confirmed
2️⃣ Strong rebound after dropping to 4195–4188 → buyers active
3️⃣ Short-term structure = range-bound but bullish-tilted
4️⃣ 4215–4220 is the key breakout zone
5️⃣ Break above 4220 → targets 4234 / 4250
6️⃣ Break below 4175 → retest 4163
7️⃣ Medium-term bullish structure remains solid; current move is strong consolidation correction
🔥Trading Reminder: Trading strategies are time-sensitive, and market conditions can change rapidly. Please adjust your trading plan based on real-time market conditions.

XAUUSD MANIPULATION TRACKERThis is a chart i put together so you can watch how traps and liquidation works in gold.

GOLD 4H CHART ROUTE MAP UPDATE & TRADING PLAN FOR THE WEEKHey Everyone,
Please see our 4h chart remaining levels and targets for the coming week with one updated Goldturn.
We are now seeing price play between two weighted levels with a gap above at 4224 and a gap below at 4124. We will need to see ema5 cross and lock on either weighted level to determine the next range.
We will see levels tested side by side until one of the weighted levels break and lock to confirm direction for the next range.
We will keep the above in mind when taking buys from dips. Our updated levels and weighted levels will allow us to track the movement down and then catch bounces up.
We will continue to buy dips using our support levels taking 20 to 40 pips. As stated before each of our level structures give 20 to 40 pip bounces, which is enough for a nice entry and exit. If you back test the levels we shared every week for the past 24 months, you can see how effectively they were used to trade with or against short/mid term swings and trends.
The swing range give bigger bounces then our weighted levels that's the difference between weighted levels and swing ranges.
BULLISH TARGET
4224
EMA5 CROSS AND LOCK ABOVE 4224 WILL OPEN THE FOLLOWING BULLISH TARGET
4328
EMA5 CROSS AND LOCK ABOVE 4328 WILL OPEN THE FOLLOWING BULLISH TARGET
4422
EMA5 CROSS AND LOCK ABOVE 4422 WILL OPEN THE FOLLOWING BULLISH TARGET
4494
BEARISH TARGETS
4124
EMA5 CROSS AND LOCK BELOW 4124 WILL OPEN THE FOLLOWING BEARISH TARGET
4042
EMA5 CROSS AND LOCK BELOW 4042 WILL OPEN THE SWING RANGE
3964
3873
As always, we will keep you all updated with regular updates throughout the week and how we manage the active ideas and setups. Thank you all for your likes, comments and follows, we really appreciate it!
Mr Gold
GoldViewFX

Gold | Zone-Based High-RR Long Setup | Bullish BiasGold | Zone-Based High-RR Long Setup | Bullish Bias
I currently carry a bullish bias on Gold. Price is approaching a pre-defined demand zone marked on the chart — this is a reaction area, not a prediction. I only engage after confirmation from within the zone. If the zone holds, continuation toward the marked resistance is expected. If it fails, the idea is invalidated immediately. IT WORKS 90% OF THE TIMES THOUGH!
This setup is independent of session or time. Execution, risk management, and psychology decide the outcome — analysis only provides the framework. Risk is always predefined. No chasing. No emotional trades.
Trade the zone. Manage the risk. Let the market do the rest.
Happy Trading.

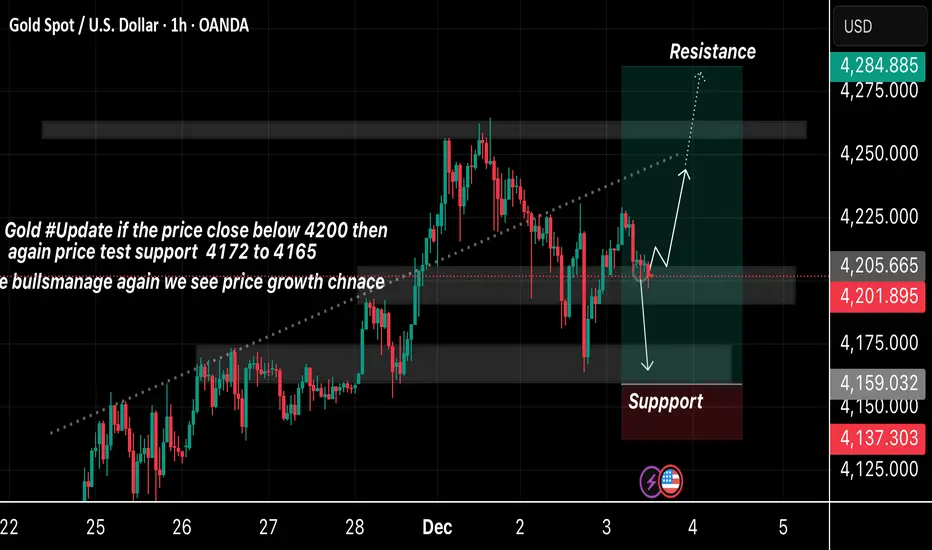
Gold Price Update – Clean & Clear ExplanationGold the market is trading around the 4200 zone, which is an important level.
✅ If the price closes below 4200, it may fall toward the support area between 4172 and 4165.
✅ This zone is highlighted as a strong support, where buyers have previously stepped in
✅ If the support holds and buyers regain control, the price may bounce upward again, giving a new chance for bullish growth
✅ On the upside, the next major resistance area is marked near 4242–4284 where the price could face selling pressure.
Overall, the chart outlines both possible scenarios a drop toward support if 4200 breaks, or a bullish move toward resistance if buyers maintain strength.
If you find it helpful please like and comments for this post and share thanks.
Gold 13 nov 2025 Sell PlanGold 13 nov 2025 Sell Plan
expecting move expected.
we have sitting liqudity below PDL.
m15 Mss Hapend i will sell till target below.

Everyone should just buy and sell simultaneously.Let the Wednesday crash. Seem like they didn't want to let the direction go.

#xauusd #gold ABC Pattern ? ABC PATTERN Potential Short Opportunity?
Yes — there could be a short opportunity on XAU/USD if you clearly see a valid ABC / ABCD reversal pattern near resistance, and macro conditions support USD strength or lower risk-off demand.
However, given gold’s recent broader strength and macro back-and-forth (rate expectations, safe-haven demand, etc.), the trade carries significant risk. I’d treat any short as a speculative, tactical trade — more like a trade within a range or correction, not a long-term bearish bet.
Recent technical/fundamental context suggests there could be a bearish scenario:
According to one recent analysis, gold is facing “selling pressure above $4,200” as the U.S. dollar rebounds — meaning upside is being limited and sellers are stepping in.
Another source notes that after recent highs, a pullback to near $4,164 tested the upper line of the long-term rising channel, which has now become support.
Some short-term forecasts suggest consolidation/uncertainty: price ranges, neutral momentum indicators, making a reversal / corrective move plausible rather than continuation.
If on a chart one identifies a clear ABCD-type setup (AB up, BC retracement, CD upward retracement completing near a resistance zone), that could be a reasonable point to consider a short entry — especially if macro/fundamental factors (stronger USD, higher rates, weak safe-haven demand) align.
Also broader sentiment/technical-news: some gold-specific recent reports highlight short-term bearish pressure or risk of correction — which supports a cautious or short-bias view near resistance zones.

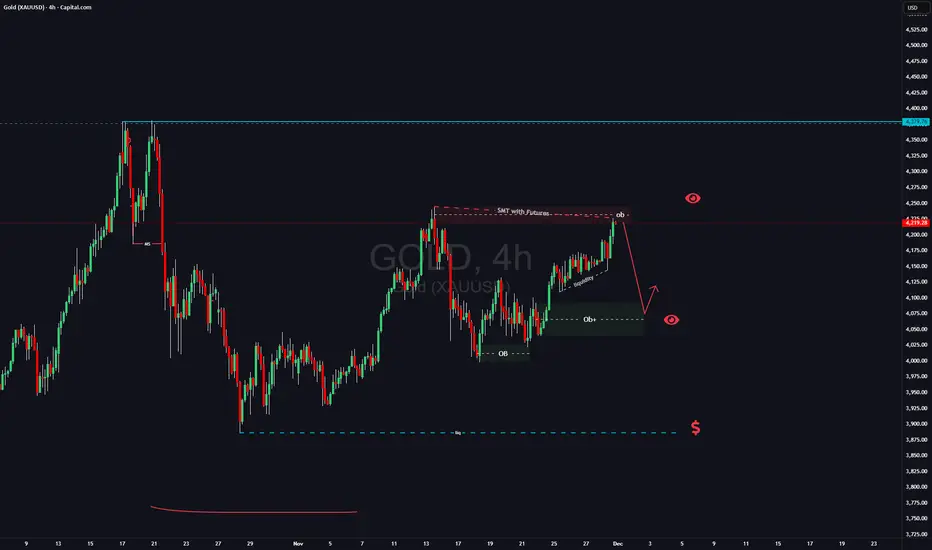
GOLD SETUP: The Liquidity Grab That Could Change Your Month!There is intresting situation on Gold right now:
1) There is SMT with futures(on futures price went higher than previous high from November 13th
2) Have a lot of liqudiity down below which usually means that this liqudiity will be taken
3) strong uptrend on LTF
taking in consideration these factors and that it will be beginign of the month on Monday i will be looking for manipulation at market opening. If i see trend shift on LTF i will be looking for short position till 4110 area (4h OB) , if this wont happen i simply gonna skiip trading GOLD this week.
When price action is not clean and when its hard to see clear picture better to avoid such trade and just watch.
Like and follow if you like my analysis
Going Short On Gold After price wiped out everyone on the sell side, it went on to break the high of the day. From there, price dropped back into the same resistance zone, slipped below it, and formed a clear M-pattern (double top). It then retested the neckline perfectly, confirming the setup. With this structure in place, I’m expecting a strong sell-side move from here.

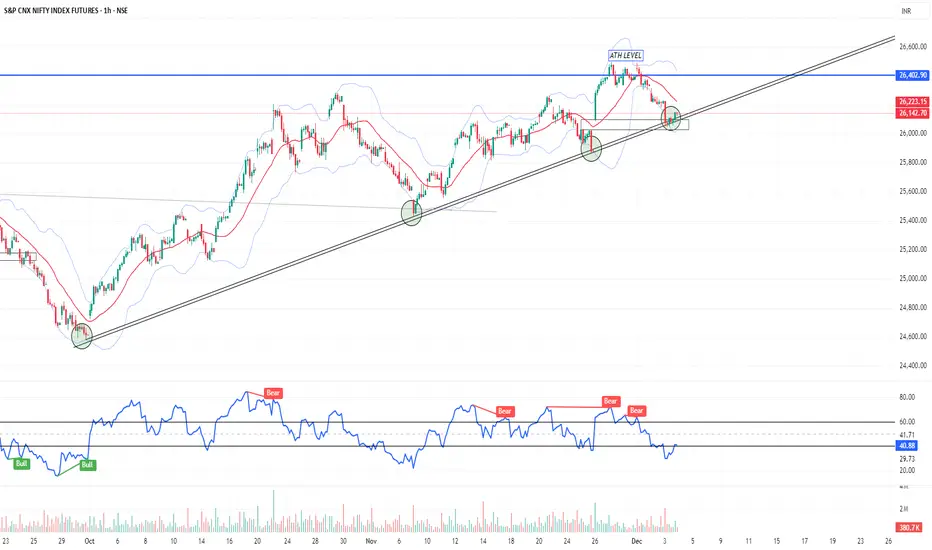
Key Confluences:NIFTY Futures Technical Setup – Trendline + Gap + 0.618 Fib Support
- Ascending trendline (4th retest)
- Gap-fill zone providing demand
- RSI near oversold and bouncing
- Fibonacci 0.618 golden ratio adds strength
Silver traded sideways with resilience; strategy update:
We precisely entered a long position near $56.8, and the price rebounded above $58, ultimately resulting in substantial profits. This isn't just talk; it's proven real-world experience. This trade was truly brilliant; you can check our historical recommendations to verify its accuracy.
In trading, we strictly adhered to a strategy based on professional analysis, carefully controlling the pace. Although the price briefly broke below the key support level of $57, we remained patient and utilized professional analytical methods. Ultimately, the price successfully rebounded to our pre-set profit-taking range. All operations ultimately achieved the expected profit target, perfectly demonstrating the value of this strategy. If you need to recover significant losses or obtain precise trading signals, please contact me.
Silver is currently performing strongly, showing more resilience than gold. However, it's consolidating sideways, and support levels haven't been breached. Due to its high volatility in recent days, setting small stop-losses for short-term trades is difficult; precise entry points are crucial to avoid being caught in a breakout. For trading, watch the support level around 56.5-57. If a large bearish candle breaks through this level, watch for support around 55.6. Meanwhile, resistance around 58.5-59 is also significant. Personally, I prefer a pullback in silver's short-term outlook compared to further gains. My bullish view remains unchanged; a pullback is a consolidation phase for a healthier, more sustainable upward trend.

Gold prices are about to rise again! Buy!We recommend actively establishing long positions in gold. Every price pullback presents a good opportunity to enter positions.
On Tuesday, the market experienced a significant pullback. International gold prices fell after touching the 4250 level, reaching a low of around 4165, before stabilizing and rebounding. Prices have now regained the $4200 mark.
Such fluctuations are normal market behavior, typically used to shake out weak-handed long investors through significant price adjustments, creating room for further upward movement.
From a technical perspective, the key short-term support zone is between 4190 and 4205. I plan to establish long positions in batches within this range, expecting gold prices to potentially retest the 4250 level this week.
The above views represent my personal thoughts. If you do not yet have a clear trading strategy or the ability to independently analyze market trends, you are welcome to refer to them! Let's improve together! If the market changes, I will notify you in the channel!

XAUUSD Analysis todayHello traders, this is a complete multiple timeframe analysis of this pair. We see could find significant trading opportunities as per analysis upon price action confirmation we may take this trade. Smash the like button if you find value in this analysis and drop a comment if you have any questions or let me know which pair to cover in my next analysis.

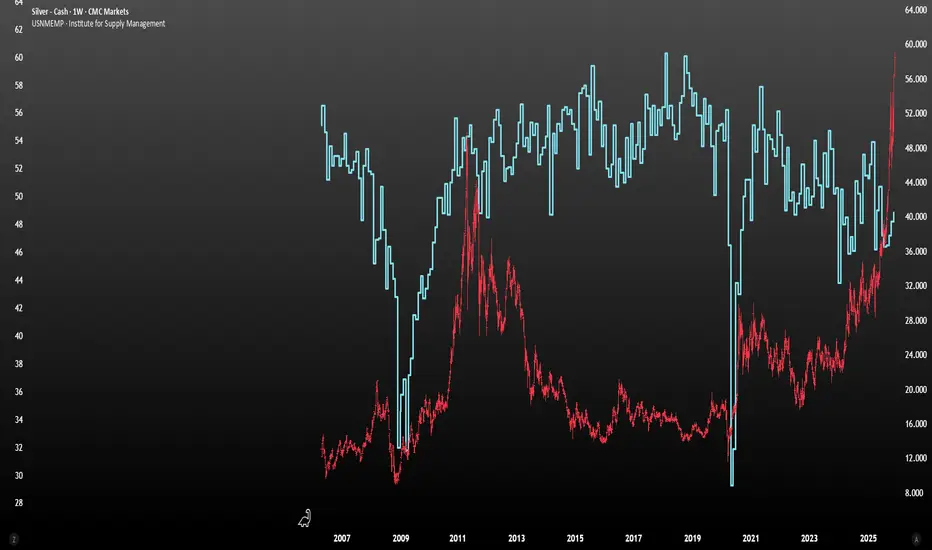
Silver’s Next Move in an Overextended PositionAfter breaking out of what appeared to be a cup-and-handle pattern on 25 November, silver prices have surged from around $51.40 to $58.65. The metal now looks overextended, with the RSI at 75.25, and trading above its upper Bollinger Band for the fourth consecutive day. This suggests that silver may be due for a retest of the 20-day moving average or for a few days of sideways consolidation before the next move is established.
On the hourly chart, silver prices have formed what appears to be a trading range since 30 November, broadly between $56.60 and $58.90, with $58.90 acting as resistance and $56.60 as support. A break below $56.60 could set up a move back towards $53.90, which would then become an important level of support. If that were to be broken, silver could potentially fall further towards $50.75. Such a development might also indicate that a larger reversal is starting to take shape, although it is far too early to make that assumption.
Conversely, a breakout above $58.90 would be a very bullish signal and would suggest that silver’s move higher could extend for some time. While a precise price objective is difficult to determine, using a 100% extension of the breakout to the recent high at $58.90 would imply that silver could rise to around $67.10.
Written by Michael J. Kramer, founder of Mott Capital Management.
Disclaimer: CMC Markets is an execution-only service provider. The material (whether or not it states any opinions) is for general information purposes only and does not take into account your personal circumstances or objectives. Nothing in this material is (or should be considered to be) financial, investment or other advice on which reliance should be placed.
No opinion given in the material constitutes a recommendation by CMC Markets or the author that any particular investment, security, transaction, or investment strategy is suitable for any specific person. The material has not been prepared in accordance with legal requirements designed to promote the independence of investment research. Although we are not specifically prevented from dealing before providing this material, we do not seek to take advantage of the material prior to its dissemination.