Context switching, the security function
The function security lets the user to request data from additional
symbols and resolutions, other than the ones to which the indicator is
applied.
Detailed description
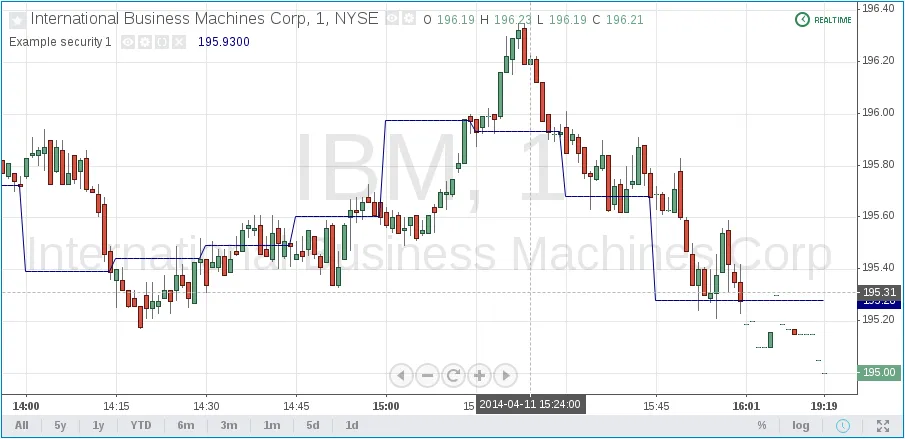
We will assume that we are applying a script to the chart IBM,1. The following script will display the close price of the IBM symbol but on a 15 resolution.

As seen from the security arguments
description,
the first argument is the name of the requested symbol. The second
argument is the required resolution, and the third one is an expression
which needs to be computed on the requested series.
The name of the symbol can be set using two variants: with a prefix that
shows the exchange (or data provider) or without it. For example:
"NYSE:IBM", "BATS:IBM" or "IBM". In the case of using the name of
a symbol without an exchange prefix, the exchange selected by default is
BATS. Current symbol name is assigned to ticker and tickerid
built-in variables. The variable ticker contains the value of the
symbol name without an exchange prefix, for example "MSFT". The
variable tickerid is a symbol name with an exchange prefix, for
example, "BATS:MSFT", "NASDAQ:MSFT". It’s recommended to use
tickerid to avoid possible ambiguity in the indicator’s displayed
values of data taken from different exchanges.
The resolution (or timeframe, the second argument of the security
function) is also set as a string. Any intraday resolution is set by
specifying a number of minutes. The lowest resolution is minute which
is set by the literal "1". It’s possible to request any1 number of
minutes: "5", "10", "21", etc. Hourly resolution is also set by
minutes2. For example, the following lines signify an hour, two hours
and four hours respectively: "60", "120", "240". A resolution with
a value of 1 day is set by the symbols "D" or "1D". It’s possible
to request any number of days: "2D", "3D", etc. Weekly and
monthly resolutions are set in a similar way: "W", "1W", "2W",
…, "M", "1M", "2M". "M" and "1M" are sorts of one month
resolution value. "W" and "1W" are the same weekly resolution value.
The third parameter of the security function can be any arithmetic
expression or a function call, which will be calculated in chosen series
context.
For example, with the security the user can view a minute chart and
display an SMA (or any other indicator) based on any other resolution
(i.e., daily, weekly, monthly):
Or one can declare the variable
and calculate it in 1, 15 and 60 minutes:
The function security, as should be understood from the examples,
returns a series which is adopted correspondingly to the time scale of
the current chart’s symbol. This result can be either shown directly on
the chart (i.e., with plot), or be used in further calculations of the
indicator’s code. The indicator ‘Advance Decline Line’ of the
function security is a more difficult example:
The script requests three securities at the same time. Results of the requests are then added to an arithmetic formula. As a result, we have a stock market indicator used by investors to measure the number of individual stocks participating in an upward or downward trend (read more).
Pay attention to the fact that, out of convenience, the call security
is ‘wrapped up’ in the user function sym. (just to write a bit less
of code).
security function was designed to request data of a timeframe higher
than the current chart timeframe. For example, if you have a 60 minute
chart, you can request 240, D, W (or any higher timeframe) and plot the
results.
Barmerge gaps and lookahead
There are two switches that define how requested data will be mapped to the current timeframe.
First one — gaps — controls gaps in data. Default value is
barmerge.gaps_off,
data is merged continiously (without na-gaps). All the gaps (if any)
are filled with the previous nearest non-na value. If
barmerge.gaps_on
then data will be merged possibly with gaps (na values).
Second one — lookahead — was added in Pine Script version 3 <release_notes_v3>. The parameter has
two possible values:
barmerge.lookahead_off
and
barmerge.lookahead_on
to switch between the new (version 3) and old behavior (version 2 and 1)
of the
security
function.
Here is an example that shows the behavioral difference of the security function on a 5 minute chart:

The green line on the chart is the low price of an hourly bar that is
requested with lookahead on. It’s the old behavior of the security
function, implemented in Pine Script v2. The green line based on
historical data is displayed at the price level of an hourly low right
after a new hourly bar is created (dotted blue vertical lines). The red
line is a low price of an hourly bar that is requested with lookahead
off. In this case the requested low price of an hourly historical bar
will be given only on the last minute bar of the requested hour, when an
hourly bar’s low won’t return future data. The fuchsia dotted line
represents the beginning of real-time data. You can see that
barmerge.lookahead_on and barmerge.lookahead_off based on real-time
data behaves the same way according to barmerge.lookahead_off.
Understanding lookahead
There are many published scripts with the following lines:
The expression in security (close[1]) is a value of close of the
previous day, which is why the construction doesn’t use future
data.
In Pine Script version 3 we can rewrite this in two different ways,
using barmerge.lookahead_on or barmerge.lookahead_off. If you use
barmerge.lookahead_on, then it’s quite simple:
Because original construction doesn’t use data from future it is
possible to rewrite it using barmerge.lookahead_off. If you use
barmerge.lookahead_off, the script becomes more complex, but gives you
an understanding of how the lookahead parameter works:
When an indicator is based on historical data (i.e.,
barstate.isrealtime equals false), we take the current close of
the daily resolution and shift the result of security function call
one bar to the right in the current resolution. When an indicator is
calculated on real-time data, we take the close of the previous day
without shifting the security data.
Requesting data of a lower timeframe
It’s not recommended to request data of a timeframe lower that the
current chart timeframe (for example 1 minute data from 5 minute chart).
The main problem with such a case is that some part of a 1 minute data
will be inevitably lost, as it’s impossible to display it on a 5 minute
chart and not to break the time axis. So the security behaviour could
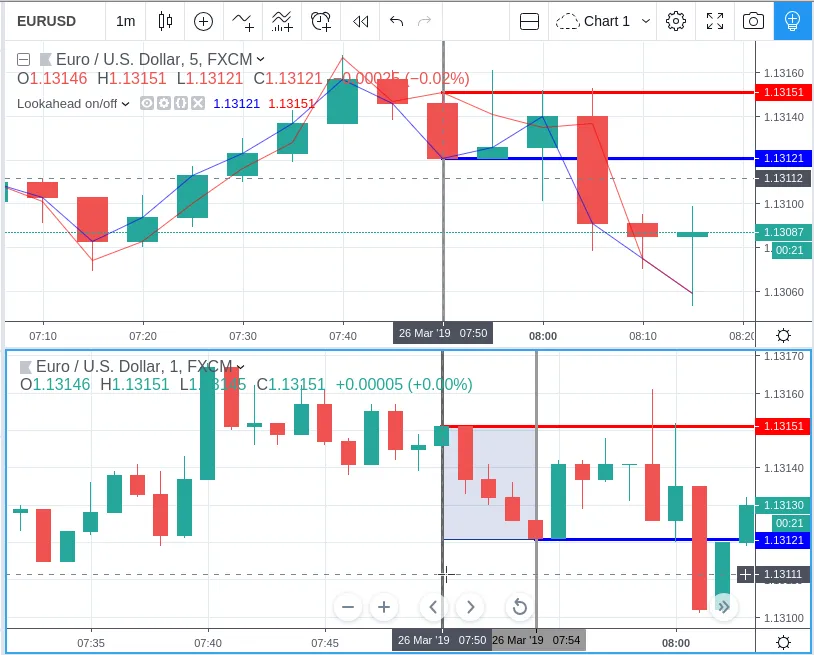
be rather weird. The next example illustrates this:

This study plots two lines which correspond to different values of
lookahead parameter. Red line shows data returned by security with
lookahead=true, blue line — with lookahead=false. Let us look at
the 5 minute bar that starts at 07:50. The red line at this bar has
value of 1.13151 which corresponds to a value of the first of the five
1 minute bars that fall into the time range 07:50—07:54. On the other
hand, the blue line at the same bar has value of 1.13121 which
corresponds to the last of the five 1 minute bars of the same time
range.