PROTECTED SOURCE SCRIPT
WaveTrend Pro by Bruno Machado
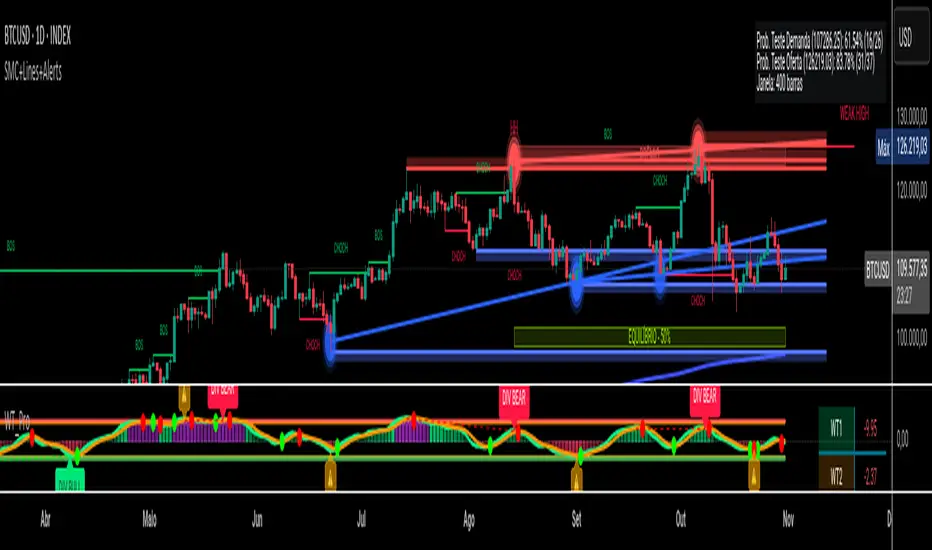
WaveTrend Pro is a momentum analysis tool designed to provide a deeper understanding of market dynamics. It builds upon the classic WaveTrend foundation by integrating advanced features like multi-level zones, sophisticated divergence detection, and a clean, intuitive on-screen dashboard.
This indicator aims to be your primary momentum oscillator, helping you identify high-probability entries, exits, and potential market reversals with greater confidence.
Key Features:
Enhanced WaveTrend Engine: Utilizes the classic WaveTrend calculation (hlc3) for its core but adds a Signal Line (SMA) for smoother and more reliable crossover signals.
Multi-Level Overbought/Oversold Zones: Instead of a single level, this indicator features two distinct zones:
Moderate Zones (Yellow/Orange): An early warning that momentum is becoming extended.
Extreme Zones (Green/Red): Signal heavily overbought or oversold conditions where reversals are most likely.
Advanced Divergence Detection: The powerful built-in divergence engine automatically identifies:
Regular Bullish & Bearish Divergences: Spots classic divergences where price makes a new extreme but the oscillator fails to confirm, signaling a potential trend change.
Exhaustion Divergences: A unique feature that detects when price makes a new high/low but with significantly less volatility, warning that the current move is running out of steam.
"In-Formation" Lines: Draws dotted lines in real-time as a potential divergence is forming, giving you a head start before it's confirmed.
Dynamic Visuals & Histogram: The indicator is designed for clarity:
Gradient Histogram: The histogram columns change color and intensity based on momentum, becoming brighter and more vibrant in extreme zones.
Clear Crossover Signals: Plots clear circles directly on the chart at the moment of a crossover.
On-Screen Information Panel: A comprehensive dashboard provides a real-time summary of the indicator's status, including:
Current WT1 and WT2 values.
The immediate trend (Bullish/Bearish based on the crossover).
The current momentum Zone (e.g., Extreme Sell, Moderate Buy, Neutral).
The latest Divergence status (e.g., Forming Bull, Bear Confirmed).
Comprehensive Alert System: Create alerts for every key event so you never miss an opportunity:
WT1 / WT2 Crossovers.
Entry into Extreme OB/OS Zones.
Confirmed Regular Divergences (Bullish & Bearish).
Exhaustion Warnings.
How to Use:
The power of this indicator comes from combining its signals for high-probability trade setups.
High-Probability Crossovers: Don't just trade every crossover. Look for buy crossovers that occur inside the green Extreme Oversold zone. Conversely, look for sell crossovers inside the red Extreme Overbought zone.
Reversal Trading with Divergences: A confirmed Bullish Divergence appearing in the oversold territory is a strong signal for a potential bottom. A Bearish Divergence in the overbought territory signals a potential top.
Spotting Trend Weakness: Use the Exhaustion Signals as a warning. If you are in a long trade and an "Exhaustion ⚠️" label appears at a new high, it might be a good time to tighten your stop-loss or take partial profits.
By combining zone analysis, crossovers, and divergence signals, WaveTrend Pro gives you a significant edge in timing your trades.
Credits & Collaboration:
This indicator was developed and designed by Bruno Machado.
For contact and collaboration inquiries: brunomachado788@gmail.com
Protected script
This script is published as closed-source. However, you can use it freely and without any limitations – learn more here.
Disclaimer
The information and publications are not meant to be, and do not constitute, financial, investment, trading, or other types of advice or recommendations supplied or endorsed by TradingView. Read more in the Terms of Use.