TradingView
ChrisMoody
Jan 9, 2014 12:42 PM

Example of Code for Moving Average Cross - Changing Colors 

British Pound/Japanese YenFXCM

Description

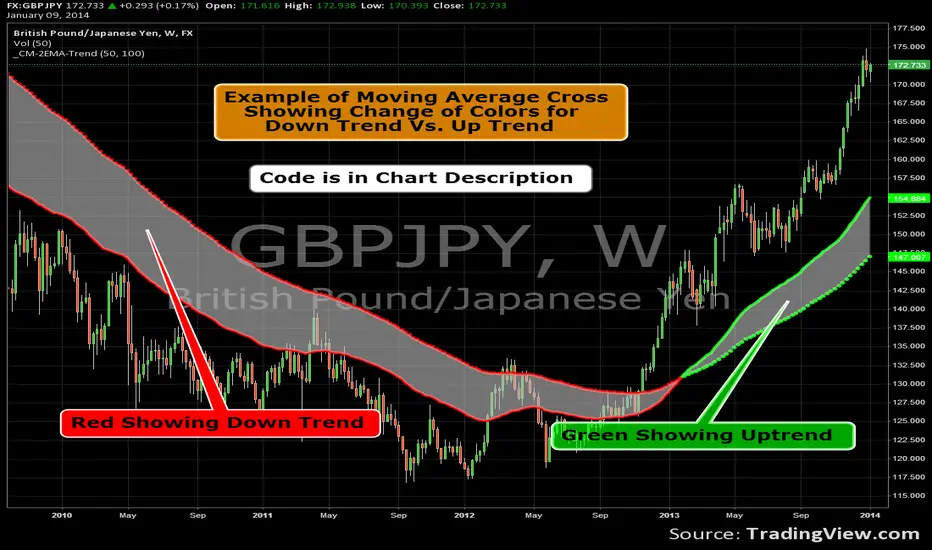
Famous 7 Time World Trading Champion Chuck Hughes found the 50 and 100 EMA to be the best Signal for a Change in Trend. Through extensive back-testing he found these EMA’s to give the earliest signal that also resulted in a Long-Term Change in Trend.

Dotted Line represents Long-Term EMA. The 100 EMA in this example.
Solid line represents the Short-Term EMA. The 50 EMA in this example.

If Short-Term EMA is ABOVE Long-Term EMA...Color = Green.
If Short-Term EMA is BELOW Long-Term EMA...Color = Red.
Comments
AutoBotFx
Hi Chris,
Can you please tell me how I can start learning pine script?
Which editor can I use?
TheObDur
ThesePipsDontLie
@TheObDur, This is the best answer.
Snatchshis
@TheObDur, Hey! 2012 here. Can I have that answer back, please?
TradeWithConfidence
Can anyone help me please! I built an indicator that has uses only 1 line! But it has 2 colors!
I want to get an alert when line color changes (Example: Line turns green = "Buy", line turns red = "Sell"
I try everything and I can't get it to work. Can anyone please help please!

linecolor2=direction2 < 0 ? red : direction2 > 0 ? green : red
ChrisMoody
Code is Below:


//Created by user ChrisMoody
//Long EMA = Dots, Short EMA = Line
//If Short EMA is ABOVE Long EMA = Lime Color, If Short EMA is BELOW Long EMA = Red Color
study(title="_CM_Double EMA Trend Color", shorttitle="_CM-2EMA-Trend", overlay=true)
src = close, len = input(50, minval=1, title="Short EMA")
src2 = close, len2 = input(100, minval=1, title="Long EMA")
emaShort = ema(src, len)
emaLong = ema(src2, len2)

spanColor = emaShort>=emaLong ? lime : red

p1 = plot(emaShort, title="EMA Short", style=line, linewidth=4, color=spanColor)
p2 = plot(emaLong, title="EMA Long", style=circles, linewidth=3, color=spanColor)

fill(p1, p2, color=silver, transp=40, title="Fill")

//If you do not want the Fill gradient between the EMA's follow the steps below.

//Erase the p1 = in line 12 and 13 so plot is at the far left
//Erase line 15 or put two forward slashes in front of the word fill, just like the two forward slashes at the beginning of this line.
KenvinZone
@ChrisMoody,
Hello, thanks for your Tutorials & Code.
Could you help me to know how to code like this, your code is 99% like this but I dont know how to code like this one.

shane1994
how can we get it to where i can run the strategy tester with this code its not letting me
akilli951
Hi Chris,
Can you tell me please how I can compare two ma lines with the same period and different offset on chart
my purpose the cross points in shifted moving Average with same period and different offset
UnknownUnicorn2285229
Hi, thanks for your script, I'm trying to modify it but I'm getting this error "Add to Chart operation failed, reason: Script could not be translated from: |B|ema10 close, len10 = input"
What am I doing wrong?

Script:

study(title="_5 EMA Trend Color", shorttitle="_5_EMA-Trend", overlay=true)

ema10 close, len10 = input(10, minval=1, title="EMA 10")
ema20 close, len20 = input(20, minval=1, title="EMA 20")
ema30 close, len30 = input(30, minval=1, title="EMA 30")
ema144 close, len144 = input(144, minval=1, title="EMA 144")
ema169 close, len169 = input(169, minval=1, title="EMA 169")

emaShort10 = ema(ema10, len10)
emaShort20 = ema(ema20, len20)
emaShort30 = ema(ema30, len30)
emaLong144 = ema(ema144, len144)
emaLong169 = ema(ema169, len169)

spanColor = (emaShort10 and emaShort20 and emaShort30)>=(emaShort144 and emaShort169) ? lime : red

p10 = plot(emaShort10, title="EMA 10", style=line, linewidth=4, color=spanColor)
p20 = plot(emaShort20, title="EMA 20", style=line, linewidth=4, color=spanColor)
p30 = plot(emaShort30, title="EMA 30", style=line, linewidth=4, color=spanColor)

p144 = plot(emaLong144, title="EMA 144", style=circles, linewidth=3, color=spanColor)
p169 = plot(emaLong169, title="EMA 169", style=circles, linewidth=3, color=spanColor)

fill(p10, p20, p30, p144, p169, color=silver, transp=40, title="Fill")
More