OPEN-SOURCE SCRIPT
Directional Volume Heatmap
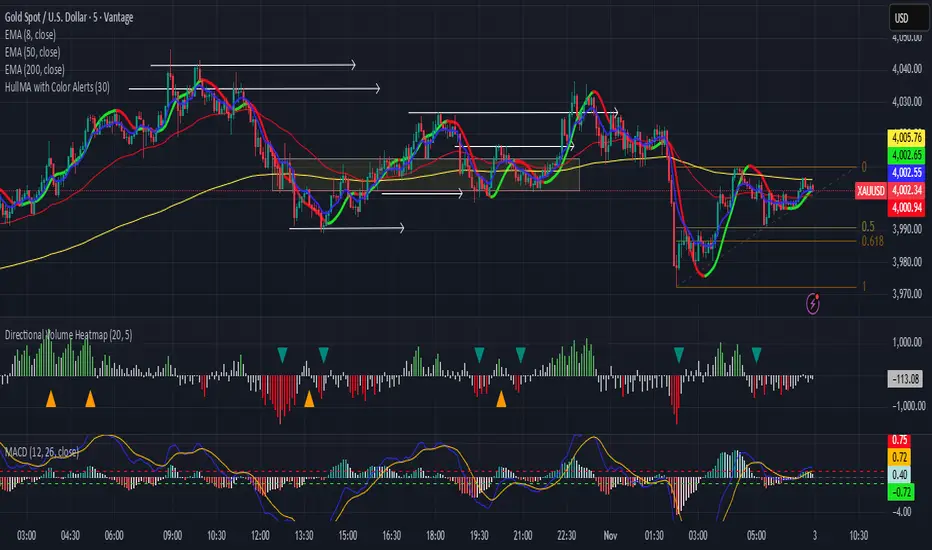
Directional Volume Heatmap is a tactical volume visualization tool designed to detect real-time shifts in market pressure. It plots a smoothed histogram of directional volume bias, color-coded to reflect bullish and bearish intensity. The indicator includes optional signal markers for declining buy-side and sell-side volume, helping traders anticipate momentum fades and potential reversals before they appear in price action.
🔍 Features:
- Volume Bias Histogram: Displays smoothed bullish/bearish volume using candle body logic.
- Dual Decline Detection: Flags fading buy or sell pressure with customizable lookback and toggles.
- Color-Coded Heatmap: Green-to-red gradient reflects real-time sentiment shifts.
- Modular Design: Built for integration with trend overlays, confirmation filters, and automated systems.
Use Cases:
- Detect early signs of exhaustion in trending moves
- Confirm breakout strength or fading rallies
- Layer volume context beneath HullMA, ATR overlays, or trend bias scoring
- Deploy in live dashboards for XAUUSD or other high-volatility assets
This module is optimized for precision, adaptability, and deployment-ready workflows. Ideal for traders building scenario-based engines or refining tactical edge in volatile environments.
Open-source script
In true TradingView spirit, the creator of this script has made it open-source, so that traders can review and verify its functionality. Kudos to the author! While you can use it for free, remember that republishing the code is subject to our House Rules.
Disclaimer
The information and publications are not meant to be, and do not constitute, financial, investment, trading, or other types of advice or recommendations supplied or endorsed by TradingView. Read more in the Terms of Use.