CVD Spaghetti - Multi-Exchange (Perpetuals)CVD Spaghetti – Multi-Exchange (Perpetuals) is designed to track and visualize Cumulative Volume Delta (CVD) across multiple cryptocurrency perpetual futures exchanges in one consolidated view. This indicator provides traders with a clearer perspective on buying and selling pressure by monitoring how order flow develops on different venues simultaneously.
What it does
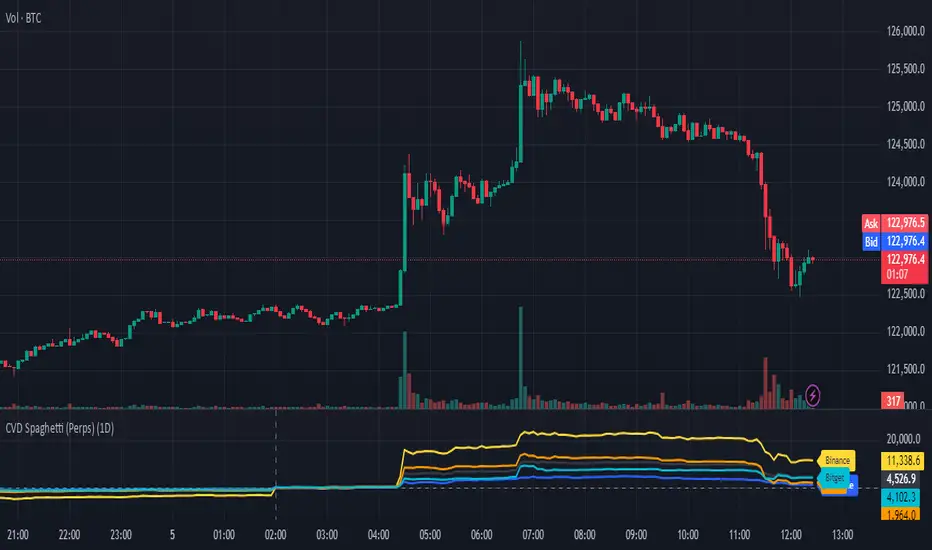
The script calculates the CVD for each enabled exchange and plots them as separate lines on a single chart, creating a “spaghetti” style visualization. This allows traders to identify relative strength or weakness between major exchanges, which can often hint at institutional positioning, liquidity shifts, and potential market imbalances.
Why it’s useful
Order flow and liquidity dynamics can differ significantly between exchanges. By aggregating and comparing these flows, traders can:
Detect which venue is leading during trend development.
Spot divergences between exchanges, which may indicate inefficiencies or arbitrage-driven movements.
Gauge overall sentiment strength by comparing multiple sources instead of relying on a single dataset.
Technical details
Anchor Period Reset: The cumulative calculation resets based on the user-defined Anchor Period (default: daily), keeping data relevant for the chosen trading horizon.
Dynamic Resolution: The script automatically selects an appropriate lower timeframe for data requests based on the chart timeframe to maintain responsiveness and accuracy.
Normalization: Not all exchanges report volume in the same way—some use quote currency (USD), others in contracts or ticks. To ensure comparability, this indicator normalizes volumes where necessary:
Bybit USD and OKX contracts are divided by price to approximate base-coin terms.
Single-contract venues (e.g., Deribit) are normalized similarly.
Exchanges already reporting in the base currency remain unchanged.
Multi-Exchange Coverage: Supports major venues including Binance, Bybit, OKX, Bitget, Coinbase, and optional secondary exchanges like Blofin, Whitebit, and Deribit.
Visual Aids:
Zero baseline for directional reference.
Vertical session markers at each reset point.
Optional exchange labels positioned dynamically on the last bar for quick identification.
How traders might use it
Trend confirmation: Strong synchronized CVD across all major exchanges supports continuation; fragmentation may suggest weakening conviction.
Cross-exchange divergence: When one exchange’s CVD diverges from others, it can signal localized liquidity shocks or large player activity.
High-frequency strategies: On lower timeframes, the spaghetti view can highlight which venue is absorbing or providing liquidity fastest, aiding short-term decision-making.
Search in scripts for "VOLUME DELTA"
Cumulative Volume DeltaA Cumulative Volume Delt a approach based on the Bull and Bear Balance Indicator by Vadim Gimelfarb published in the October 2003 issue of the S&C Magazine.
Adjust the length of the moving average according to your needs (Symbol, Timeframe, etc.)
Weekend Hunter Ultimate v6.2 Weekend Hunter Ultimate v6.2 - Automated Crypto Weekend Trading System
OVERVIEW:
Specialized trading strategy designed for cryptocurrency weekend markets (Saturday-Sunday) when institutional traders are typically offline and market dynamics differ significantly from weekdays. Optimized for 15-minute timeframe execution with multi-timeframe confluence analysis.
KEY FEATURES:
- Weekend-Only Trading: Automatically activates during configurable weekend hours
- Dynamic Leverage: 5-20x leverage adjusted based on market safety and signal confidence
- Multi-Timeframe Analysis: Combines 4H trend, 1H momentum, and 15M execution
- 10 Pre-configured Crypto Pairs: BTC, ETH, LINK, XRP, DOGE, SOL, AVAX, PEPE, TON, POL
- Position & Risk Management: Max 4 concurrent positions, -30% account protection
- Smart Trailing Stops: Protects profits when approaching targets
RISK MANAGEMENT:
- Maximum daily loss: 5% (configurable)
- Maximum weekend loss: 15% (configurable)
- Per-position risk: Capped at 120-156 USDT
- Emergency stops for flash crashes (8% moves)
- Consecutive loss protection (4 losses = pause)
TECHNICAL INDICATORS:
- CVD (Cumulative Volume Delta) divergence detection
- ATR-based dynamic stop loss and take profit
- RSI, MACD, Bollinger Bands confluence
- Volume surge confirmation (1.5x average)
- Weekend liquidity adjustments
INTEGRATION:
- Designed for Bybit Futures (0.075% taker fee)
- WunderTrading webhook compatibility via JSON alerts
- Minimum position size: 120 USDT (Bybit requirement)
- Initial capital: $500 recommended
TARGET METRICS:
- Win rate target: 65%
- Average win: 5.5%
- Average loss: 1.8%
- Risk-reward ratio: ~3:1
IMPORTANT DISCLAIMERS:
- Past performance does not guarantee future results
- Leveraged trading carries substantial risk of loss
- Weekend crypto markets have 13% of normal liquidity
- Not suitable for traders who cannot afford to lose their entire investment
- Requires continuous monitoring and adjustment
USAGE:
1. Apply to 15-minute charts only
2. Configure weekend hours for your timezone
3. Set up webhook alerts for automation
4. Monitor performance table in top-right corner
5. Adjust parameters based on your risk tolerance
This is an experimental strategy for educational purposes. Always test with small amounts first and never invest more than you can afford to lose completely.

TAIndicatorsThis library offers a comprehensive suite of enhanced technical indicator functions, building upon TradingView's built-in indicators. The primary advantage of this library is its expanded flexibility, allowing you to select from a wider range of moving average types for calculations and smoothing across various indicators.
The core difference between these functions and TradingView's standard ones is the ability to specify different moving average types beyond the default. While a standard ta.rsi() is fixed, the rsi() in this library, for example, can be smoothed by an 'SMMA (RMA)', 'WMA', 'VWMA', or others, giving you greater control over your analysis.
█ FEATURES
This library provides enhanced versions of the following popular indicators:
Moving Average (ma): A versatile MA function that includes optional secondary smoothing and Bollinger Bands.
RSI (rsi): Calculate RSI with an optional smoothed signal line using various MA types, plus built-in divergence detection.
MACD (macd): A MACD function where you can define the MA type for both the main calculation and the signal line.
ATR (atr): An ATR function that allows for different smoothing types.
VWAP (vwap): A comprehensive anchored VWAP with multiple configurable bands.
ADX (adx): A standard ADX calculation.
Cumulative Volume Delta (cvd): Provides CVD data based on a lower timeframe.
Bollinger Bands (bb): Create Bollinger Bands with a customizable MA type for the basis line.
Keltner Channels (kc): Keltner Channels with selectable MA types and band styles.
On-Balance Volume (obv): An OBV indicator with an optional smoothed signal line using various MA types.
... and more to come! This library will be actively maintained, with new useful indicator functions added over time.
█ HOW TO USE
To use this library in your scripts, import it using its publishing link. You can then call the functions directly.
For example, to calculate a Weighted Moving Average (WMA) and then smooth it with a Simple Moving Average (SMA) :
import ActiveQuants/TAIndicators/1 as tai
// Calculate a 20-period WMA of the close
// Then, smooth the result with a 10-period SMA
= tai.ma("WMA", close, 20, "SMA", 10)
plot(myWma, color = color.blue)
plot(smoothedWma, color = color.orange)
█ Why Choose This Library?
If you're looking for more control and customization than what's offered by the standard built-in functions, this library is for you. By allowing for a variety of smoothing methods across multiple indicators, it enables a more nuanced and personalized approach to technical analysis. Fine-tune your indicators to better fit your trading style and strategies.

MirPapa:ICT:HTF: FVG OB Threeple# MirPapa:ICT:HTF: FVG OB (Fair Value Gap Order Block)
**Version:** Pine Script® v6
**Author:** © goodia
**License:** MPL-2.0 (Mozilla Public License 2.0)
---
## Overview
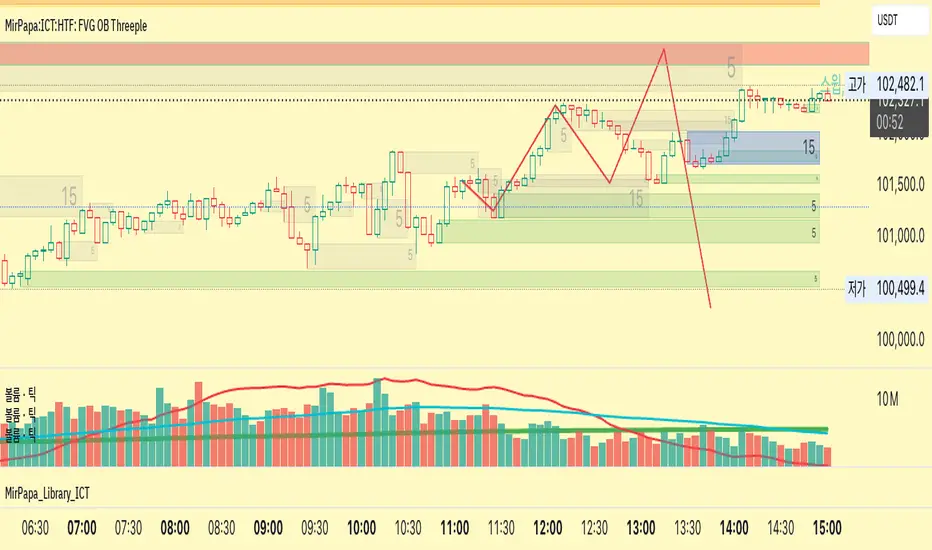
“FVG OB” (Fair Value Gap Order Block) identifies higher-timeframe candle ranges where a gap (imbalance) exists between two non-consecutive candles, signaling potential institutional order blocks. This module draws bullish or bearish FVG OB boxes on your lower-timeframe chart, extends them until price interacts a specified number of times, and then finalizes (recolors) the box.
---
## Inputs
- **Enable FVG OB Boxes** (`bool`)
Toggle drawing of HTF FVG OB boxes on the chart.
- **Enable FVG OB Midlines** (`bool`)
Toggle drawing of a midpoint line inside each FVG OB box.
- **FVG OB Close Count** (`int` 1–10)
Number of HTF closes beyond the FVG range required to finalize (recolor) the box.
- **FVG OB Bull Color** (`color`)
Fill & border color for bullish FVG OB boxes.
- **FVG OB Bear Color** (`color`)
Fill & border color for bearish FVG OB boxes.
- **FVG OB Box Transparency** (`int` 1–100)
Opacity level for FVG OB box fills (higher = more transparent).
---
## How It Works
1. **HTF Data Retrieval**
- The script uses `request.security()` (via `GetHTFrevised()`) to fetch HTF OHLC and historical values:
- `_htfHigh3` (high three bars ago) and `_htfLow1` (low one bar ago) for bullish FVG OB.
- `_htfLow3` (low three bars ago) and `_htfHigh1` (high one bar ago) for bearish FVG OB.
- It also tracks the HTF `bar_index` on the lower timeframe to align drawing.
2. **FVG OB Detection**
- **Bullish FVG OB**: Occurs when the HTF low of the previous bar (`low `) is strictly above the HTF high of three bars ago (`high `), creating a gap.
- **Bearish FVG OB**: Occurs when the HTF high of the previous bar (`high `) is strictly below the HTF low of three bars ago (`low `), creating a gap.
3. **Box Creation**
- On each new HTF bar (`ta.change(time(HTF)) != 0`), if a bullish or bearish FVG OB condition is met, the script calls `CreateBoxData()` with:
- **Bullish**: `bottom = HTF low `, `top = HTF high `, `_isBull = true`.
- **Bearish**: `bottom = HTF low `, `top = HTF high `, `_isBull = false`.
- Midline toggled by input.
- A `BoxData` struct is created and stored in either the Bull or Bear array.
4. **Box Extension & Finalization**
- On **every LTF bar**, `ProcessBoxDatas(...)` iterates over all active FVG OB boxes:
1. **Extend Right Edge**: `box.set_right(bar_index)` ensures the box follows the latest bar.
2. **Record Volume Delta**: Tracks buy/sell volume inside the box.
3. **Touch Stage Update**: `modBoxUpdateStage()` increments `_stage` when price touches its “basePoint” (for FVG OB, the basePrice is one side of the gap).
4. **Finalize**: `setBoxFinalize()` checks if the configured number of closes beyond the FVG gap (`FVG OB Close Count`) has occurred. If so:
- `_isActive := false`
- Border and background colors are changed to the “Box Close Color” (input).
- Finalized boxes remain on screen semi-transparent, indicating that the FVG OB zone has been tested.
5. **Midline (Optional)**
- If “Enable FVG OB Midlines” is checked, `ProcessBoxDatas()` also extends a horizontal midpoint line inside the box with `line.set_x2(bar_index)`.
---
## Usage Instructions
1. **Installation**
- Copy the FVG OB section of the Pine Script into TradingView’s Pine Editor (ensure the library import is included).
- Click “Add to Chart.”
2. **Configure Inputs**
- Choose a Higher Time Frame via the dropdown (e.g., “4시간” maps to a 4H timeframe).
- Toggle “Enable FVG OB Boxes” and “Enable FVG OB Midlines.”
- Select colors for bullish and bearish boxes and set transparency.
- Adjust “FVG OB Close Count” to control how many closes beyond the gap finalize the box.
3. **Interpretation**
- **Active FVG OB Boxes** extend to the right until price closes beyond the gap range the specified number of times.
- When finalized, each box changes to the “Box Close Color,” signaling that institutional orders in that gap have likely been filled.
Enjoy precise visualization of higher-timeframe Fair Value Gap Order Blocks on your lower-timeframe chart!
Cumulative Volume Delta with MACVD Candles with moving average of your choice of Hull, wma, EMA and SMA and choose your length. Not perfect so feel free to change it.
Moving average changes color with moving average positive or negative.
For entertainment purposes only.

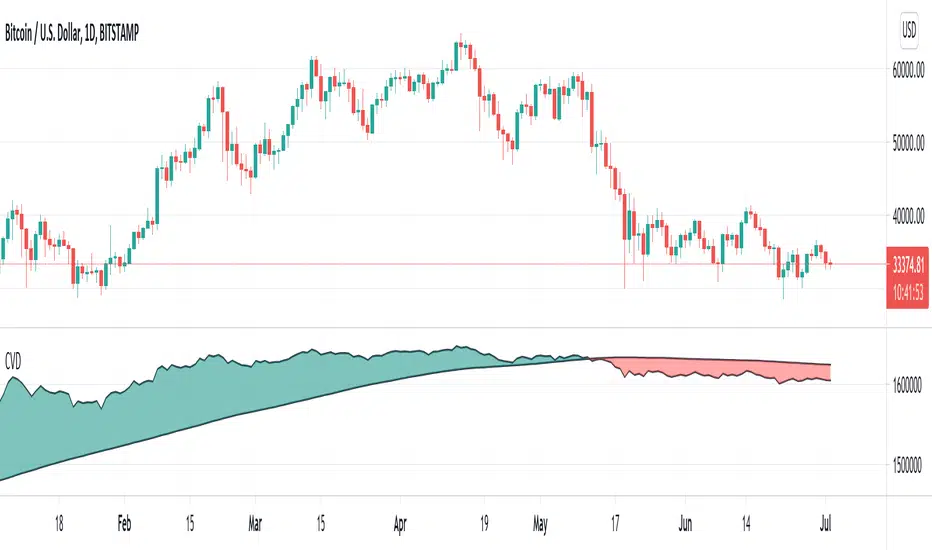
Cumulative Volume Delta - LineA simple tweak to the CVD indicator from TradingView for better readability.
Use it to spot absorption and exhaustion at key levels.
For example,
Price is making higher highs while CVD is making lower highs - possible exhaustion of buyers
Price is making lower highs while CVD is making higher highs - possible absorption of buyers
Price is making lower lows while CVD is making higher lows - possible exhaustion of sellers
Price is making higher lows while CVD is making lower lows - possible absorption of sellers


Gold vs. Dollar Sentiment Map [SB1]🟡 Gold vs Dollar Sentiment Map
The Gold vs Dollar Sentiment Map reveals the direct inverse relationship between Gold Futures (GC) and the U.S. Dollar Index (DXY) — one of the most reliable global risk-sentiment gauges.
It helps traders instantly identify whether capital is flowing into safety (Gold) or into the Dollar (risk assets) during any session or timeframe.
🔍 Core Logic
Risk-Off (Bearish background = Red): DXY ↓ and Gold ↑ → investors seeking safety, rising fear or falling yields.
Risk-On (Bullish background = Green): DXY ↑ and Gold ↓ → investors rotating into risk assets, stronger USD demand.
Neutral (Gray): Mixed signals – no dominant macro driver.
📊 Dashboard
A compact on-chart table displays real-time trend bias for:
Gold (GC) – Bullish / Bearish / Neutral
U.S. Dollar Index (DXY) – Bullish / Bearish / Neutral
Color shading reflects each asset’s intrabar momentum.
⚙️ Visual Features
Adaptive background colors to show sentiment shifts.
Strong candle markers highlighting momentum bars near range extremes.
Alerts for clear Risk-On / Risk-Off alignment.
🧭 How to Use
Red background (Risk-Off): Gold strength + Dollar weakness → favorable environment for long gold setups.
Green background (Risk-On): Dollar strength + Gold weakness → bias toward short gold or avoid long exposure.
Gray background: Stay patient; look for confirmation or wait for alignment.
💡 Ideal For
Gold and Forex traders monitoring macro rotation.
Sentiment confirmation alongside order-flow, VWAP, or volume-delta tools.
Overlaying on intraday or higher-timeframe charts to frame trade bias.

SMT + CVD (NQ vs ES) w/ AlertsSMT + CVD (NQ vs ES) w/ Alerts
This tool combines Smart Money Technique (SMT) and Cumulative Volume Delta (CVD) to highlight high-probability inflection points on NQ (primary) versus ES (secondary).
How it works
SMT condition: the primary breaks its most recent swing (High for bearish / Low for bullish) while the secondary does not break the corresponding swing within a small retest window.
CVD confirmation: at the same time, the primary’s CVD shows divergence (higher price but lower/equal CVD for shorts, lower price but higher/equal CVD for longs).
When both align, the script plots a marker/label and draws a line from the primary swing to the signal bar. Alerts are fired.
Signals & Alerts
Labels: “SMT+CVD DOWN/UP” on the signal bar.
Lines: connects the primary swing → signal bar so you can see the structure that produced the signal.
Alert names: “SMT+CVD Bearish” and “SMT+CVD Bullish.”
Inputs
Primary / Secondary symbols: defaults NQ & ES (you can change them).
Resolution: use chart timeframe or specify one.
Swing Left/Right Bars: pivot detection depth (higher = larger swings).
Break Window Bars: how many bars the secondary has to not break for SMT to be valid.
CVD Up/Down By: Close vs Previous Close (default) or Close vs Open.
Anchor CVD Daily: resets CVD at session/day start.
CVD Smoothing (EMA): smooths the CVD line (optional show).
FAST Pivots (no future bars): left-only swing detection so signals appear sooner and behave well in Replay/live.
Require Secondary Pivot: if ON, SMT checks wait for a confirmed secondary swing; if OFF, signals can appear while the secondary swing is still forming (useful for Replay/testing).
Show CVD line: optional, may compress price scale.
Non-repaint notes
With FAST Pivots ON, swings are detected with no future bars (minimal latency = leftBars).
With FAST Pivots OFF, standard pivots require rightBars future bars to confirm the swing (classic, but naturally delayed).
Tips
For intraday futures, keep leftBars/rightBars small (e.g., 3/3) and Break Window 1–3.
In Replay, enable FAST Pivots and consider disabling Require Secondary Pivot if you want signals to appear as soon as the primary breaks.
Combine with session filters, execution rules, or liquidity zones for context.

HTF Live View - GSK-VIZAG-AP-INDIA📘 HTF Live View — GSK-VIZAG-AP-INDIA
🧩 Overview
The HTF Live View indicator provides a real-time visual representation of higher-timeframe (HTF) candle structures — such as 15min, 30min, 1H, 4H, and Daily — all derived directly from live 1-minute data.
This allows traders to see how higher timeframe candles are forming within the current session — without switching chart timeframes.
⚙️ Core Features
📊 Live Multi-Timeframe OHLC Tracking
Continuously calculates and displays Open, High, Low, and Close values for each key timeframe (15m, 30m, 1H, 4H, and Daily) based on the ongoing session.
⏱ Session-Aware Calculation
Automatically syncs with market hours defined by user-selected start and end times. Works across multiple timezones for global compatibility.
🕹 Visual Candle Representation
Draws mini-candles on the chart for each higher timeframe to represent their current body and wick — updated live.
Green body → bullish development
Red body → bearish development
📅 Informative Table Panel
Displays a summary table showing:
Timeframe label
Period (start–end time)
Live OHLC values
Color-coded close values
🌍 Timezone Support
Fully compatible with common regions such as Asia/Kolkata, New York, London, Tokyo, and Sydney.
🔧 User Inputs
Parameter Description
Market Start Hour/Minute Define session start time (default: 09:15)
Session End Hour/Minute Define market close (default: 15:30)
Timezone Select your preferred timezone for session alignment
💡 How It Works
The indicator uses a rolling OHLC calculation function that dynamically computes candle values based on elapsed session time.
Each timeframe (15m, 30m, 1H, 4H, and Daily) is built from 1-minute data to maintain precision even during intraday updates.
Both a visual representation (candles and wicks) and a data table (numeric summary) are displayed for clarity.
🧠 Use Cases
Monitor how HTF candles are forming live without switching chart intervals.
Understand intraday structure shifts (e.g., when 1H turns from red to green).
Confirm trend alignment across multiple timeframes visually.
Combine with your volume, delta, or liquidity tools for deeper confluence.
🪶 Signature
Developed by GSK-VIZAG-AP-INDIA
© prowelltraders — Educational and analytical use only.
⚠️ Disclaimer
This indicator is for educational and informational purposes only.
It does not provide financial advice or guaranteed trading results.
Always perform your own analysis before making investment decisions.

Elliott Wave [BigBeluga]🔵 OVERVIEW
Elliott Wave automatically finds and draws an Elliott-style 5-wave impulse and a dashed projection for a potential -(a)→(b)→(c) correction. It detects six sequential reversal points from rolling highs/lows — 1, 2, 3, 4, 5, (a) — validates their relative placement, and then renders the wave with labels and horizontal reference lines. If price invalidates the structure by closing back through the Wave-5 level inside a 100-bar window, the pattern is cleared (optionally kept as “broken”) while key dotted levels remain for context.
🔵 CONCEPTS
Reversal harvesting from extremes : The script scans highest/lowest values over a user-set Length and stores swing points with their bar indices.
Six-point validation : A pattern requires six pivots (1…5 and (a)). Their vertical/temporal order must satisfy Elliott-style constraints before drawing.
Impulse + projection : After confirming 1→5, the tool plots a curved polyline through the pivots and a dashed forward path from (a) toward (b) (midpoint of 5 and (a)) and back to (c).
Risk line (invalidator) : The Wave-5 price is tracked; a close back through it within 100 bars marks the structure as broken.
Minimal persistence : When broken, the wave drawing is removed to avoid noise, while dotted horizontals for waves 5 and 4 remain as reference.
🔵 FEATURES
Automatic pivot collection from rolling highs/lows (user-controlled Length ).
Wave labeling : Points 1–5 are printed; the last collected swing is marked b
. Projected i
& i
are shown with a dashed polyline.
Breaker line & cleanup : If price closes above Wave-5 (opposite for bears) within 100 bars, the pattern is removed; only dotted levels of 5 and 4 stay.
Styling controls :
Length (pivot sensitivity)
Text Size for labels (tiny/small/normal/large)
Wave color input
Show Broken toggle to keep invalidated patterns visible
Lightweight memory : Keeps a compact buffer of recent pivots/draws to stay responsive.
🔵 HOW TO USE
Set sensitivity : Increase Length on noisy charts for cleaner pivots; decrease to catch earlier/shorter structures.
Wait for confirmation : Once 1→5 is printed and (a) appears, use the Wave-5 line as your invalidation. A close back through it within ~100 bars removes the active wave (unless Show Broken is on).
Plan with the dashed path : The (a)→(b)→(c) projection offers a scenario for potential corrective movement and risk placement.
Work MTF : Identify cleaner waves on higher TFs; refine execution on lower TFs near the breaker or during the move toward (b).
Seek confluence : Align with structure (S/R), volume/Delta, or your trend filter to avoid counter-context trades.
🔵 CONCLUSION
Elliott Wave systematizes discretionary wave analysis: it detects and labels the 5-wave impulse, projects a plausible (a)-(b)-(c) path, and self-cleans on invalidation. With clear labels, dotted reference levels, and a practical breaker rule, it gives traders an objective framework for scenario planning, invalidation, and timing.

WLSMA: fast approximation🙏🏻 Sup TV & @alexgrover
O(N) algocomplexity, just one loop inside. No, you can't do O(1) @ updates in moving window mode, only expanding window will allow that.
Now I have time series & stats models of my own creation, nowhere else available, just TV and my github for now, ain’t no legacy academic industry I always have fun about, but back in 2k20 when I consciously ain’t known much about quant, I remember seeing post by @alexgrover recreating Moving Regression Endpoint dropped on price chart (called LSMA here) as a linear filter combination of filters (yea yeah DSP terms) as 3WMA - 2SMA. Now it’s my time to do smth alike aye?
...
This script is remake of my 1st degree WLSMA via linear filter combo. It’s much faster, we aint calculate moving regression per se, we just match its freq response. You can see it on the screen (WLSMAfa) almost perfectly matching the original one (WLSMA).
...
While humans like to overfit, I fw generalizations. So your lovely WMA is actually just one case of a more general weight pattern: pow(len - i, e), where pow is the power function and e is the exponent itself. So:
- If e = 0, then we have SMA (every number in 0th power is one)
- If e = 1, we get WMA
- If e = 2, we get quadratic weights.
We can recreate WLSMA freq response then by combining 2 filters with e = 1 and e = 2.
This is still an approximation, even tho enormously precise for the tasks you’ve shared with me. Due to the non-linear nature of the thing it’s all we can do, and as window size grows, even this small discrepancy converges with true WLSMA value, so we’re all good. Pls don’t try to model this 0.00xxxx discrepancy, it’s not natural.
...
DSP approach is unnatural for prices, but you can put this thing on volume delta and be happy, or on other metrics of yours, if for some reason u dont wanna estimate thresholds by fitting a distro.
All good TV
∞
P.S.: strangely, the first script made & dropped in the location in Saint P where my actual quant way has started ~5 years ago xD, very thankful

Custom Date CVDThis indicator allows setting a custom date for the beginning of cumulative volume delta calculations.
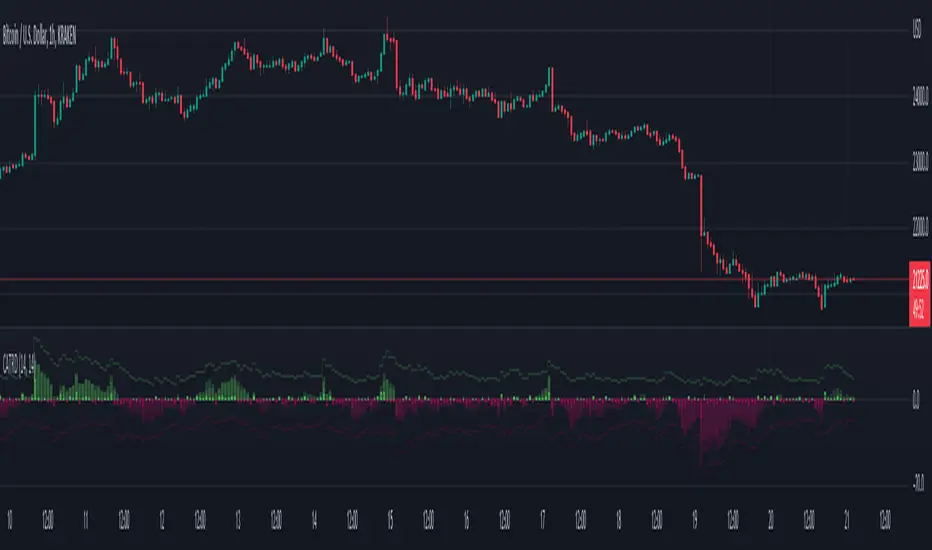
Why is it important? CVD shows aggressiveness of buyers and sellers. And in order for a bull run to sustain you need aggressive buyers hitting the ask. If the price goes up, but CVD goes down - unlikely this bull trend will last long.
You might want to choose a recent top or bottom as the start point and check whether the aggressiveness of market participants corresponds to the price movement since that peak. For example on the chart above we can see that the price was going up and down, but the aggressiveness clearly points down. Does it mean that we will have a long bear market? No. It means that until the aggressiveness starts pointing up we should not expect a bull market. It might happen tomorrow, or might happen in a month. Nobody knows. But until it starts happening - don't expect the real bull.
Additionally, candles where the aggressiveness went the opposite direction from the price are marked with a blue dot above them.
Note: the smaller the custom time frame of the indicator - the more correct the results are. However, the drawback is that shorter the lookback period will be. The actual length will depend on your subscription level and the number of subcandles of the selected instrument.

CVD - Cumulative Volume Delta Candles (old version)An old session of CVD from Tradingview. I noticed that the latest version of CVD has errors in calculations between different timeframes and with other similar indicators by other authors.

Estimated Time At Price [Kioseff Trading]Hello!
This script uses the same formula as the recently released "Volume Delta" script to ascertain lower timeframe values.
Instead, this script looks to estimate the approximate time spent at price blocks; all time estimates are in minute.second format.
The image above shows functionality. Time spent at price levels/blocks are estimated in duration. The highest estimated block is the highlighted level and a POC line is extended right until violated. Colors, the presence of POC lines and whether they're removed subsequent violation are all configurable.
As show in the image above, the data is displayable in an additional format. When select the "non-classic" format shown above - precise price levels are calculated and the estimated time spent at those levels is summed and displayed right of the current bar. The off-colored level (yellow in the example) denotes the price level encompassing the highest *estimated* time spent.
You can deselect the neon effect and choose to have the script recalculate after any conceivable amount of time has passed.
The script can also calculate for the most current bar should you configure it to do so.
That's all! (for now). A quick/easy script building off an existing foundation.
If you've any ideas for features and ways to "spice up" this script please let me know (: I'll gladly incorporate requests.
Thank you!

Cumulative ATR Distance Oscillator// A Price/ATR oscillator with cumulative waves.
// Based on Cumulative Volume Delta, but using price movement alone.
// Public Domain
// By Jolly Wizard