Squeeze Momentum Indicator [LazyBear]
Fixed a typo in the code where BB multiplier was stuck at 1.5. Thanks @ucsgears for bringing it to my notice.
Updated source: pastebin.com
Use the updated source instead of the what TV shows below.
This is a derivative of John Carter's "TTM Squeeze" volatility indicator, as discussed in his book "Mastering the Trade" (chapter 11).
Black crosses on the midline show that the market just entered a squeeze (Bollinger Bands are with in Keltner Channel). This signifies low volatility, market preparing itself for an explosive move (up or down). Gray crosses signify "Squeeze release".
Mr.Carter suggests waiting till the first gray after a black cross, and taking a position in the direction of the momentum (for ex., if momentum value is above zero, go long). Exit the position when the momentum changes (increase or decrease --- signified by a color change). My (limited) experience with this shows, an additional indicator like ADX / WaveTrend, is needed to not miss good entry points. Also, Mr.Carter uses simple momentum indicator, while I have used a different method (linreg based) to plot the histogram.
More info:
- Book: Mastering The Trade by John F Carter
List of all my indicators:
Search in scripts for "电力行业+股票+11年涨幅"

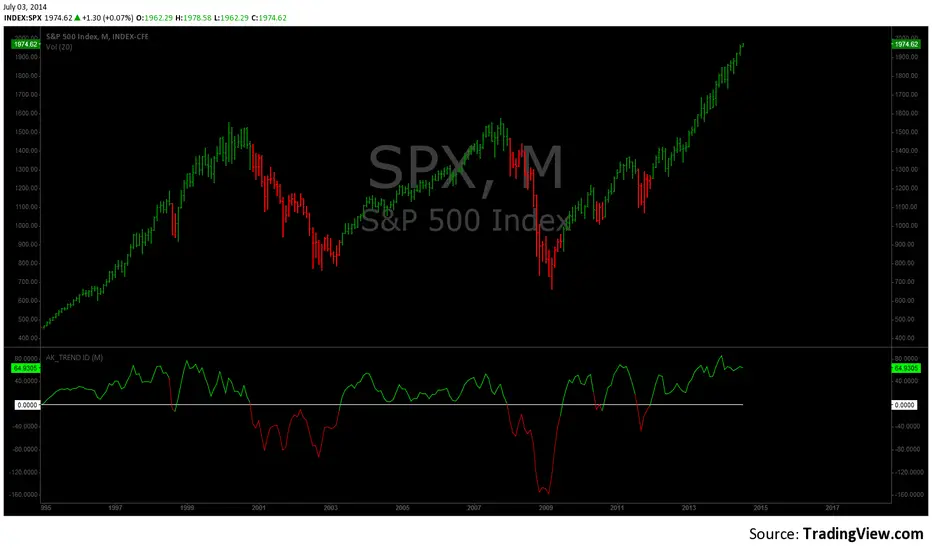
AK TREND ID v1.00Hello,
"Are we at the top yet ? "........ " Is it a good time to invest ? " ......." Should I buy or sell ? " These are the many questions I hear and get on the daily basis. 1000's of investors do not know when to go in and out of the market. Most of them rely on the opinion of "experts" on television to make their investment decisions. Bad idea.Taking a systematic approach when investing, could save you a lot of time and headache. If there was only a way to know when to get in and out of the market !! hmmmm. The good news is that there many ways to do that. The bad news is , are you disciplined enough to follow it ?
I coded the AK_TREND ID specifically to identified trends in the SPX or SPY only . How does it work ? very simply , I simply plot the spread between the 3 month and 8 month moving average on the chart.
If the spread > 0 @ month end = BUY
if the spread < 0 @ month end = SELL
The AK TREND ID is a LAGGING Indicator , so it will not get you in at the very bottom or get you out at the very top. I did a backtest on the SPX from 1984 to 7/2/2014 (yesterday), The rule was to buy only when the AK TREND ID was green. let's look at the result:
14 trades : 11 W 3 L , 78.75 % winning %
Biggest winner (%) = 108 %
Biggest loser (%) = -10.7 %
Average Return = 27 %
Total Return since 1984 = 351.3 %
You can see the result in detail here : docs.google.com
Although the backtesting results are good, the AK TREND ID is not to be used as a trading system. It is simply design to let you know when to invest and when to get out. I'm working a more accurate version of this Indicator , that will use both technical and fundamental data. In the mean time , I hope this will give some of you piece of mind, and eliminate emotions from your trading decision. Feel free to modify the code as you wish, but please share your finding with the rest of Trading View community.
All the best
Algo