Crypto Market Cap, BTC/USD, ETH/USD, USDT/USD, XRP/USD, Bitcoin
Apple, Advanced Micro Devices Inc, Amazon Com Inc, TESLA INC, NETFLIX INC, Facebook Inc
S&P 500, Nasdaq 100, Dow 30, Russell 2000, U.S. Dollar Index, Bitcoin Index
US 10Y, Euro Bund, Germany 10Y, Japan 10Y Yield, UK 10Y, India 10Y
**DESIGNED FOR ES/MES** This script provides an easy visualization of potential reversion zones to take trades back to the intraday midline. A common use would be to enter a position once price reached the outer yellow zones and retreats to either the red zone (for a short toward the midline) or a green zone (for a long back to the midline).
Simple script that plots the range between the previous day close and the current day open. This makes it easier to reference the gap up or gap down zone throughout the day.
Regular script to allocate the specified time range within a day. TradingView in time is specified by UTC. I Moscow time (GMT +3) and the time specified in the script Default 1:00 - 13:00 Moscow time equal 09:00 - 21:00 ie -8 Hours from the Moscow time (-7 in summer). ========== ========== Обычный скрипт для выделения указанного диапазона времени внутри...
Visualize on your chart when price in an oversold or overbought zone. A combination of Rsi and Stochasticrsi is used for higher probability. Wait for an zone to be displayed and then wait for price to exit a zone. Once this happens check candlestick patterns and support/resistance "lines" to find appropiate stoplosses for you entry or exit
This simple indicator paints the zone between up to 3 different Moving Averages and Exponential Moving Averages. For example: The green zone is the price between the 50 EMA and the 50 MA . The orange zone is the price between the 100 EMA and the 100 MA . The red zone is the price between the 200 EMA and the 200 MA .
The Zone is mention in New Trading Dimensions by Bill Williams,PhD. The Zone is used for Entry Signal Green Zone are painting Green Bars when Awesome Oscillator (AO) and Accelerater/Decelerator (AC) are both increasing. Red Zone are painting Red Bars when Awesome Oscillator (AO) and Accelerater/Decelerator (AC) are both decreasing. Gray Zone are painting Gray...
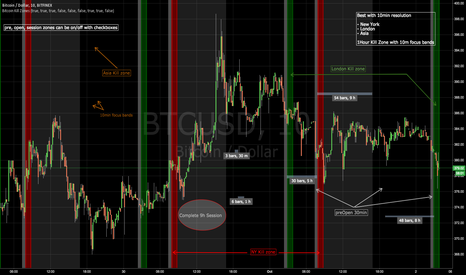
Daily OHL + Weekly OHL + intraday kill zones Vertical Boxes Color Code: brownish-red = Asian range time frame blue = London Open kill zone green = NY kill zone purple = London Close kill zone
Upgraded indicator Margin Zones with various number of options: - Number of Days Ago to limit days when Zones are visible - Price, margin and ticks can be set with decimal point - Zones can be switched off separately - all line are editable
**DESIGNED FOR NQ/MNQ** This script provides an easy visualization of potential reversion zones to take trades back to the intraday midline. A common use would be to enter a position once price reached the outer yellow zones and retreats to either the red zone (for a short toward the midline) or a green zone (for a long back to the midline).
This script plots 10 exponential moving averages and marks the areas between them. The lengths are Fibonacci numbers starting from 5 and ending with 377. The colors indicate the length of the moving average, green for the shortest and purple for the longest. The zones between consecutive EMA's (e.g. 5 and 8 ema ) are market according to the color of the greater...
Extended Stochastic with All Zones. From Neutral to Danger Zones. The Most Complete and Extended Stochastic Indicator.
This script is basically a showcase of what you can graphically do to a moving average. You have access to 2 sets of 4 moving averages each of those can use HA Candles as a source ( calculated in the script will not repaint if you are concerned with that ) additional smoothing to each set a multitude of moving average types I am too lazy to type out (...
Bill Williams Zone and Squat Bars. See New Trading Dimensions by Bill Williams, PhD. Bars are green (green zone) when the Awesome Oscillator and Accelerator/Decelerator are both positive. Bars are red (red zone) when the Awesome Oscillator and Accelerator/Decelerator are both negative. Bars are blue when a squat bar is formed, these indicate a battle between...
The adaptive price zone (APZ) is a volatility-based technical indicator that helps investors identify possible market turning points, which can be especially useful in a sideways-moving market. It was created by technical analyst Lee Leibfarth in the article “Identify the Turning Point: Trading With An Adaptive Price Zone,” which appeared in the September...