Get Ready for Cardano’s Wave 3Hello Everyone,
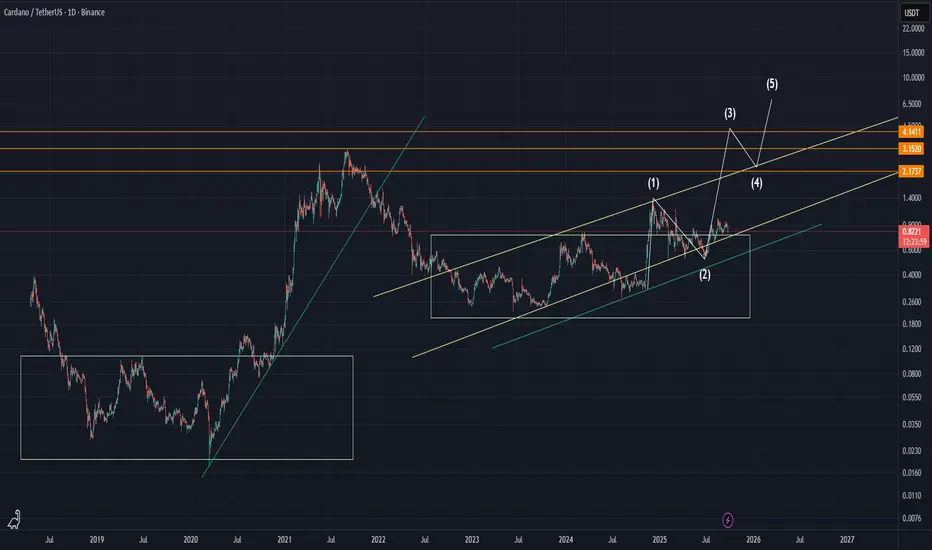
Cardano appears to be gearing up for Wave 3 of the Elliott Wave cycle. After a relatively slow and corrective Wave 2, which often tests traders’ patience, the next impulsive wave could be starting soon. Many traders tend to give up during Wave 2 due to the mental pressure it brings—but those who stay prepared may benefit the most from Wave 3.
Stay alert and get ready for what’s coming.
Best regards,
Sam
Trade ideas
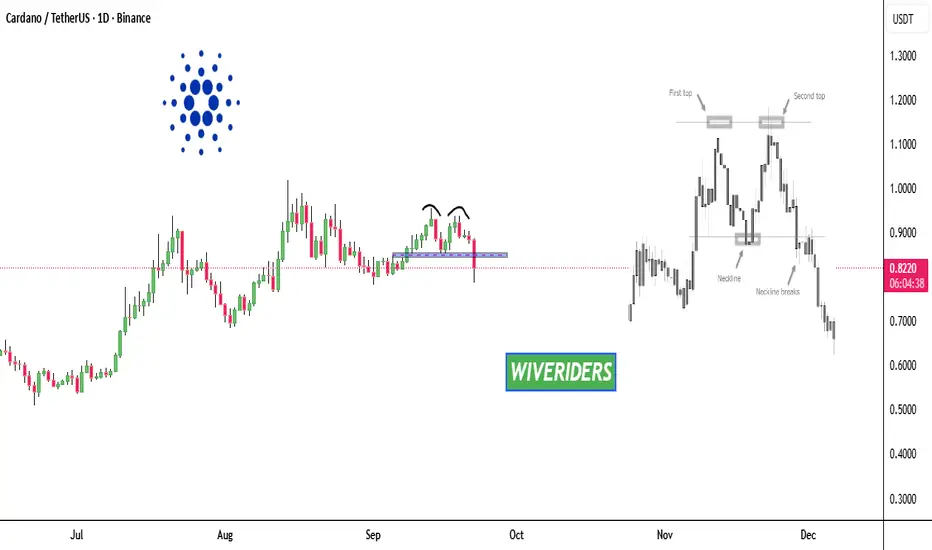
ADA has formed a bearish Double Top pattern 📊 CRYPTOCAP:ADA Price Update
ADA has formed a bearish Double Top pattern ⚠️
At the moment, ADA remains in a bearish trend 📉 with no signs of price stabilization yet.
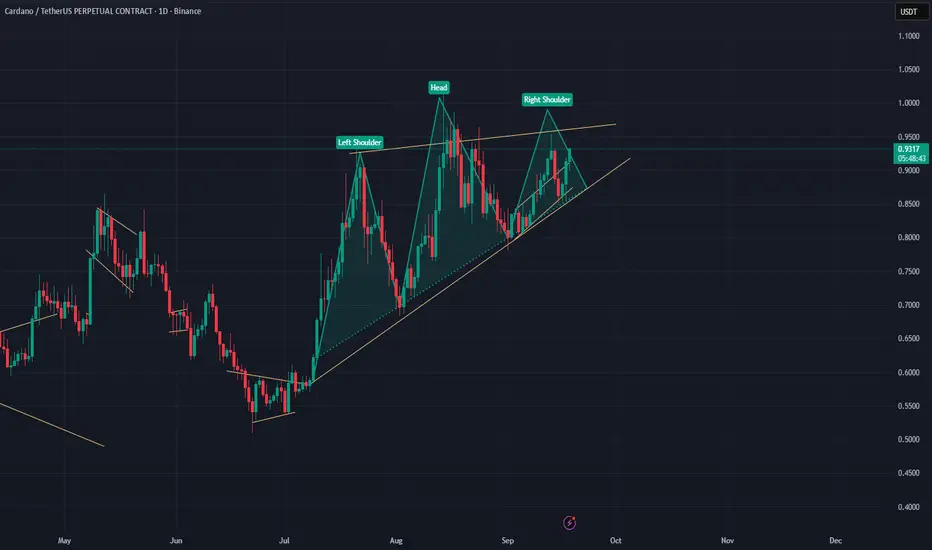
ADAUSDT Bearish Head and Shoulders Pattern formedADAUSDT formed a bearish head and shoulders pattern on 1D time frame which indicates towards ~ 0.50

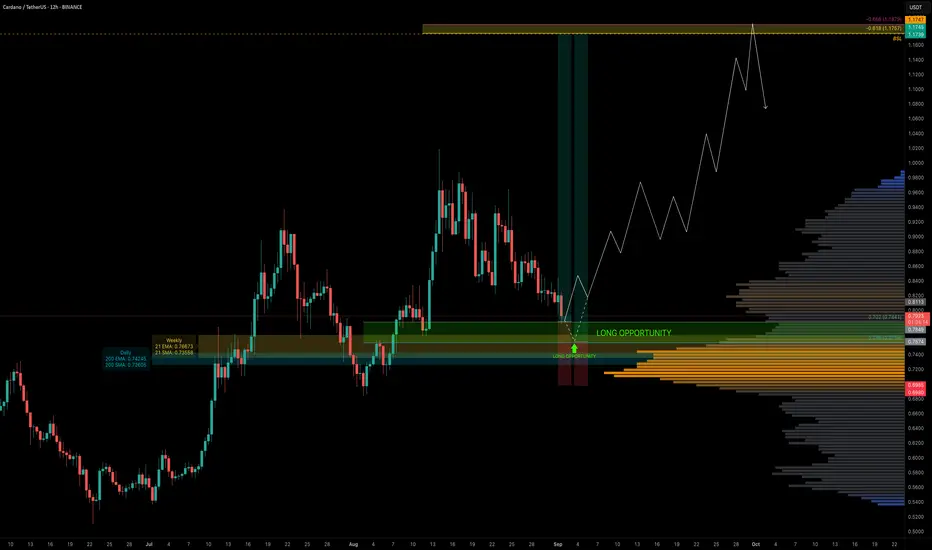
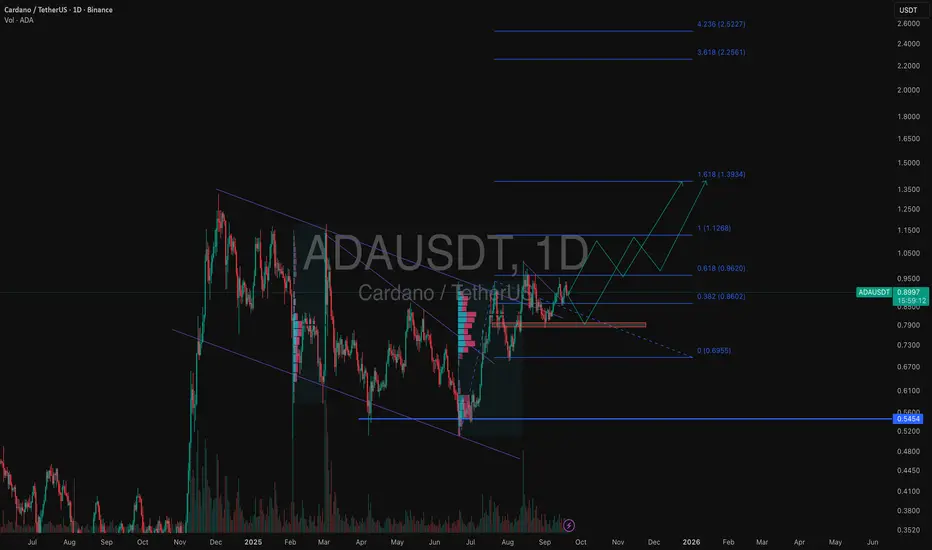
ADA — Fib Harmony With EMA/SMA SupportADA has been in a downtrend for the past 18 days and is now approaching a cluster of key support levels. Today, price tapped the 0.702 Fib retracement ($0.7841) — an optimal area for long entries.
The main focus, however, is the 0.786 Fib retracement, which aligns with a liquidity pocket and multiple layers of confluence, making it the most ideal entry zone.
🧩 Confluence at 0.702–0.786 Fib Zone
0.702–0.786 Fib retracement → prime long entry range
Liquidity pocket → sitting around the 0.786 Fib
200 EM ($0.7424) / 200 SMA ($0.726) (daily)
21 EMA ($0.766) / 21 SMA ($0.735) (weekly)
Pitchfork lower support line → intersecting the zone
0.618/0.666 Fib Speed Fan → adding another support layer
🟢 Long Trade Setup
Entry Zone: 0.702–0.786 Fib retracement
Best Entry: Around the 0.786 Fib
Stop-Loss: Below $0.70 (to be adjusted after seeing more price action)
Target (TP): $1.1757 (–0.618 Fib, in confluence with key high & buy-side liquidity at $1.1747)
Potential Move: +50%
R:R: ~1:4.5 up to 1:7 (depending on entry)
Technical Insight
ADA is testing deeper retracements within its current downtrend, the 0.702–0.786 Fib zone combines structural, dynamic, and liquidity-based confluence.
The added support of the weekly 21 EMA/SMA strengthens this area as a pivotal level for bulls to defend.
If held, this zone could fuel a swing long setup with great upside potential.
The $1.1747–$1.1757 zone is both a high-confluence take-profit area and a potential short opportunity, given the liquidity resting above that level.
🔍 Indicators used
LuxAlgo — Liquidity Sentiment Profile (Auto-Anchored)
Multi Timeframe 8x MA Support Resistance Zones → to identify support and resistance zones such as the weekly 21 EMA/SMA
➡️ Available for free. You can find it on my profile under “Scripts” and apply it directly to your charts for extra confluence when planning your trades.
_________________________________
💬 If you found this helpful, drop a like and comment!
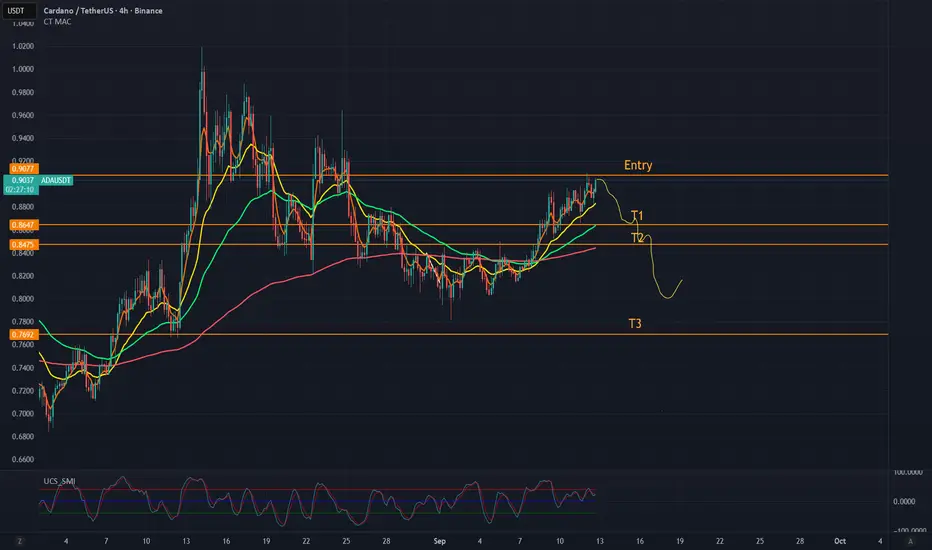
[Crypto] - Cardano (ADA) - ShortPerfect Entry for a Short Position at this Level. (0.9040)
I'm expecting a larger drop of BTC within the next days, ultimate goal there round about 106000,-
As Alts are moving most of the time in the same direction, sometimes with even more power, I looked for the best one to short and came to ADA.
It is currently at a great level for a reversal.
Targets:
T1: 0,8650
T2: 0,8470
T3: 0,7700
Target 3 would be my ultimate goal if BTC drops to my expected 106000 level.
Have fun, no trading advise as always and if there are questions, feel free to drop me a comment.
ADA/USDT; FREE SIGNALHello friends
According to the market cycle, you can see that every time after the price growth we had a correction and now it seems that the price wants to exit the correction and have a new growth. If the support levels continue, the price can move to the specified targets.
*Trade safely with us*

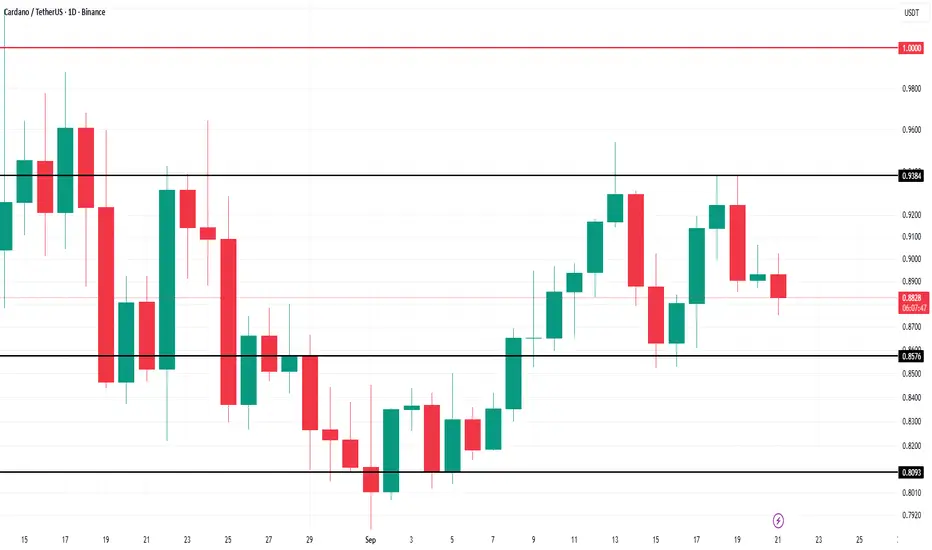
Cardano Whales $500 Million ADA Selling To Delay Price Rise To $Cardano’s price sits at $0.888 at press time, holding slightly above the $0.880 support. However, the current environment suggests a risk of losing this critical level if bearish sentiment intensifies. The vulnerability to downside remains clear as whale selling persists.
Should ADA fall through $0.880, the next key support sits at $0.837. A drop to this level would extend recent losses and may prompt further liquidation from smaller holders, creating additional downward pressure. This could stall ADA’s path to recovery.
Conversely, a successful bounce off $0.880 could open a short-term rally toward $0.931. Flipping this resistance into support would improve market sentiment, enabling ADA to target $0.962. Breaking this barrier would invalidate the bearish thesis and bring Cardano closer to $1.
Cardano: accumulation zone and looming liquidations near $1ADAUSDT has moved into a corrective channel after its recent rally, consolidating around $0.90 and testing the upper boundary. Support at $0.8890 is still intact, making the structure look like accumulation before a new leg up. The near-term outlook suggests a breakout toward $0.92 and $0.93, with a more cautious path involving a pullback to $0.8960–0.8940 before another push higher.
Fundamentally, Cardano remains a top altcoin thanks to its strong community and smart contract ecosystem. But the current market focus is on a very practical factor: a breakout above $0.96–1.00 could trigger massive short liquidations estimated between $70M and $100M. Such a liquidation cascade could accelerate ADA’s rally toward $1 and beyond. On the flip side, if resistance holds, a return toward $0.87 and lower remains possible.
In short, the $0.96–1.00 zone is a powder keg break it and ADA can explode higher, fail it and bulls will have to wait for another attempt.
Cardano long to $0.9542Just recently opened a long position on cardano. Aiming for $0.9542 but scaling out along the way.
Sl: 0.8840
Partial tps on chart

ADA/USDT | Cardano Battles $0.93 – Breakout Targets $1+ Ahead!By analyzing the Cardano (ADA) chart on the 3-day timeframe, we can see that after rising from $0.85 to $0.93, the price faced a correction and is now trading around $0.89. The $0.93 level has turned into a key resistance, and if ADA manages to break above it, we can expect a stronger bullish move.
The possible upside targets for this rally are $1.00, $1.05, $1.17, and $1.33.
Please support me with your likes and comments to motivate me to share more analysis with you and share your opinion about the possible trend of this chart with me !
Best Regards , Arman Shaban

Ada/usdtIn the 1-hour timeframe, if Cardano manages to break its resistance level at 0.900, it may move toward the higher target of 0.9554.
When entering a position, the stop-loss should be placed at 0.8890

ADAUSDT | 15 M | Market Structure | Bearish Price Trend| 2 of 2On the 15M chart, after the last LL, price has stopped pushing lower and is now moving sideways in a range.
1. There is no fresh LL or HH, indicating indecision.
2. This suggests the market is in consolidation, pausing before its next move.
Our course of action:
1. Do NOT trade inside the range → risk of chop and poor R:R.
2. Wait for confirmation:
i. A bearish break of structure from the range → signals continuation short, in line with the 1H bias
ii. A bullish break of structure → would signal a potential shift, but longs should only be treated as quick scalps since the 1H is still bearish.

ADAUSDT | 1 H | Market Structure | Bearish Price Trend| 1 of 2On the 1H chart, price is showing bearish sentiment.
1. On the 1H chart, price is showing bearish sentiment.
2. We have a series of Lower Highs (LH) and Lower Lows (LL).
3. Multiple Breaks of Structure (BoS) confirm that sellers remain in control.
4. This sets our higher time frame bias to bearish, meaning we should primarily look for short setups unless structure flips bullish.

adausdtThe Cardano currency is in a large weekly and monthly channel, and its price can touch the targets of $1.2, $1.5, $2, $2.3, and $3, respectively, and if the historical ceiling is broken, it can move towards the target of $5.

ADA/USDT – 1H OutlookCardano is pulling back after failing to sustain its upward momentum. Price is now approaching the demand zone around 0.885 – 0.890, which will act as a key validation level.
If demand holds, ADA may rebound and retest resistance near 0.936.
A breakdown below demand would weaken the short-term bullish structure and trigger a deeper correction.
At this stage, the demand zone remains the decisive area for ADA’s next move, determining whether buyers can regain control or sellers extend the downside.

Hidden Altcoin Opportunities Every Trader Should Notice TodayDo you know some altcoins are offering golden opportunities right now?
The market is full of sudden moves that only sharp eyes can catch.
In this analysis, you will learn how to discover and use these opportunities.
Hello✌️
Spend 2 minutes ⏰ reading this educational material.
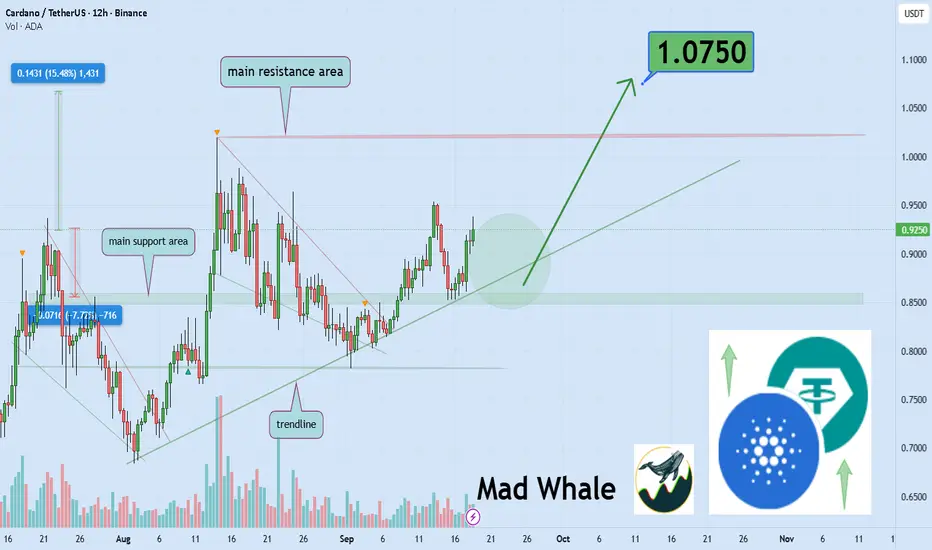
🎯 Analytical Insight on Cardano:
ADA is holding near a strong trendline and daily support, signaling a potential 15% upside toward 1.075. 🔥
Now , let's dive into the educational section,
💹 Recent Altcoin Trends
The altcoin market is experiencing significant volatility.
Some altcoins show sudden movements with low trading volume.
Professional traders spot opportunities within these moves.
Several altcoins remain largely unnoticed by the general market.
Analyzing trends helps you anticipate the next directional move.
Short-term fluctuations often accompany larger market moves.
Understanding these trends increases your chances of successful entry.
Small movements can provide clues to bigger opportunities ahead.
🧠 Market Psychology and Trader Behavior
The market is influenced by fear and greed among traders.
Smaller altcoins often react strongly to market emotions.
Understanding collective behavior helps you make rational decisions.
Successful traders wait for clear signals and reliable indicators.
Identifying the right timing for entry is possible with market psychology.
Careful observation allows you to avoid impulsive reactions.
🔍 Hidden Opportunities
Some altcoins are still under the radar.
Analyzing trading volume and trends reveals these opportunities.
Short-term trends can indicate potential major moves.
Combining data analysis with market observation is key to spotting these opportunities.
Quick yet logical decision-making increases profitability.
Tools and indicators provide clarity for entries and exits.
Spotting opportunities before others gives a significant competitive advantage.
Focusing on lesser-known altcoins multiplies your chance of success.
📊 TradingView Tools and Indicators
RSI
Shows overbought or oversold conditions, helping to predict short-term moves.
MACD
Indicates trend changes and bullish or bearish crossovers for entry and exit points.
Volume Profile
Identifies key support and resistance levels based on trading volume.
Moving Averages
Highlights long-term and short-term trends, clarifying market direction.
Combination
Using multiple tools together reduces errors and increases analysis accuracy.
Practical Use
By checking several indicators at once, you can identify low-risk entry points.
📝 Summary
The altcoin market is full of opportunities.
By analyzing trends, market psychology, and indicators, make smarter decisions.
Focus and proper use of tools are the keys to success.
🌟 Three Essential Recommendations for Traders
Focus on lesser-known opportunities
Instead of following the market hype, focus on overlooked altcoins.
Combine psychology and indicators
Always strengthen your decisions with both collective behavior analysis and technical tools.
Manage greed and emotions
Base your entries and exits on data, and don’t let emotions or greed dictate your decisions.
✨ Need a little love!
We pour love into every post your support keeps us inspired! 💛 Don’t be shy, we’d love to hear from you on comments. Big thanks, Mad Whale 🐋
📜Please make sure to do your own research before investing, and review the disclaimer provided at the end of each post.
AdaTechnical Strength: Exceptionally bullish with RSI at 66.53, positive MACD, and 15/26 indicators showing buy signals. Open interest surge of +7.96% to $1.85B indicates massive institutional positioning so this means that the uptrend will continue
Here is our long entry
Entry 1: $0.9
Entry 2: $0.8740 (midpoint to support)
Entry 3: $0.840(near pivot support)
Average Entry: $0.8784
Target: $0.95
$0.98
$1
Stop Loss: $0.8363
Risk/Reward: 8.72:1 (Excellent)
I offer Private one on one classes. until you learn everything.
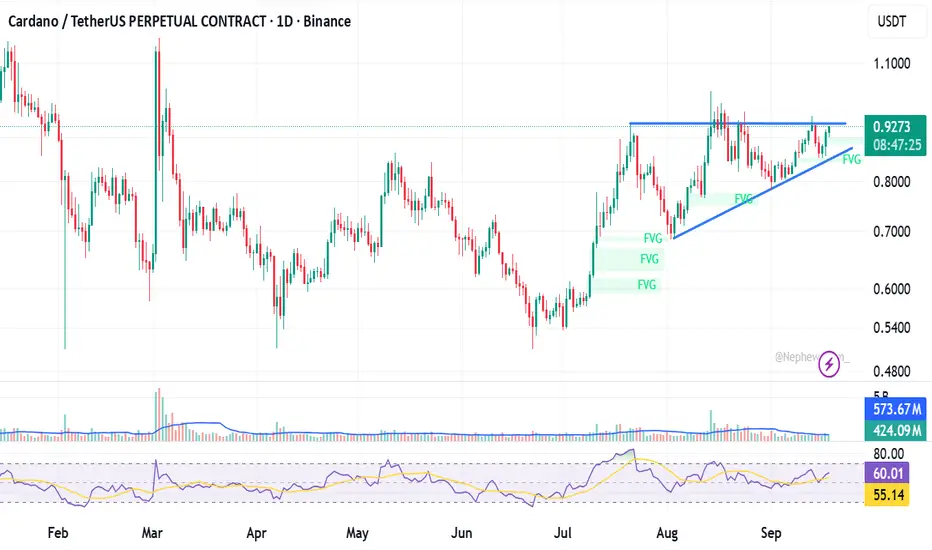
ada ascending triangle potential breakoutlook out for ada pontential ascending triangle..
risk: monitor closely for the price if the breakout candlestick hit the break the lower trendline, it will become fakeout ascending triangle. always put sl on entry after successful breakout.
ADA Strengthens as Inflows Hit Multi-Week High
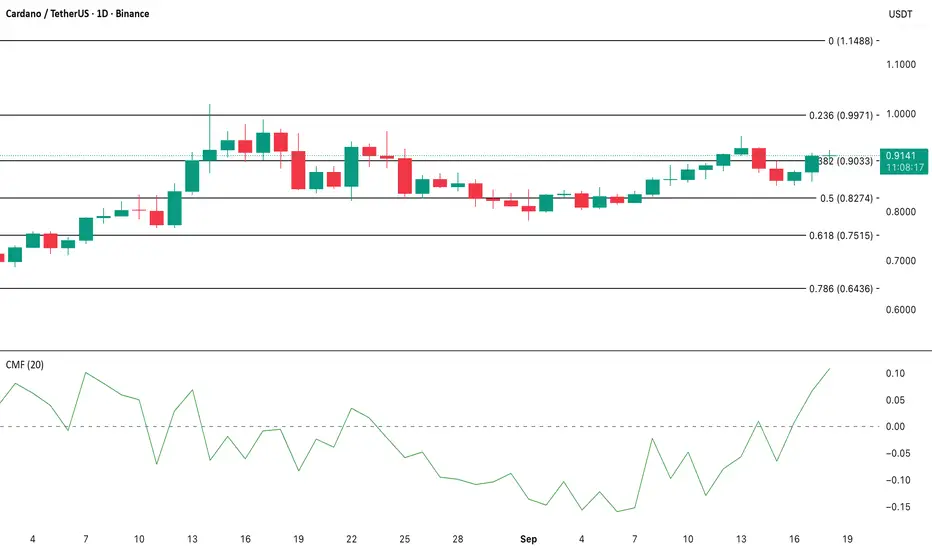
Readings from the ADA/USD one-day chart show the bullish bias around the altcoin. Momentum indicators are aligning with market optimism, suggesting that ADA could continue to attract demand in the near term.
The Chaikin Money Flow (CMF) has trended upward consistently, now reaching a 42-day high of 0.11. This metric tracks volume-weighted capital flows, and a sustained positive reading indicates that market participants are favoring accumulation over distribution.
The notable uptick in CMF reflects that ADA’s price is supported by genuine inflows. This buying pressure provides a solid foundation for further upside potential, strengthening the bullish case for ADA in the current market setup.
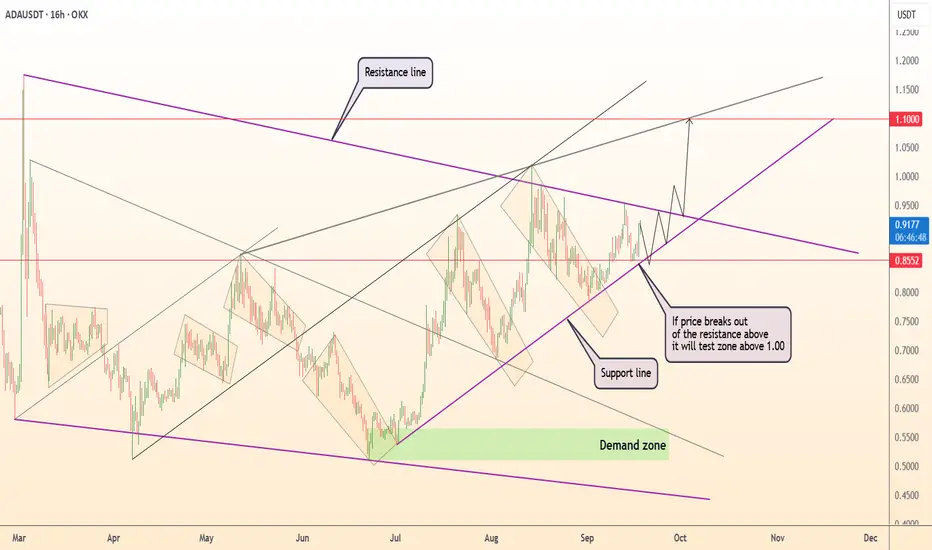
DeGRAM | ADAUSD seeks to the $1.1 level📊 Technical Analysis
● ADA/USD is consolidating near 0.92 after reclaiming the support line, with price compressing under a key resistance zone.
● A breakout above 0.95 could accelerate momentum toward 1.10, confirming bullish continuation within the rising channel.
💡 Fundamental Analysis
● Cardano’s network growth, highlighted by increased dApp activity and higher staking participation, underpins demand and supports the breakout thesis.
✨ Summary
Bullish above 0.85; targets 0.95 → 1.10. Invalidation on a close below 0.85.
-------------------
Share your opinion in the comments and support the idea with a like. Thanks for your support!
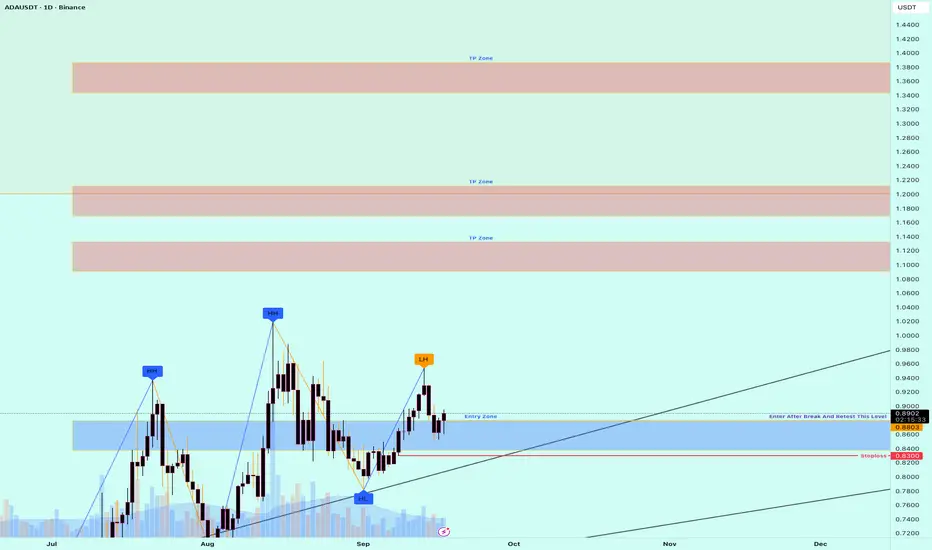
Cardano (ADA) – Technical Outlook and Key Market LevelsDescription:
Cardano (ADA) is one of the leading blockchain platforms, designed for scalability, interoperability, and sustainability. Its native token ADA ranks among the top cryptocurrencies by market capitalization, supported by a strong developer community and ongoing upgrades such as smart contracts and ecosystem growth.
In this analysis, I share a clean technical outlook on ADA with focus on key price levels, trend structure, and momentum signals. The chart highlights potential scenarios for both bullish and bearish traders, providing insights into short- and medium-term opportunities.
⚠️ Disclaimer: This is not financial advice. The content is for educational and informational purposes only. Always do your own research and manage risk responsibly.
#Cardano #ADA #Crypto #Blockchain #TechnicalAnalysis #CryptoTrading #Altcoins #ChartAnalysis #PriceAction
ADA/USDT – Will the Bulls Defend This Zone?Cardano is back at a critical demand zone (0.85 – 0.86) 📉.
This level has been holding price for a while, and buyers may step in again to push us higher.
📊 Bullish Scenario:
If ADA holds above this green zone, we could see a bounce towards 0.89 – 0.90, where major supply/resistance awaits.
⚠️ Bearish Scenario:
Failure to defend this demand zone could send ADA back below 0.82, so risk management is key.
🔍 My watch:
Looking for bullish confirmation (candle rejection / higher low) before entering longs.
Targeting the red zone for profit-taking.
---
💬 What do you think? Will ADA bounce strong from support, or are we heading lower first?
👇 Drop your thoughts in the comments – let’s share analysis!
#ADA #Cardano #Crypto #Altcoins #PriceAction #Trading

ADA/USDT: Consolidation Above Support Signals Bullish ContinuatiADA/USDT is currently consolidating above the 0.85 support zone after rebounding from the upward trendline, indicating a potential continuation of the uptrend. The recent breakout from a descending triangle pattern points to a shift in momentum, with higher lows supporting the bullish structure.
If the price continues to hold above 0.85, the next upside targets lie near 0.965, followed by resistance at 1.05. As long as the support base remains intact, buyers retain control, and momentum favors further gains.
