Peers for comparison


Market capitalization
‪46.26 B‬ AEDLarge cap
0.25 AED
‪4.02 B‬ AED
‪13.83 B‬ AED
‪9.52 B‬
Beta (1Y)
0.62

Company info


Sector
CEO
Bill O’Regan
Headquarters
Abu Dhabi
Founded
2005
IPO date
Dec 4, 2017
ISIN
AEA006501018
FIGI
BBG000Q6QNY1
Identifiers
ISIN AEA006501018
Modon Holding PSC engages in the provision of investment management services. It operates through the following segments: Real Estate, Hospitality, Labour Accommodation, Investments, and Others. The Real Estate segment includes the district cooling and air conditioning, investment in infrastructure projects, landscaping design, and execution and sale of properties. The Hospitality segment is involved in commercial and contracting services contract relates to hotel business. The Labour Accommodation segment composed of services with respect to labour camp rental, management services, and sale of food and cafeteria items. The Investments segment includes dividend income, related costs and fair value changes of financial investments in equity securities, managed funds, bonds and other investments and securities within UAE and abroad. The Others segment represents head office expenses and income not allocated to any segment. The company was founded on May 30, 2005 and is headquartered in Abu Dhabi, United Arab Emirates.
Performance
Revenue to profit conversion
Debt level and coverage
Earnings
Next:—
Summarizing what the indicators are suggesting.
Oscillators
Neutral
Oscillators
Neutral
Summary
Neutral
Summary
Neutral
Summary
Neutral
Moving Averages
Neutral
Moving Averages
Neutral
Displays a symbol's price movements over previous years to identify recurring trends.
Weight0.02%
Market value‪28.41 M‬
Weight0.02%
Market value‪2.54 M‬
Weight0.02%
Market value‪2.44 M‬
Weight0.02%
Market value‪1.05 M‬
Weight0.02%
Market value‪1.05 M‬
Weight0.22%
Market value‪672.70 K‬
Weight0.02%
Market value‪507.06 K‬
Weight1.04%
Market value‪425.00 K‬
Weight1.04%
Market value‪425.00 K‬
Weight0.04%
Market value‪231.19 K‬

Explore more ETFs 

Frequently asked questions


MODON stock is 2.55% volatile and has beta coefficient of 0.62.

What it means:
– Volatility: Shows how much the price fluctuates over time
– Beta > 1: More volatile than the market
– Beta < 1: Less volatile, more stable

Important to know:
– Volatility can increase during earnings, news events, or market stress
– Large-cap stocks like MODON are typically less volatile than smaller companies

Track every detail on Modon Holding PSC stock chart and check out the list of the most volatile stocks — is Modon Holding PSC there?
To understand the MODON stock performance, it's worth checking price changes for various periods to get the full picture:
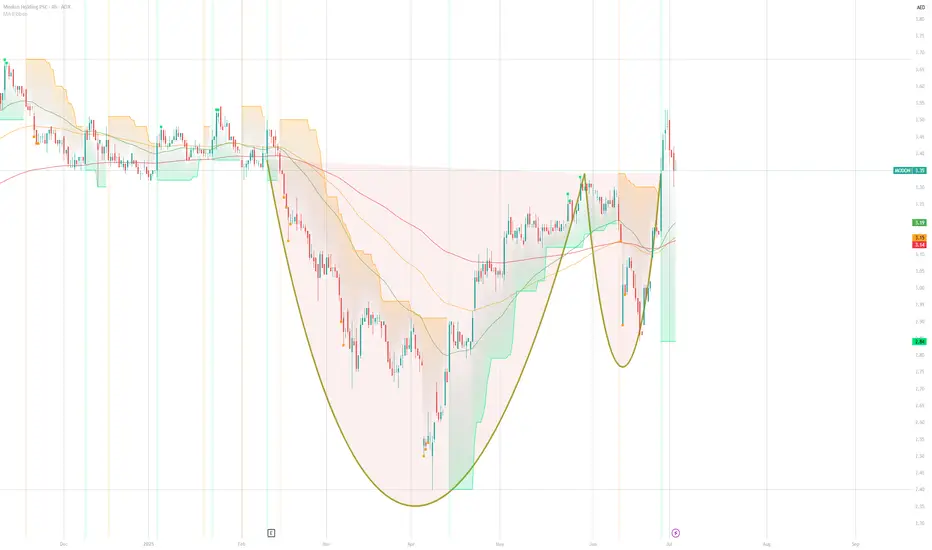
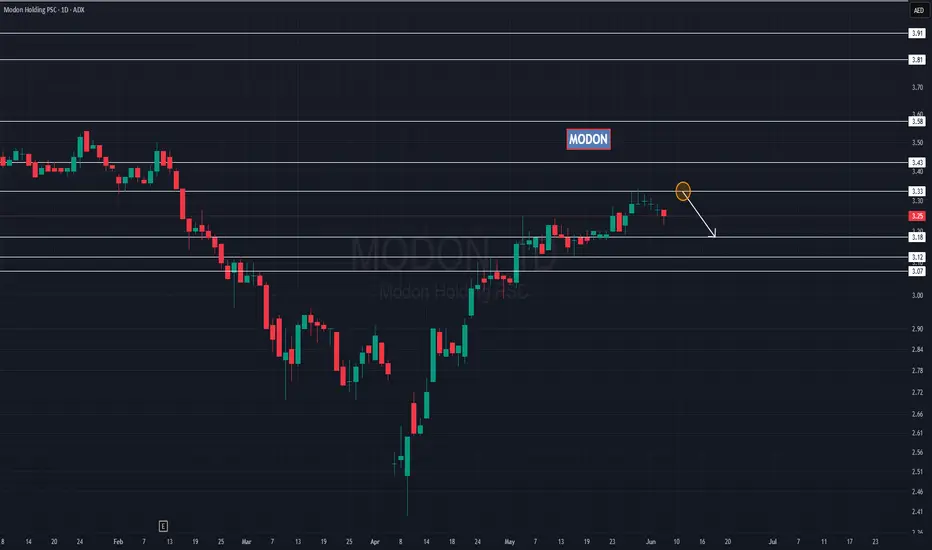
– 1 day — −0.71%
– 1 week — +0.36%
– 1 month — −6.35%

MODON all-time low was 0.67 AED (Feb 14, 2019), and its highest price is 8.00 AED (Oct 25, 2021). Find more dynamics in the Stock Heatmap and on the Modon Holding PSC stock chart.
Modon Holding PSC market capitalization is ‪46.26 B‬, representing the total value of all its outstanding shares (price × shares outstanding).

What it means:
– Market cap is one of the key ways to classify companies (large-cap, mid-cap, etc.)
– It reflects how investors value the company today
– It changes constantly with stock price movements

What to look at next:
– Market cap trends: Rising cap may signal growth and investor confidence; falling cap can reflect risk or downturns
– Price vs shares: Changes can come from Modon Holding PSC stock price moves or share count (buybacks, issuance)
– Valuation ratios: Compare market cap with revenue and earnings
– Peer comparison: See how Modon Holding PSC stacks up against other companies
The safest way to buy Modon Holding PSC stocks is through a reliable broker. Create an account, fund it, and place a buy order.

You can trade MODON directly from TradingView:
– Choose a broker: Explore our supported trading partners and pick one that fits your needs
– Compare options: View available brokers side by side to evaluate fees and features
– Connect your account: Open Supercharts, click “Trade”, select your broker, and log in
– Start trading: Place orders without leaving the chart

Tip: If you’re new to trading, try paper trading first — it lets you practice strategies in real market conditions without risking funds.
Investing in Modon Holding PSC depends on your goals, risk tolerance, and market conditions. It’s essential to analyze the stock before making a decision.

First, study Modon Holding PSC financials and track their dynamics on the Fundamental Graphs:
– Business fundamentals: Revenue, earnings, and growth trends
– Valuation: P/E ratio, market cap, and how it compares to peers
– Profitability: Margins, return on equity, and cash flow
– Dividends (if any): Yield, payout ratio, and consistency

Then explore our MODON technicals – signals based on essential indicators calculations:
– Today — sell
– 1-week — sell
– 1-month — sell

Combine fundamental and technical analysis for better results.
Modon Holding PSC stock ticker depends on the exchange where it’s listed. On the ADX, its primary exchange, Modon Holding PSC stocks trade under the symbol MODON.

About tickers:
– Unique identifiers: A ticker is a short code used to find and trade a stock
– Exchange-specific: The same company may have different tickers across exchanges
– Search shortcut: Used on trading platforms, charts, and screeners

Remember:
– Some companies have multiple listings
– Always check the exchange prefix to avoid confusion

Learn how to find your desired assets in our Symbol Search.
Yes, you can track Modon Holding PSC financials in yearly and quarterly reports right on TradingView.

Use our Earnings Calendar to never miss important releases and spot opportunities early.
MODON net income for the last half-year is ‪2.16 B‬ AED, while the half-year before that showed ‪1.92 B‬ AED of net income which accounts for 12.48% change.

How to read this data:
– Track changes: Compare net income across periods to spot trends
– Watch expectations: Compare with estimates to gauge performance
– Check margins: Net income reflects profitability after all expenses
– Look beyond one period: Consistency matters more than a single result

Follow other essential metrics in Modon Holding PSC financials:
– Revenue: Overall business growth
– Earnings per share: Rising EPS over time often points to improving business performance
– Margins (gross, operating): Efficiency and cost control
No, Modon Holding PSC does not currently pay dividends to its shareholders.

Instead of distributing profits as cash payments, the company may choose to reinvest earnings back into the business — for example, in growth, innovation, acquisitions, or debt reduction.

What to consider instead:
– Earnings growth: Is the company increasing profitability over time?
– Revenue expansion: Is the business scaling its operations?
– Free cash flow: Does it generate enough cash to potentially support future dividends?
– Share buybacks: Some companies return capital through repurchasing shares instead of dividends
MODON reached its all-time high of 8.00 AED on Oct 25, 2021. Its all-time low was 0.67 AED and was reached on Feb 14, 2019.

Explore the Modon Holding PSC stock price chart to see more price history, and discover companies reaching new all-time highs and lows.
Modon Holding PSC EBITDA is ‪4.14 B‬ AED, with an EBITDA margin of 27.64%.

EBITDA is a measure of core operating performance, showing how much profit the company generates from its main business activities before accounting for financing and accounting-related costs.

What it means:
– Operating strength: Helps assess profitability from core operations
– Efficiency signal: Rising EBITDA often reflects improving business performance
– Comparability: Useful for comparing companies with different capital structures

What to look at next in Modon Holding PSC statements:
– Revenue growth: Shows whether the business is expanding
– Net income: Captures full profitability after all expenses
– Free cash flow: Shows actual cash generated
– Debt levels: Important when evaluating earnings quality