AINUSDT is at a critical breakout level.
📊 Possible Patterns
- **Falling Wedge (Bullish Reversal)**
- The descending trendline combined with higher lows suggests a wedge formation.
- Price is pressing against the upper boundary, and a breakout above resistance would confirm the wedge pattern.
- Target projection: height of we
Scalp Long – AIN💎 Scalp Long – AIN
RSI shows a strong bullish divergence, with the 1H timeframe deeply oversold — signaling potential reversal momentum.
Buying volume is returning, and price is holding above key support, reinforcing the long setup.
🎯 Plan:
→ Enter after confirmation of bullish reaction at support
AINUSDT 1D#AIN is moving inside an ascending triangle on the daily chart. Keep an eye on it, as it’s on the verge of breaking out above the resistance zone. If that happens, the potential targets are:
🎯 $0.18233
🎯 $0.20917
🎯 $0.24328
🎯 $0.26109
🎯 $0.28668
🎯 $0.33459
⚠️ Always remember to use a tight stop-lo
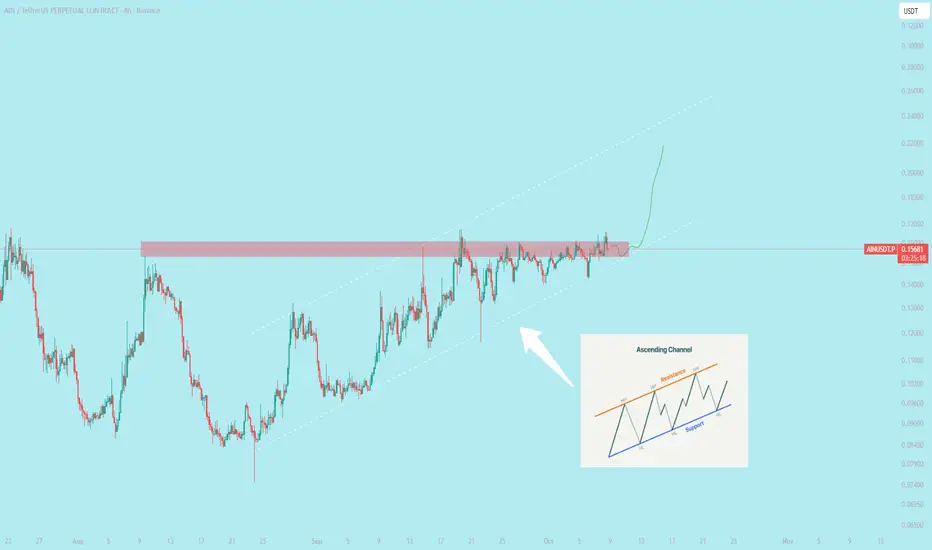
$AIN Perform Ascending Channel Pattern The ascending channel pattern is a chart formation defined by parallel rising trendlines. It signals a steady uptrend and offers clear visual rules for trade entries, targets, and risk management.
Popular across forex, equities, and crypto markets, it helps traders identify logical ranges for su
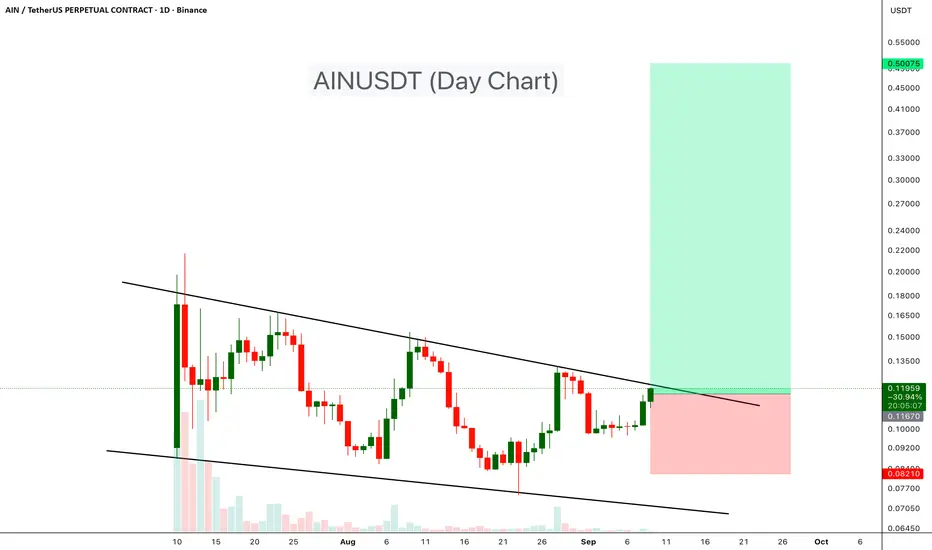
AINUSDT – Watching for a Trend ReversalAINUSDT has been trading inside a descending channel, showing consistent lower highs and lower lows. Price is now testing the upper boundary, and a breakout could open the way for a strong move higher.
- Descending Channel: Clear channel structure since mid-July.
- Current Price Action: Price is
See all ideas
Summarizing what the indicators are suggesting.
Oscillators
Neutral
Oscillators
Neutral
Summary
Neutral
Summary
Neutral
Summary
Neutral
Moving Averages
Neutral
Moving Averages
Neutral
Displays a symbol's price movements over previous years to identify recurring trends.