2.59USD
1.23 BUSD
6.01 BUSD
427.19 M
About Amadeus IT Group SA
Sector
Industry
CEO
Luis Maroto Camino
Website
Headquarters
Madrid
Employees (FY)
18.63 K
Founded
1987
ISIN
ES0109067019
FIGI
BBG0014LYW44
Amadeus IT Group SA engages in the provision of transaction processing solutions to the travel and tourism industry. It operates through the Distribution and Information Technology Solutions segments. The Distribution segment offers global distribution system platform. The Information Technology Solutions segment includes portfolio of technology solutions that automate mission-critical processes for travel providers. The company was founded on October 21, 1987 and is headquartered in Madrid, Spain.

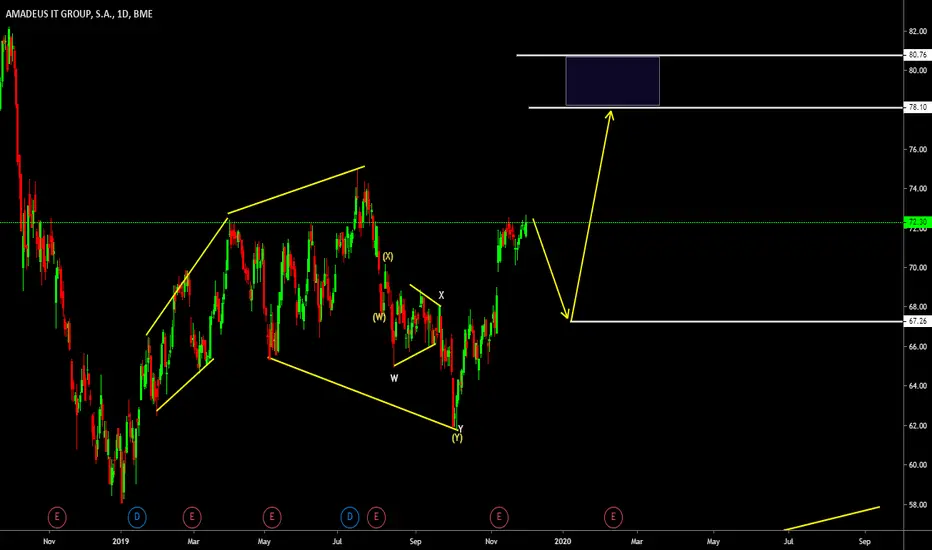
Amadeus IT Group S.A.(AMS.mc) bearish:The technical figure Pennant can be found in Spanish company Amadeus IT Group S.A. (AMS.mc) at daily chart. Amadeus IT Group, S.A. is a major Spanish IT provider for the global travel and tourism industry. The company is structured around two areas: its global distribution system and its Information

AMS Daily TimeframeSNIPER STRATEGY
This magical strategy works like a clock on almost any charts
Although I have to say it can’t predict pullbacks, so I do not suggest this strategy for leverage trading.
It will not give you the whole wave like any other strategy out there but it will give you huge part of the wave.
T

Short Entry Prediction AMS 23-07-2021Short entry for AMS predicted by our AI algorithm. The time horizon of the prediction is approximately 5 days.

Amadeus may retest Weekly EMA200I see volume is decreasing, has already surpassed last suport and I see a probable retest of the weekly EMA200 that even is at the same prace of the Weekly EMA 9.
This could only be plaussible if we are not talking about a fake break of the 57,94 suport.
I expect price to bounce on EMA200 :)
Let'


LARGOS AMADEUSA vigilar. Es un valor débil ahora pero puede dar entrada a corto plazo.
Entrada si supera los 54.75
Stop : por ahora si no no deja un soporte antes sería 44.40
Objetivo: 64.30
Actualizaré stop si da entrada en los próximos días y no anula estructura.


See all ideas
Trade directly on the supercharts through our supported, fully-verified and user-reviewed brokers.


Frequently Asked Questions
The current price of AMADF is 61.50 USD — it has increased by 2.47% in the past 24 hours.
Depending on the exchange, the stock ticker may vary. For instance, on OTC exchange Amadeus IT Group SA stocks are traded under the ticker AMADF.
Amadeus IT Group SA is going to release the next earnings report on May 8, 2024. Keep track of upcoming events with our Earnings Calendar.
AMADF stock is 2.46% volatile and has beta coefficient of 0.96. Check out the list of the most volatile stocks — is Amadeus IT Group SA there?
One year price forecast for Amadeus IT Group SA has a max estimate of 84.93 USD and a min estimate of 61.58 USD.
AMADF earnings for the last quarter are 0.75 USD whereas the estimation was 0.66 USD which accounts for 14.02% surprise. Estimated earnings for the next quarter are 0.59 USD. See more details about Amadeus IT Group SA earnings.
Amadeus IT Group SA revenue for the last quarter amounts to 1.47 B USD despite the estimated figure of 1.48 B USD. In the next quarter revenue is expected to reach 1.50 B USD.
Yes, you can track Amadeus IT Group SA financials in yearly and quarterly reports right on TradingView.
AMADF stock has fallen by 0.73% compared to the previous week, the month change is a 0.97% fall, over the last year Amadeus IT Group SA has showed a 9.49% decrease.
AMADF net income for the last quarter is 231.90 M USD, while the quarter before that showed 318.40 M USD of net income which accounts for −27.17% change. Track more Amadeus IT Group SA financial stats to get the full picture.
Today Amadeus IT Group SA has the market capitalization of 26.46 B, it has increased by 0.04% over the last week.
Like other stocks, AMADF shares are traded on stock exchanges, e.g. Nasdaq, Nyse, Euronext, and the easiest way to buy them is through an online stock broker. To do this, you need to open an account and follow a broker's procedures, then start trading. You can trade Amadeus IT Group SA stock right from TradingView charts — choose your broker and connect to your account.
As of Apr 19, 2024, the company has 18.63 K employees. See our rating of the largest employees — is Amadeus IT Group SA on this list?
Investing in stocks requires a comprehensive research: you should carefully study all the available data, e.g. company's financials, related news, and its technical analysis. So Amadeus IT Group SA technincal analysis shows the sell today, and its 1 week rating is sell. Since market conditions are prone to changes, it's worth looking a bit further into the future — according to the 1 month rating Amadeus IT Group SA stock shows the sell signal. See more of Amadeus IT Group SA technicals for a more comprehensive analysis.
If you're still not sure, try looking for inspiration in our curated watchlists.
If you're still not sure, try looking for inspiration in our curated watchlists.
We've gathered analysts' opinions on Amadeus IT Group SA future price: according to them, AMADF price has a max estimate of 84.93 USD and a min estimate of 61.58 USD. Read a more detailed Amadeus IT Group SA forecast: see what analysts think of Amadeus IT Group SA and suggest that you do with its stocks.
EBITDA measures a company's operating performance, its growth signifies an improvement in the efficiency of a company. Amadeus IT Group SA EBITDA is 2.28 B USD, and current EBITDA margin is 38.33%. See more stats in Amadeus IT Group SA financial statements.