$IWM — The Rate-Cut Leverage PlayLast week delivered one of those classic market paradoxes where everything that should be bearish suddenly became bullish:
layoffs → bullish
weak labor data → bullish
flat inflation → bullish
Why?
Because the market has now fully locked its focus on one thing only:
a Federal Reserve
Key stats
About iShares Russell 2000 ETF
Home page
Inception date
May 22, 2000
Structure
Open-Ended Fund
Replication method
Physical
Dividend treatment
Distributes
Distribution tax treatment
Qualified dividends
Income tax type
Capital Gains
Max ST capital gains rate
39.60%
Max LT capital gains rate
20.00%
Primary advisor
BlackRock Fund Advisors
Distributor
BlackRock Investments LLC
ISIN
US4642876555
IWM is among the best choices in the crowded US small-cap field. The fund tracks the popular Russell 2000 index. IWM's broad basket makes it one of the most diversified funds in the segment. Notably, the fund delves into micro-cap territory, and has often been riskier than our neutral benchmark (as measured by beta) as a consequence. However, including micro-caps is a valid and possibly desirable approach to small-caps, and IWM looks reasonably similar to the benchmark in most other respects.
Related funds
Classification
What's in the fund
Exposure type
Finance
Health Technology
Electronic Technology
Stock breakdown by region
Top 10 holdings

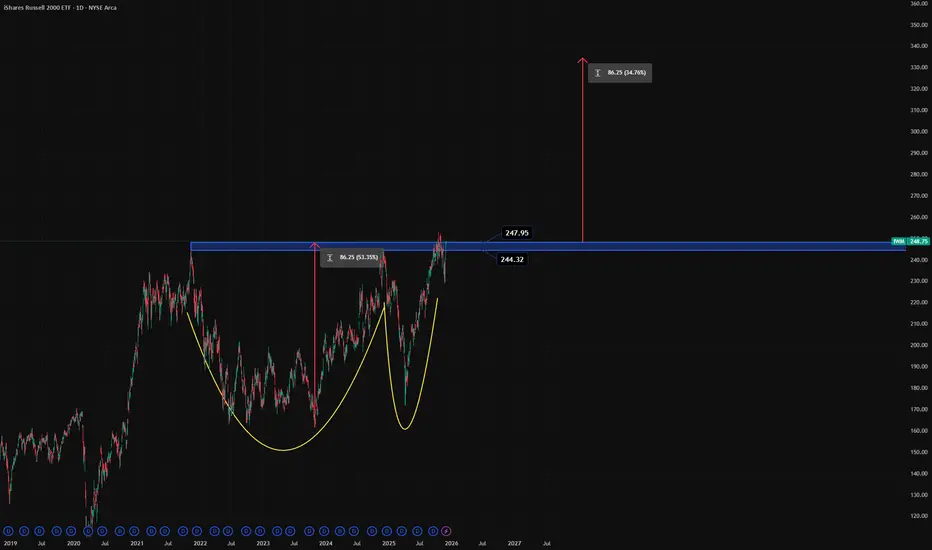
IWM can go up more than you expectWe have here a cup and handle pattern that will send AMEX:IWM to the moon
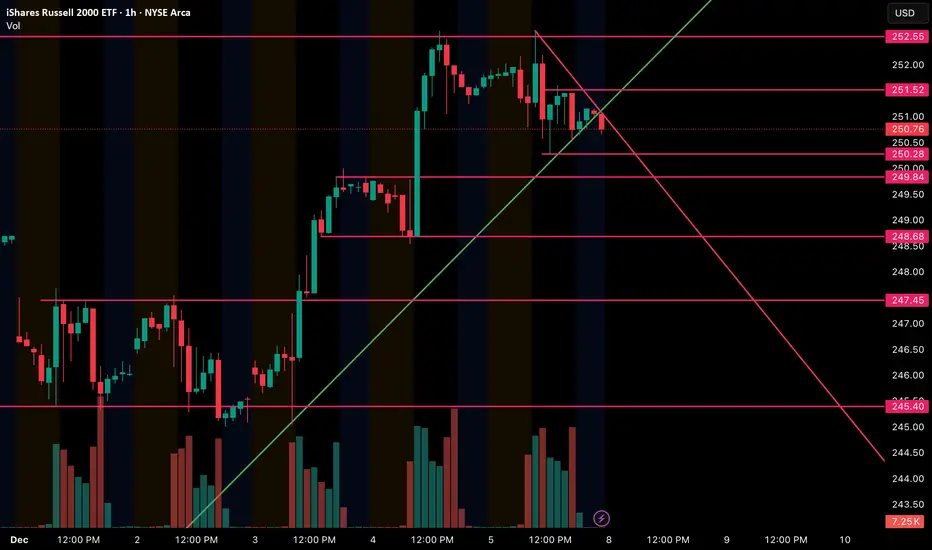
Russel Short- The price is testing a strong horizontal resistance zone around 252–253 after several attempts : TRIPLE TOP.
- Recent pushes into this resistance show high selling volume compared with relatively weak buying volume.
- Buyers are losing strength at the top.
-Since October the relative volume is

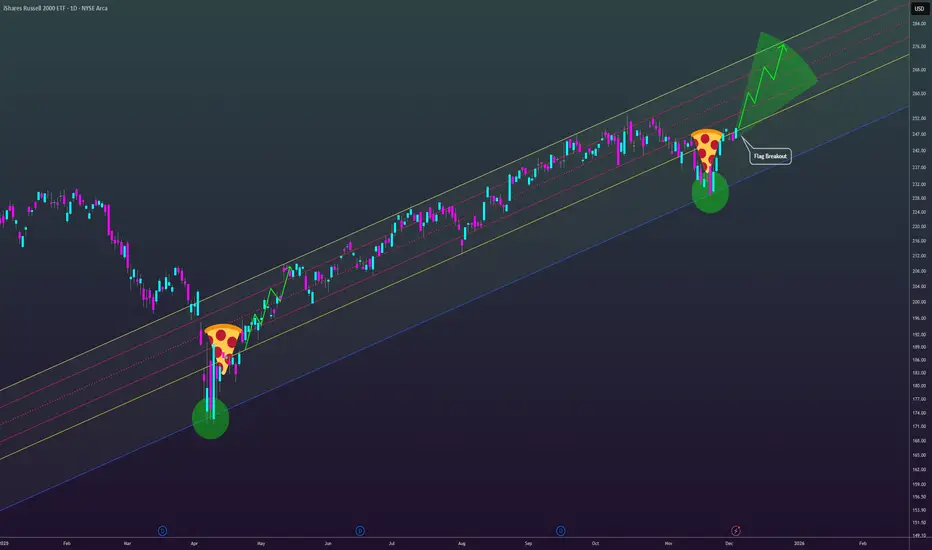
Pizza Slice RecoverySmall Caps could be the big play going into end of the year. A real strong rate cut environment is going to benefit small caps more than large caps; today's negative ADP report for small business could be the ignition.
This 2025 channel since the liberation day sell off is providing a pathway to h
IWM Rejection of all time highs to grab liquidity at lows.IWM going into tomorrow my overall bias would be bearish.
- There is a break of the upward trendline which price has previously respected 3 times.
- Looking at the EMAs they have also crossed signaling the start of downtrend.
- Starting to reject the highs on the daily forming a triple top (this
IWM Enters Correction Phase Following Impulsive AdvanceThe cycle from the April 2025 low in the Russell 2000 ETF (IWM) remains active. It is unfolding as a five‑wave impulse. Wave ((4)) of this sequence concluded at 228.18, as shown on the 45‑minute chart. From that level, the ETF advanced into wave ((5)). A decisive break above the prior wave ((3)) pea

Hello trader, for today's pre-market real-time update: IWM: 251.This was the result of trading on Russell. It opened above the target price of 254.00, finding resistance at 252.00 (a triple top). As we explained, it could bounce in the 250.00 zone. At this time, it is not advisable to short, as the price has remained sideways.

IWM Weak Move Detected: No Signal, But Downside Risk IdentifiedIWM QuantSignals Katy 1M Prediction 2025-12-05
QuantSignals Katy AI Stock Analysis
Analyzed 1 stock(s): IWM
IWM Analysis
Current Price: $251.46
Final Prediction: $251.70 (+0.10%)
30min Target: $251.87 (+0.16%)
Trend: NEUTRAL
Confidence: 51.5%
Volatility: 3.5%
No trade signal generated (insuffic

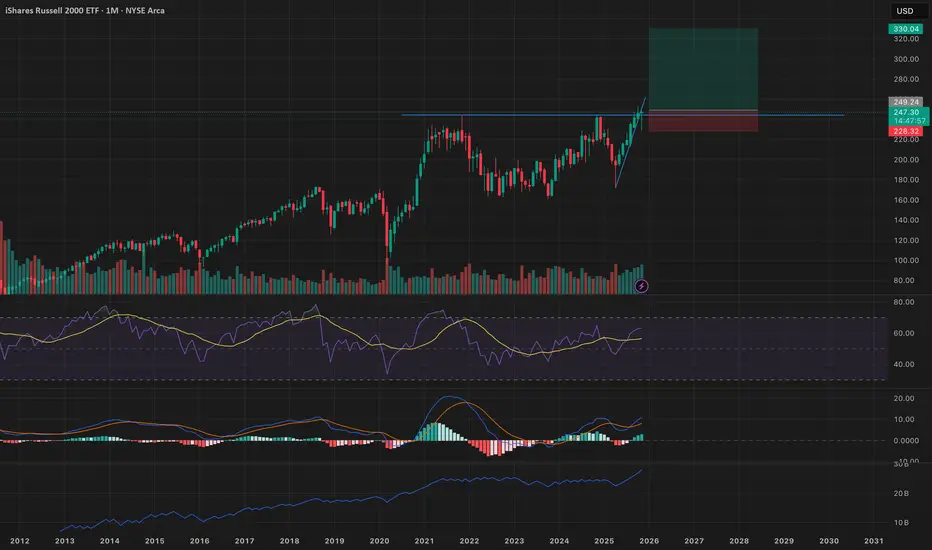
ResistanceLong shadow(wick) candles are forming around the key level $244. Bulls need a strong close next month above that key level to increase the probability of their bullish march. If price closes below key level with volume keep and eye on possible Fib levels below.

$IWM-The lagger will be the leaderZoom out here and see this giant cup and handle.
OBV has broken out, preceding price.
Decreased rates influence small businesses the most. The impact has lagged, but it is now ready to run.
The breakout target is 330
Strong monthly candle. May see a slow start to the month after the run up we had ov
See all ideas
Summarizing what the indicators are suggesting.
Oscillators
Neutral
SellBuy
Strong sellStrong buy
Strong sellSellNeutralBuyStrong buy
Oscillators
Neutral
SellBuy
Strong sellStrong buy
Strong sellSellNeutralBuyStrong buy
Summary
Neutral
SellBuy
Strong sellStrong buy
Strong sellSellNeutralBuyStrong buy
Summary
Neutral
SellBuy
Strong sellStrong buy
Strong sellSellNeutralBuyStrong buy
Summary
Neutral
SellBuy
Strong sellStrong buy
Strong sellSellNeutralBuyStrong buy
Moving Averages
Neutral
SellBuy
Strong sellStrong buy
Strong sellSellNeutralBuyStrong buy
Moving Averages
Neutral
SellBuy
Strong sellStrong buy
Strong sellSellNeutralBuyStrong buy
Displays a symbol's price movements over previous years to identify recurring trends.
Frequently Asked Questions
An exchange-traded fund (ETF) is a collection of assets (stocks, bonds, commodities, etc.) that track an underlying index and can be bought on an exchange like individual stocks.
IWM trades at 250.87 USD today, its price has risen 0.04% in the past 24 hours. Track more dynamics on IWM price chart.
IWM net asset value is 250.70 today — it's risen 2.77% over the past month. NAV represents the total value of the fund's assets less liabilities and serves as a gauge of the fund's performance.
IWM assets under management is 71.90 B USD. AUM is an important metric as it reflects the fund's size and can serve as a gauge of how successful the fund is in attracting investors, which, in its turn, can influence decision-making.
IWM price has risen by 5.23% over the last month, and its yearly performance shows a 4.62% increase. See more dynamics on IWM price chart.
NAV returns, another gauge of an ETF dynamics, have risen by 2.77% over the last month, showed a 5.76% increase in three-month performance and has increased by 5.97% in a year.
NAV returns, another gauge of an ETF dynamics, have risen by 2.77% over the last month, showed a 5.76% increase in three-month performance and has increased by 5.97% in a year.
IWM fund flows account for −11.73 B USD (1 year). Many traders use this metric to get insight into investors' sentiment and evaluate whether it's time to buy or sell the fund.
Since ETFs work like an individual stock, they can be bought and sold on exchanges (e.g. NASDAQ, NYSE, EURONEXT). As it happens with stocks, you need to select a brokerage to access trading. Explore our list of available brokers to find the one to help execute your strategies. Don't forget to do your research before getting to trading. Explore ETFs metrics in our ETF screener to find a reliable opportunity.
IWM invests in stocks. See more details in our Analysis section.
IWM expense ratio is 0.19%. It's an important metric for helping traders understand the fund's operating costs relative to assets and how expensive it would be to hold the fund.
No, IWM isn't leveraged, meaning it doesn't use borrowings or financial derivatives to magnify the performance of the underlying assets or index it follows.
In some ways, ETFs are safe investments, but in a broader sense, they're not safer than any other asset, so it's crucial to analyze a fund before investing. But if your research gives a vague answer, you can always refer to technical analysis.
Today, IWM technical analysis shows the buy rating and its 1-week rating is strong buy. Since market conditions are prone to changes, it's worth looking a bit further into the future — according to the 1-month rating IWM shows the strong buy signal. See more of IWM technicals for a more comprehensive analysis.
Today, IWM technical analysis shows the buy rating and its 1-week rating is strong buy. Since market conditions are prone to changes, it's worth looking a bit further into the future — according to the 1-month rating IWM shows the strong buy signal. See more of IWM technicals for a more comprehensive analysis.
Yes, IWM pays dividends to its holders with the dividend yield of 0.96%.
IWM trades at a premium (0.07%).
Premium/discount to NAV expresses the difference between the ETF’s price and its NAV value. A positive percentage indicates a premium, meaning the ETF trades at a higher price than the calculated NAV. Conversely, a negative percentage indicates a discount, suggesting the ETF trades at a lower price than NAV.
Premium/discount to NAV expresses the difference between the ETF’s price and its NAV value. A positive percentage indicates a premium, meaning the ETF trades at a higher price than the calculated NAV. Conversely, a negative percentage indicates a discount, suggesting the ETF trades at a lower price than NAV.
IWM shares are issued by BlackRock, Inc.
IWM follows the Russell 2000. ETFs usually track some benchmark seeking to replicate its performance and guide asset selection and objectives.
The fund started trading on May 22, 2000.
The fund's management style is passive, meaning it's aiming to replicate the performance of the underlying index by holding assets in the same proportions as the index. The goal is to match the index's returns.