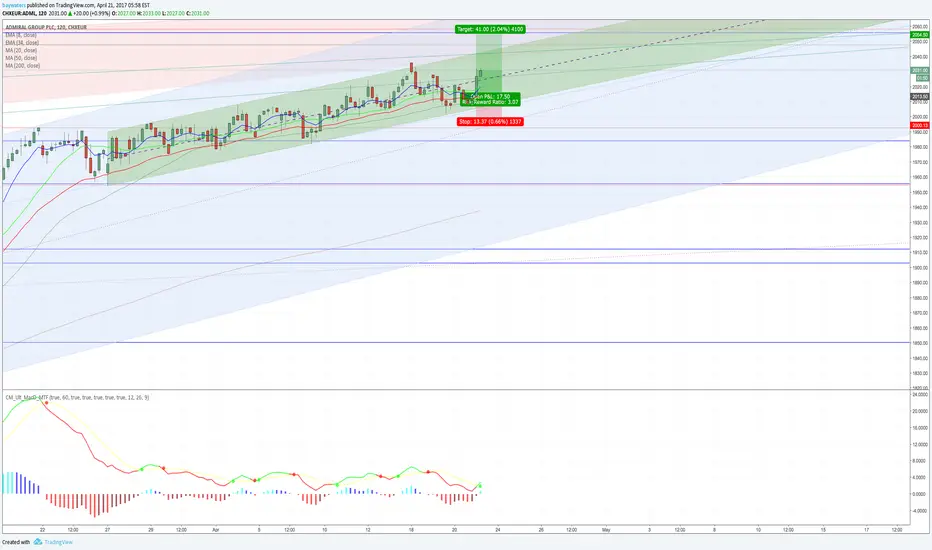
ADMIRAL GROUP PLC Long from Support / 200 MA lineLooks to me like a healthy correction, now bounced of support of the 200 ma line and also previous top and is again above the main support. Nice R/R ration of 2.22
1.41USD
430.27 MUSD
4.98 BUSD
193.03 M
About Admiral Group Plc.
Sector
Industry
CEO
Milena Mondini de Focatiis
Website
Headquarters
Cardiff
Employees (FY)
13 K
Founded
1999
ISIN
GB00B02J6398
FIGI
BBG000QRH397
Admiral Group Plc is a holding company, which engages in the business of sale and underwriting of private car insurance. It operates through the following segments: UK Insurance, International Car Insurance, Price Comparison, and Other. The UK Insurance segment consists of the underwriting of car insurance and other products that supplement the car insurance policy. The International Car Insurance segment offers underwriting of car insurance and the generation of ancillary income from underwriting car insurance outside of the UK. The Price Comparison segment relates to the price comparison websites which include Confused.com in the UK, Rastreator in Spain, LeLynx in France, and compare.com in the U.S. Admiral Loans segment deals with business loans. The Other segment is designed to be comprised of all remaining operating segments. The company was founded by David Graham Stevens and Henry allan Engelhardt in 1993 and is headquartered in Cardiff, the United Kingdom.

2 retests for Admiral before a breakout2 retests for Admiral before a triangle breakout.
Downtrend started to consolidate from May 22 onwards and now we see it break resistance of 2356.
WARNING: This is not a recommendation to trade. Do your own research and make your own trading decisions.


ADMIRAL GROUP PLC : ADML : LONG : T1 : 2041 AND T2 2056As per chart analysis, go long on this trade.. subject to risks of course!!
ADM - Update - Buy IfThis looks a good buy with a close above 1805, then 123 low - higher high - higher low - with the potential for a 3 wave corrective move. Trading within a falling wedge on the down turn has created MACD divergence to price also indicating weakening of bearish sentiment.


Admiral Group complets head and shoulders topAdmiral is looking pretty sick while the overall market hits new all time highs. The shares have failed at trend resistance and also the neckline resistance of the top pattern. The shares are making new lows on a relative basis and look set to continue lower in the near term. The shares will be part

Short - Admiral Group ADMHi all,
I only take positions on the daily/weekly chart when trading companies as they are not open 24hr and I find my win rate is higher historically
Reasons for to go short
- moving averages or bearish
- old support is now resistance
- descending channel
- RSI is bearish
- candle on the 4t

See all ideas
Trade directly on the supercharts through our supported, fully-verified and user-reviewed brokers.


Frequently Asked Questions
The current price of AMIGF is 33.77 USD — it has decreased by 0.91% in the past 24 hours.
Depending on the exchange, the stock ticker may vary. For instance, on OTC exchange Admiral Group Plc. stocks are traded under the ticker AMIGF.
Admiral Group Plc. is going to release the next earnings report on Aug 14, 2024. Keep track of upcoming events with our Earnings Calendar.
AMIGF stock is 0.92% volatile and has beta coefficient of 0.46. Check out the list of the most volatile stocks — is Admiral Group Plc. there?
AMIGF earnings for the last quarter are 0.73 USD per share, whereas the estimation was 0.81 USD resulting in a −9.34% surprise. The estimated earnings for the next quarter are 0.76 USD per share. See more details about Admiral Group Plc. earnings.
Admiral Group Plc. revenue for the last quarter amounts to 2.84 B USD despite the estimated figure of 2.54 B USD. In the next quarter revenue is expected to reach 2.96 B USD.
Yes, you can track Admiral Group Plc. financials in yearly and quarterly reports right on TradingView.
AMIGF stock has fallen by 0.91% compared to the previous week, the month change is a 0.91% fall, over the last year Admiral Group Plc. has showed a 35.79% increase.
AMIGF net income for the last quarter is 208.14 M USD, while the quarter before that showed 221.49 M USD of net income which accounts for −6.03% change. Track more Admiral Group Plc. financial stats to get the full picture.
Today Admiral Group Plc. has the market capitalization of 10.67 B, it has increased by 2.60% over the last week.
Admiral Group Plc. dividend yield was 3.84% in 2023, and payout ratio reached 92.86%. The year before the numbers were 7.35% and 165.21% correspondingly. See high-dividend stocks and find more opportunities for your portfolio.
Like other stocks, AMIGF shares are traded on stock exchanges, e.g. Nasdaq, Nyse, Euronext, and the easiest way to buy them is through an online stock broker. To do this, you need to open an account and follow a broker's procedures, then start trading. You can trade Admiral Group Plc. stock right from TradingView charts — choose your broker and connect to your account.
As of Apr 24, 2024, the company has 13.00 K employees. See our rating of the largest employees — is Admiral Group Plc. on this list?
Investing in stocks requires a comprehensive research: you should carefully study all the available data, e.g. company's financials, related news, and its technical analysis. So Admiral Group Plc. technincal analysis shows the buy rating today, and its 1 week rating is buy. Since market conditions are prone to changes, it's worth looking a bit further into the future — according to the 1 month rating Admiral Group Plc. stock shows the buy signal. See more of Admiral Group Plc. technicals for a more comprehensive analysis.
If you're still not sure, try looking for inspiration in our curated watchlists.
If you're still not sure, try looking for inspiration in our curated watchlists.
We've gathered analysts' opinions on Admiral Group Plc. future price: according to them, AMIGF price has a max estimate of 42.34 USD and a min estimate of 26.15 USD. Read a more detailed Admiral Group Plc. forecast: see what analysts think of Admiral Group Plc. and suggest that you do with its stocks.