🔍📈 "Revisiting Coin AR: Exploring Re-entry Opportunities" 🎯💹💹 Let's analyze and examine this cryptocurrency coin together to see if it could potentially re-enter our mid-term portfolio.
🔄 In the higher time frame, namely the weekly chart, we've witnessed an incredible surge from $4 to $43. This bullish movement has brought significant profits to the holders

AR SELL LIMIT 😎♻️😎♻️😎♻️Hi dear traders
The price has formed bearish pattern.
We can open short position with suitable R/R.
Let's see what happens
This is not financial advice ( DYOR )
Good luck

Arweave (AR)Arweave is a decentralized storage network that seeks to offer a platform for the indefinite storage of data. Describing itself as a collectively owned hard drive that never forgets
the Arweave network uses a native cryptocurrency AR, to pay miners to indefinitely store the network's information
Met

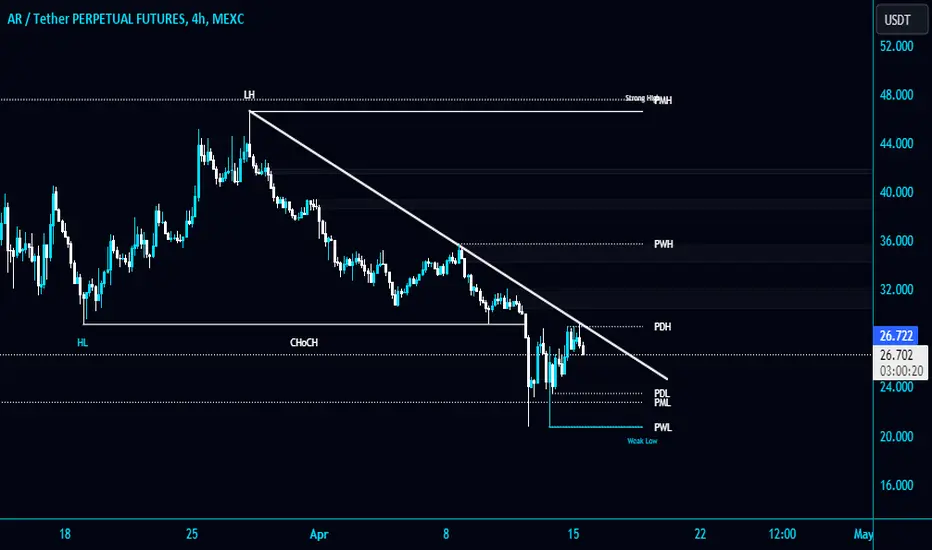
#AR/USDT is heading towards a Diagonal Trendline in 4-Hour TF!#AR/USDT is heading towards a Diagonal Trendline in 4-Hour TF!
NYSE:AR needs to clear the Trendline along with the PDH $25.4 resistance level. #ARUSDT's strong support level is $22.7. The next local resistance level is PWH $35.725.

ARUSDT 12H#AR has broken the falling wedge pattern and EMA100 on the 12H timeframe. RSI and MACD are showing bullish momentum. Targets are:
$32.613
$38.310
$47.518
Supports are:
$28.009
$23.405

ARUSDT UPDATE #ARUSDT
UPDATE
Trend Line breakout has confirmed in 4h time frame
Expecting 60%+profit 📈
#ARUSDT #AR #ARBTC #BTC #Crypto NYSE:AR
CRYPTOCAP:DEXE $QI LSE:SYN INDEX:GALA TSXV:POND $SPELL GETTEX:PDA $BADGER $CYBER NYSE:FET SEED_DONKEYDAN_MARKET_CAP:AGIX SEED_DONKEYDAN_MARKET_CA

ARUSDT IDEAHey traders hope you are enjoying our analysis. Now we are here again with a new trading opportunity. We will discuss today about AR
AR Falling wedge Breakout has Already Done in 4H Timeframe✍️
Expecting 50% Bullish Wave in Coming day's 🚀 📈

#AR/USDT is rejecting from the Diagonal Trendline in 4-Hour TF!#AR/USDT is rejecting from the Diagonal Trendline in 4-Hour TF!
The Trendline reacting as a resistance. NYSE:AR needs to break the Trendline to gain the bullish momentum. The local resistance level is PWH $35.88. The strong support level is PML $22.7 for #ARUSDT.
ARUSDT IDEAHello Traders Hope You Are Enjoying Our Analysis. Today We Will Discuss About AR
(Update)
The Trendline Breakout Has Done In 3D Timeframe✅
Coming Back Again & Expecting Massive Bullish Wave Towards 300%✍️

Ar Arweave #AR $Ar Areweave has found support so far at the $21-$23 range which coincides with support that has worked earlier this month as well as in prior years such as February 21st, 2022, and August 23rd, 2021.
However, the wicks through it look somewhat worse this time around and if we get any more pullbacks f

See all ideas