James Hardie - What happens when the Fed cuts ratesJames Hardie (NYSE: JHX) is one of the cleanest cyclical plays on a U.S. housing rebound. The majority of its earnings come from North America, making it highly sensitive to changes in U.S. construction and renovation activity.
U.S. housing is cyclical. It contracts with high interest rates and reb
Compare with James Hardie Industries PLC Chess Units of Foreign Securities
0.36 AUD
157.41 M AUD
7.32 B AUD
563.05 M
Next report date
—
Report period
—
EPS estimate
—
Revenue estimate
—
Company info
Sector
Industry
CEO
Aaron M. Erter
Website
Headquarters
Dublin
Founded
2001
IPO date
Oct 15, 2001
ISIN
AU000000JHX1
FIGI
BBG000D01958
Identifiers
ISIN AU000000JHX1
James Hardie Industries Plc engages in the provision of fiber cement and fiber gypsum building solutions. It operates through the following segments: Siding and Trim; Deck, Rail, and Accessories; Australia and New Zealand; and Europe. The Siding and Trim segment refers to the legacy north America fiber cement segment and the acquired exteriors business from AZEK. The Deck, Rail, and Accessories segment focuses on AZEK's deck, rail, and accessories business. The Australia and New Zealand segment includes fiber cement products manufactured in Australia and sold in Australia and New Zealand. The Europe segment relates to fiber gypsum products and cement bonded boards manufactured in Europe, and fiber cement products manufactured in the United States that are sold in Europe. The company was founded in 1888 and is headquartered in Dublin, Ireland.
Update to our Jamies Hardie recommendationJames Hardie NYSE:JHX is up around 24% since our long recommendation in August . Back then, our view was the market will start looking for exposures to the housing market as the Fed cuts rates and growth starts to slow down.
It seems that the market is now supporting that view. While rate cuts
Potential outside week and bullish potential for JHXEntry conditions:
(i) higher share price for ASX:JHX above the level of the potential outside week noted on 11th December (i.e.: above the level of $30.65).
Stop loss for the trade would be:
(i) below the low of the outside week on 10th December (i.e.: below $28.21), should the trade activate.
Break out?The chart shows James Hardie Industries (ASX: JHX) breaking out of a symmetrical triangle pattern after a period of consolidation.
Breakout confirmation: Price has moved above the upper trendline with increasing momentum, signalling potential bullish continuation.
Fibonacci targets: Initial res
Potential key reversal bottom detected for JHXAwait signals for entry such as DMI/ADX and/or RSI swing to the bullish direction.
Stop loss for the trade involving ASX:JHX (and indication that this trade is an absolute 'no-go') is any trade below the low of the signal day of 21st March (i.e.: any trade below $45.52).
JHX @ 16 NOV 2021Text me if you have any questions/comments for me.
-----
JHX
- Previous video analysis was done on 13 Nov (red arrow) - Suggested waiting for a retracement and a successful rebound
- Since then, the stock briefly created a new high and currently looks like it’s retracing
- Another healthy test of
JHX @ 27 OCT 2021Text me if you have any questions/comments for me.
-----
JHX
- Previous analysis was done on 16 Sep (red arrow) - Suggested entry around 54.90 levels if believe the stock can create new all-time highs
- Since then, the stock did not rebound to $54.90 but instead broke through the short- and mid-te
JHX @ 16 SEP 2021Text me if you have any questions/comments for me.
-----
JHX
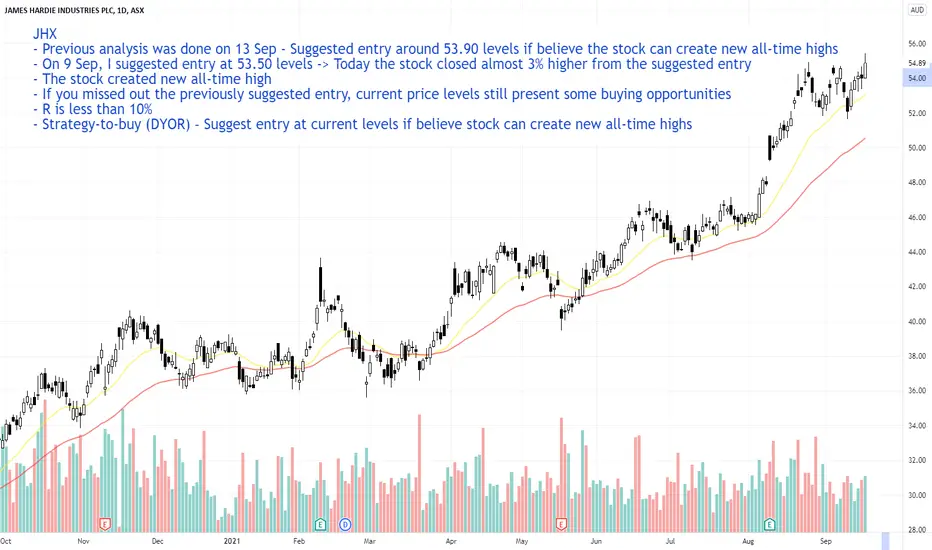
- Previous analysis was done on 13 Sep - Suggested entry around 53.90 levels if believe the stock can create new all-time highs
- On 9 Sep, I suggested entry at 53.50 levels -> Today the stock closed almost 3% higher from the suggested e
JHX @ 13 SEP 2021JHX
- Previous analysis was done on 9 Sep - Suggested entry around 53.50 levels
- Recent price retracement has seen the stock test the short-term support and successfully rebounded
- If you missed out the previously suggested entry, current price levels still present some buying opportunities
- R i
JHX @ 1 SEP 2021JHX
- First time doing a written analysis on JHX
- Nice uptrend over the last few months
- Stock is trading near all-time high regions
- A pullback to the short-term support would be better for the overall health of the trend
- A successful rebound look to be around 54 levels
- R is less than 10%
-
See all ideas
Summarizing what the indicators are suggesting.
Neutral
SellBuy
Strong sellStrong buy
Strong sellSellNeutralBuyStrong buy
Neutral
SellBuy
Strong sellStrong buy
Strong sellSellNeutralBuyStrong buy
Neutral
SellBuy
Strong sellStrong buy
Strong sellSellNeutralBuyStrong buy
An aggregate view of professional's ratings.
Neutral
SellBuy
Strong sellStrong buy
Strong sellSellNeutralBuyStrong buy
Neutral
SellBuy
Strong sellStrong buy
Strong sellSellNeutralBuyStrong buy
Neutral
SellBuy
Strong sellStrong buy
Strong sellSellNeutralBuyStrong buy
Displays a symbol's price movements over previous years to identify recurring trends.
Maturity dateJul 31, 2032
Coupon6.13% (Fixed)
Maturity dateJan 31, 2031
Coupon5.88% (Fixed)
See all JHX bonds