$IREN: Wave 5 up to comeNASDAQ:IREN : I count IREN to have completed 3 waves up and is now in Wave 4 correction. Wave 4 has been an expanded flat. CD = 1.382 AB is achieved. Although CD = 1.618 AB is the most common, however, the yellow trendline and 100 DMA are providing support so it's likely that CD = 1.382 AB is it.
I have a position.
Trade ideas

IREN inverted h&sdecline, reversed, small accumulation island at the bottom which forms the head of the inverted head and shoulders pattern. time between left and right shoulder is approx equal too.

IREN Risk to reward for long side looks pretty goodIREN trend is clearly been down. However, seems like there is accumulation here and selling has slowed down. Based on fibs can enter here can enter at 44 to target 54. Stop can be at 40. Risking 4 to make 10.

$IREN: A Period of Consolidation with Defined Risk ParametersNot much change on $IREN. The price action for NASDAQ:IREN currently reflects a period of lateral consolidation and equilibrium, with neither bulls nor bears establishing clear dominance in the near term. This pause follows previous volatility and represents a critical juncture where the asset is building energy for its next significant directional move. While there have been no major fundamental catalysts to alter the overarching narrative recently, the technical framework provides clear levels to monitor for the next phase.
Key Technical Levels and Scenarios
The market structure is defined by two primary support zones, which will act as the battlefield for control.
Immediate Bull Line (Support 1): This is the first and most crucial level of defense for the bullish thesis. A sustained hold above this zone suggests that underlying demand remains intact and that the consolidation is merely a pause within a larger positive trend. It represents the line where buyers have historically stepped in.
Secondary Support (Support 2): This lower level represents a more significant technical and psychological area. A breakdown below Support 1 would shift market sentiment negatively, increasing the likelihood of a test at Support 2. A successful hold here would indicate a deeper, but still valid, correction. However, a failure at this second tier would signal a more profound deterioration of the bullish structure and could open the door to further declines.
Strategic Outlook and Profit-Taking Horizon
Despite the current quietude, the broader strategic outlook maintains a bullish bias contingent on holding key supports. The consolidation is viewed not as a reversal of trend, but as a necessary period of digestion.
The primary upside objective remains a take-profit target in the vicinity of $60. This level is derived from a combination of technical measurements, including previous chart structure, Fibonacci extensions, and the implied momentum of the prior trend. A successful rally from either Support 1 or a robust rebound from Support 2 would project price action toward this target zone.
Conclusion
In essence, NASDAQ:IREN is in a holding pattern. "Not much change" signifies a buildup of potential energy. Traders and investors should now watch for a decisive break from this equilibrium, with a close watch maintained on Support 1 as the immediate bellwether. A hold there keeps the path to the $60 target clear, while a break lower would pivot focus to the durability of Support 2 and necessitate a recalibration of the near-term timeline for upward movement.

IREN | WeeklyNASDAQ:IREN — Technical Update
Following a 15% pullback today, IREN is holding near the equivalence-line apex — a major support zone outlined on the chart since November 15.
Trend Analysis
As shown on the chart, price action has continued to tighten within the space between the resistance and support equivalence-line apexes since November 17. The reaction at this key zone should provide clarity on whether the broader uptrend is ready to resume.
🔖 This outlook is based on insights from my Quantum Models framework. Within this methodology, Q-targets are defined as high-probability possibilities generated by the confluence of equivalence lines. These equivalence lines also act as structural anchors, shaping the internal geometry of the model and guiding the evolution of alternative paths as price action progresses.
#QuantumModel #TrendAnalysis #WaveAnalysis #MarketStructure #CryptoAnalysis #CryptoMarket #TechnicalAnalysis #ElliottWave #Investing #IREN #IRENStock #TechStocks #DataCenter #AIDatacenter #BitcoinMining #HPC #CryptoMining #BTC #Bitcoin #BTCUSD
NASDAQ:IREN #RenewableEnergy

IREN - Bottom is in (Maybe?)IREN looks to have recently finished an expanded flat correctional, oh no recent news of bonds and potential share dilution for selling shares for financing? Short term downside sell the news event, use it for the perfect entry that it's giving us.
Keeping stoploss at $39.55, betting on a higher low forming and full recapture, this is a bit risky given the significant VWAP and VPR resistance above us, so leaning more on my wave-count here than anything else.
Wave-Count Confidence: Average

$IRENIn a bold strategic move to solidify and fund its pivot from cryptocurrency mining to artificial intelligence infrastructure, Iren executed a massive $3.6 billion capital raise on December 3rd. This complex financing package, structured through both equity and long-term convertible debt, is designed to provide the low-cost capital necessary for its aggressive AI expansion while meticulously managing the dilution for existing shareholders. The market responded positively to the news, with Iren's stock surging 6.9% on the day of the announcement, signaling approval for the company's refined financial strategy.
The capital raise is bifurcated into two primary components, each serving a distinct purpose. The first is a $2 billion private offering of convertible notes, divided into two series: $1 billion with a 0.25% coupon due in 2032, and another $1 billion with a 1.00% coupon due in 2033. These notes provide Iren with long-dated, exceptionally low-cost capital. Crucially, the conversion price for both series is set at approximately $51.40 per ordinary share, representing a significant 25% premium to Iren's closing price of $43.68 on December 3rd. This high conversion barrier delays potential equity dilution. Furthermore, Iren has entered into "capped call" transactions, which are derivative instruments that effectively raise the share price at which dilution would meaningfully begin to $82.24 per share, offering substantial additional protection to current stockholders.
The second, parallel component is a $1.632 billion direct equity offering, where 39.7 million shares were sold at $41.12 each. A key strategic rationale for this equity raise is to address and eliminate older, more dilutive obligations. The proceeds are earmarked to repurchase and extinguish the company's existing convertible notes maturing in 2029 and 2030, which carry far lower conversion prices of $13.64 and $16.81, respectively. By clearing these "overhang" notes from its balance sheet using freshly raised equity, Iren is proactively streamlining its capital structure and removing a source of future dilution that was priced at a steep discount to the current market.
If noteholders exercise their option to purchase an additional $150 million in each series of the new convertible notes, the total gross proceeds could reach approximately $2.27 billion. Iren intends to use these funds, after covering the $174.8 million cost of the capped calls, to repurchase other portions of its existing debt and, most importantly, to invest in the rapid expansion of its AI data center infrastructure.
This colossal fundraising effort underscores Iren's determined transformation. Formerly an Australian Bitcoin mining leader, the company has strategically redirected its substantial energy assets and operational expertise toward the high-growth AI infrastructure sector over the past year—a pivot reflected in a 200% increase in its stock price during that period. The company is leveraging its core strength: access to immense power resources. It currently controls 2.9 gigawatts of grid-connected power across North America and operates 810 MW of active data centers. A landmark validation of its new direction is a five-year, $9.7 billion GPU cloud services contract with Microsoft, under which Iren will supply AI computing capacity powered by NVIDIA's advanced GB300 chips from its 750-megawatt campus in Texas.
Despite this strong strategic positioning, Iren's stock, like many in the high-flying AI sector, has not been immune to volatility. It recently faced a pullback, declining 36% over the past month and remaining down approximately 11% for the week, partly driven by broader market fears surrounding the sustainability of AI investment valuations.
From a technical analysis perspective, this recent sell-off brings key support levels into focus. Should the price action breach its immediate or main support level, analysts would then closely monitor the next major floor, identified as Support 2. A successful hold at this secondary support zone could provide a foundation for the stock to consolidate and potentially rebound, as the market continues to digest the implications of Iren's strengthened balance sheet and its multi-billion-dollar bet on the future of AI compute. The successful closing of these offerings, expected on December 8th subject to customary conditions, will mark a critical milestone in Iren's journey to establish itself as a next-generation AI infrastructure leader.

$IREN, double top, short round 2?This yellow box is not likely to hold since we are this late in trend.
First target $30 zone.

IREN to 200 $The hidden bullish divergence from A to C might be about to play out, and then put in place a AB=CD pattern that takes IREN to 200$

$IREN.previous microstructure been holding up, if we break below its free fall till $25-30, if we break above we got $60 to tackle.
If you play this long term, good looks. Liking longs here, but $30 still possible so stay 20% cash maybe.

IREN Well overextended.... deeper pullback before upsideNASDAQ:IREN Price has overextended in a macro wave 3, the strongest and most powerful move described as a “wonder to behold” by Elliotticians. Novice investors are likely to get over-confident in these conditions, enter without risk management and keep chasing the price upwards only to be underwater when it turns around.
Profit taking appears to be taking place. I have closed my positions and am waiting for re-entry. The weekly pivots have been run.
Initial downside targets for wave (4) have been hit $39, the next is 0.382, $26.43. Expect shorts to pile in, adding to any downside momentum.
In the long term, we have higher to go in wave (5).
🎯 Terminal target for the business cycle could see prices as high as $124 based on daily pivots
📈 Weekly RSI hit overbought with no divergence
👉 Analysis is invalidated if we continue into price discovery
Safe trading

IREN, still lower to go...NASDAQ:IREN wave 4 appears to want one more pusher lower towards the daily 200EMA and 0.382 Fibonacci retracement.
Price has broken its uptrend on bearish divergence and is yet to show strong support, suggesting we continue lower next week.
📈 Daily RSI has printed a bullish divergence, but not from oversold
👉 Continued downside has a target of the daily 200EMA, $26.75
Safe trading

IREN charges up after the pullbackThe price of IREN pulled back to the lower boundary of the expanding channel and touched the 100 period moving average on the 8 hour chart. The 48 zone acted as support earlier and buyers are showing interest there again. A base is forming. A breakout above 62 can activate movement toward 76 and later 100 where the next expansion target sits.
IREN operates large scale data centers and high performance computing infrastructure including bitcoin mining and enterprise hosting. The key advantage of the company is access to low cost renewable energy which keeps hash rate costs low and allows stable scaling.
The fundamental picture on November 26 remains stable. The company continues to expand its data center capacity. Leverage stays low. The bitcoin network maintains strong activity which supports revenue. Hash rate competition increases but operators with cheap energy access like IREN gradually strengthen their market position.
As long as the price stays above the 48 zone and above the 100 period moving average the recovery structure remains valid. A confirmed move above 62 opens the path to 76 and then 100 . A move below 48 will return price to deeper consolidation.
Even miners need a pause to recharge but after such pullbacks energy normally returns very quickly.

Ascending TDSeq startedIREN did a 12 in TD Sequential, reaching the lower side of the pitchfork displayed.
Now the TP can be around 84-100$ looking at the fib extension levels of the latest swing.

$IREN Weekend analysis - Nov 30th, 2025NASDAQ:IREN got rejected at the anchored VWAP from the 5/11 pivot (around 51.46–53.63) after bouncing off the previous S/R zone.
For the upside move to continue, the price needs to get back above that AVWAP area and the 50DMA (54.85) - both levels line up nicely. If it can reclaim and close above that zone, the next leg up could target 65.8 - 68.3.
MACD is curling up and looks close to a bullish crossover, which supports the idea of more upside. If price holds above the AVWAP on a reclaim, that’s where I might look for an entry.

IREN - Expanded Flat Potential BottomIREN has a lot of promise in the future, currently revenue and EPS have grown significantly over the last year. With the focus still being on fueling energy to data AI centers, I feel this stock has another impulse wave left in it, alternate count also suggests it.
Micro-Count shows the detailed expanded flat, price ended right at the 1.272 of A-B.
Wave-Count Confidence: Average

IREN eyes on $77.63: Golden Genesis at ATH may give DIP buyIREN got a big surge on deal news with Microsoft
The surge has hit a Golden Genesis fib at $77.63
Look for a Break-n-Retest or Dip-to-Fib like $70.73

IREN / WeeklyNASDAQ:IREN — Quantum Model Projection
IREN surged 14.7% today — a standout rally despite BTC showing weakness, highlighting strong underlying momentum.
As detailed in the previous update, the correction in Intermediate Wave (4) reached the 0.382 Fib-Retracement level last week, unfolding as an Expanded Flat and ending precisely at the apex of the convergent support equivalence lines.
Looking ahead, an extension into Intermediate Wave (5) within Primary Wave ⓷ projects toward $431🎯 , aligning with the 1.618 Fibonacci extension of the Leading Diagonal formed in Primary Wave ⓵.
As noted earlier, the Leading Diagonal in Primary Wave ⓵ — originating in December 2022 — represents a potentially bullish structure, signalling an early-stage transition into a bullish accumulation phase. According to my framework, such motive patterns often precede strong impulsive advances, reinforcing the broader bullish narrative as the Cycle-degree Uptrend continues to unfold.
#QuantumModel #TrendAnalysis #WaveAnalysis #MarketStructure #CryptoAnalysis #CryptoMarket #TechnicalAnalysis #ElliottWave #Investing #IREN #IRENStock #TechStocks #DataCenter #AIDatacenter #BitcoinMining #HPC #CryptoMining #BTC #Bitcoin #BTCUSD CRYPTOCAP:BTC NASDAQ:IREN #RenewableEnergy

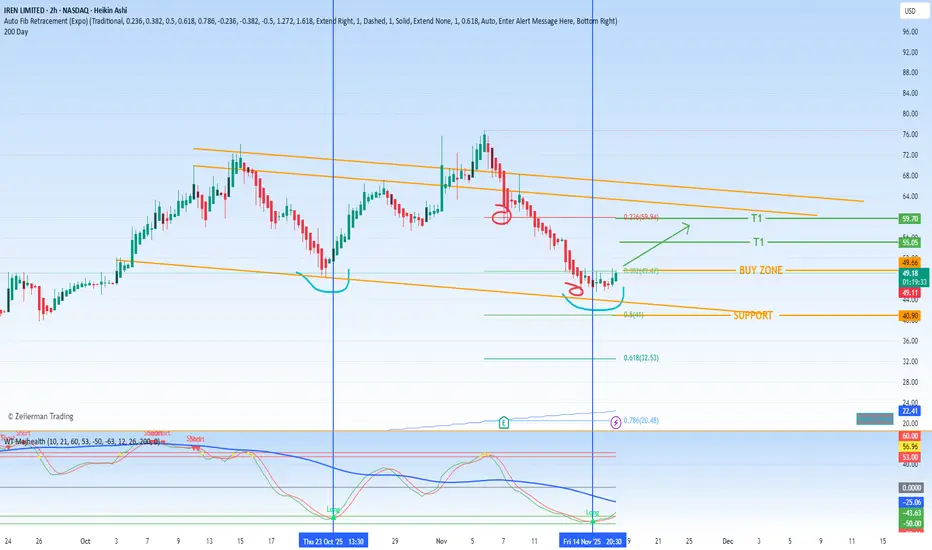
Technical Analysis On $IREN: A Potential Reversal in the MakingThe technical structure for this asset is exhibiting compelling signs that a significant low may be forming, suggesting the prolonged downtrend could be exhausting and a reversal phase may be underway. The convergence of key Fibonacci levels and emerging bullish signals creates a narrative worthy of close attention.
1. The Macro View: A Likely Bottom Formation
The assessment that the asset has "most likely bottomed" is based on key technical behaviors. This typically involves a period of price consolidation at lower levels, a slowing of downward momentum (as indicated by potential bullish divergences on oscillators like the RSI or MACD), and a clear rejection of further lows. This price action suggests that selling pressure is drying up and a new equilibrium is being established, providing a foundation for a potential new upward cycle.
2. The Fibonacci Framework: A Roadmap for the Reversal
Fibonacci retracement levels, applied to the most recent significant downtrend, provide a mathematical roadmap for identifying potential support, entry zones, and profit targets.
Primary Support (The 0.5 Fibonacci Level - $41): This level at $41 has acted as a critical foundation. The successful defense of this 0.50 retracement level is a strong technical sign. It represents a key psychological midpoint where buyers have historically stepped in with force, preventing further decline and solidifying this zone as the primary support floor for the new bullish thesis. A break below this level would seriously challenge the bottoming narrative.
Buy Zone (The 0.382 Fibonacci Level - $49.47): The $49.47 level is identified as a strategic accumulation zone. In a recovering market, prices often pull back to retest former resistance levels, which then turn into new support. A successful retest of the 0.382 level at $49.47, where the price touches this area and bounces, would offer a high-confidence entry point with a well-defined risk level just below the primary $41 support.
3. Profit-Taking Strategy and Emerging Signals
Take-Profit Targets: The initial recovery move has two clear technical objectives.
Initial Target: $55. This represents the first significant resistance zone where some profit-taking can be expected.
Extended Target: $59. A break above $55 opens the path to this more substantial target, which likely aligns with a previous swing high or a key Fibonacci extension level.
Potential Buy Signal (Blue Vertical Lines): Your observation of the "blue vertical lines" indicating a potential buy signal is crucial. This typically refers to a specific trigger from a momentum oscillator or a proprietary indicator. This signal adds a layer of confirmation, suggesting that not only is the price at a supportive level, but the underlying momentum is also shifting from bearish to bullish. This alignment between price (Fibonacci level) and momentum (buy signal) significantly strengthens the case for a sustainable upward move.
Synthesis and Strategic Outlook
The technical picture suggests the asset is in the early stages of a potential trend reversal.
The Bullish Narrative: The bottom appears to be in at the $41 (0.50 Fib) support. The strategy is to look for entry opportunities, ideally on a pullback towards the $49.47 (0.382 Fib) buy zone, especially if it coincides with a confirmed buy signal from your indicator (the blue vertical lines). The subsequent targets are $55 and $59.
Risk Management: The entire bullish thesis depends on the asset holding above the $41 support. A decisive break below this level would invalidate the bottoming premise and call for a re-evaluation.
In summary, patience is key. The setup is promising, but waiting for the price to interact with the defined buy zone and for confirming signals to align will provide a much higher-probability entry for the anticipated move toward the $55 and $59 targets.
IREN 1D - Bullish Continuation PatternSaw a double-top formation on the IREN 1D, zoomed out, saw something similar back in Q2 2024.
Drew a Bar Pattern Continuation for fun to post to twitter about "Chart Squigglers".
Bullish IREN, in all seriousness.

IREN on $48 Support Target $98IREN looks to be holding support still even with all the flood of fear through the market. I've never seen so much talk of a bubble when there's zero signs of a bubble. This would lead me to suspect IREN will hold the green trend line and follow the course up from here. But it's important to keep in mind that red trend is it's long term trend.

$IREN likely just entered a major correction phaseDespite the AI/datacenter narrative, ~95% of IREN’s revenue still comes from Bitcoin mining. With #Bitcoin now (in my view) in bear market, IREN becomes far less attractive.
From a technical standpoint, a climax after a spike phase typically leads to a major correction. Historically, when this pattern shows up, the odds are ~75% that a deeper retracement follows.

IREN / WeeklyNASDAQ:IREN — Quantum Model Projection
IREN has surged by 1,400%📈 since early April, recording its all-time highs precisely at the apex of the resistance equivalence lines — a key technical convergence zone within the market structure.
As highlighted in the previous update, the correction in Intermediate Wave (4) reached the projected Fib-Retracement target of $47.77🎯, unfolding as an Expanded Flat that may have completed at the apex of the convergent equivalence lines at $44.55.
As outlined in the previous analysis, an extension into Intermediate Wave (5) within Primary Wave ⓷ may project toward $431🎯 , corresponding to the 1.618 Fibonacci extension of the Leading Diagonal formed in Primary Wave ⓵.
As noted earlier, the development of the Leading Diagonal in Primary Wave ⓵ — a potentially bullish structure originating in December 2022 — indicated an early-stage transition into a bullish accumulation phase. Based on my frameworks, such motive patterns often precede strong impulsive advances, reinforcing the broader bullish narrative as the Uptrend unfolds at the Cycle degree.
#QuantumModel #TrendAnalysis #WaveAnalysis #MarketStructure #CryptoAnalysis #CryptoMarket #TechnicalAnalysis #ElliottWave #Investing #IREN #IRENStock #TechStocks #DataCenter #AIDatacenter #BitcoinMining #HPC #CryptoMining #BTC #Bitcoin #BTCUSD #RenewableEnergy
