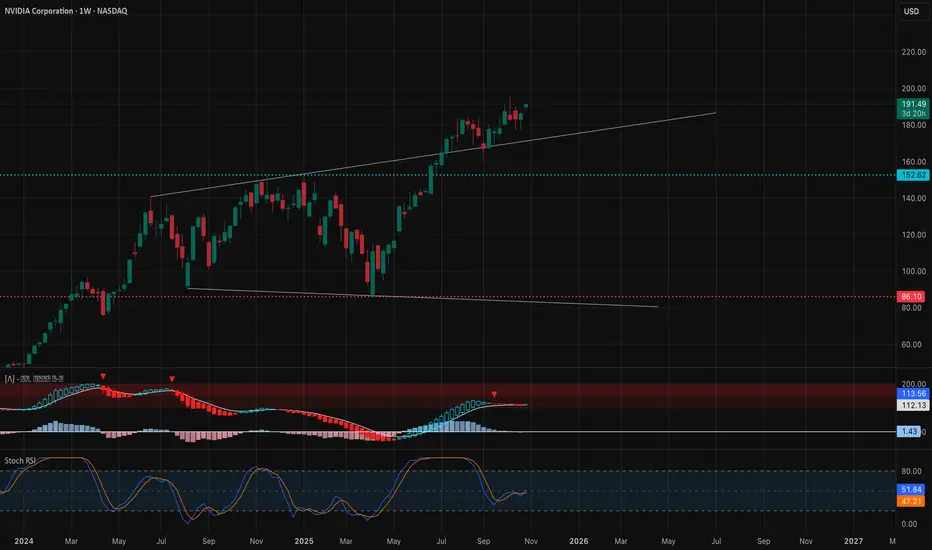
NVIDIA BLOW OFF TOPNo question that this is a blow off top. Where does it end? Premarket open above the BB channel on Day and Week view.
Trade ideas

Will NVIDIA Retest Back at 1k Like in 2024 ?NVIDIA has been forming a clean long-term bullish structure:
After its 10-for-1 stock split in June 2024, the post-split equivalent of the previous all-time high (~$1,150+) becomes the ~$1,000 zone.
Price is currently establishing higher-lows around the $180-$200 range, which suggests support is stabilizing and a breakout could follow.
The resistance cluster appears in the ~$230-$300 range next. Once that zone is decisively cleared, momentum toward ~$1,000 becomes far more plausible.
Analysts have publicly discussed the possibility of NVIDIA reaching $1,000 or more, which adds a
structural framework for the move. InvestorPlace
Institutional demand for AI-infrastructure chips gives underlying support to the bullish case — the technical pattern is supported by real business strength.
Why a Retest of ~$1,000 Makes Sense to me?
The ~$1,000+ level represents the company’s prior pre-split peak, a major psychological barrier and structural target.
With the lower base (support zone) forming now and the demand side robust, the next leg higher is likely to unfold once resistance around ~$300 is cleared.
A move from ~$200 current to ~$1,000 is steep (~5×), but given the multi-year horizon and NVIDIA’s growth environment in AI, such a move aligns with long-term structural breakout patterns.
The consolidation phase now gives the market time to absorb recent gains, allowing for a cleaner push higher rather than a sharp parabolic rise (which often leads to rapid pull-backs).
Key Levels to Watch Support zone: ~$180-$200 — if this holds, the setup remains valid.
Critical resistance: ~$230-$300 — a confirmed breakout above this zone should trigger acceleration. Structural target: ~$1,000 — once the midpoint breakout structure is in motion, this level becomes a logical target.
Alternate scenario caution: If price drops below ~$180 and fails to regain ~$200 quickly, the setup would require reevaluation.
My Belief
I believe NVIDIA will retest the ~$1,000 level (or higher) over the next 1-2 years based on the clean structure, support formation, and macro-tailwinds in AI infrastructure. If the ~$230-$300 resistance is cleared convincingly, we’re entering the next leg of a multi-year bull run.
Links
NVIDIA 2024 1K

Nvidia (NVDA) Shares Surpass $200 for the First TimeNvidia (NVDA) Shares Surpass $200 for the First Time
Yesterday, Nvidia’s (NVDA) share price climbed above the psychological threshold of $200 for the first time, pushing the company’s market capitalisation close to $5 trillion.
Why Are NVDA Shares Rising Today?
Several bullish factors are driving Nvidia’s share price higher:
→ Massive order backlog: The company reported pre-orders for its AI processors totalling an astonishing $500 billion.
→ Strategic partnership with the US government: CEO Jensen Huang announced plans to build seven AI supercomputers for the US Department of Energy.
→ Expansion into telecoms: Nvidia has invested $1 billion in Nokia, acquiring a 2.9% stake in the Finnish company to jointly develop AI-RAN and 6G technologies.
Technical Analysis of Nvidia (NVDA)
Back on 23 September, our analysis of the NVDA chart identified:
→ an upward channel outlining the stock’s price movements this autumn;
→ a breakout from a Bullish Flag pattern (shown in red);
→ a projection that strong fundamentals, the rapid advance of AI technology, and expectations of a Fed rate cut could enable bulls to overcome the $183 resistance level and target the psychological $200 mark.
That projection has materialised since:
→ the Bullish Flag breakout level has acted as support (marked with a bold blue line);
→ NVDA price swings have provided anchor points to refine the current channel.
What’s Next for Nvidia Shares?
Note the bullish gaps (highlighted by arrows) that indicate a demand imbalance. The rapidly strengthening upward momentum could drive NVDA’s share price towards the upper boundary of the channel, particularly as several major events approach today:
→ the Federal Reserve’s interest rate decision and subsequent press conference;
→ quarterly earnings releases from Microsoft (MSFT), Alphabet (GOOGL), and Meta Platforms (META), all of which are expected to reaffirm their commitment to AI development.
This article represents the opinion of the Companies operating under the FXOpen brand only. It is not to be construed as an offer, solicitation, or recommendation with respect to products and services provided by the Companies operating under the FXOpen brand, nor is it to be considered financial advice.

The Power Play Between Derivatives and HedgingIntroduction
In the complex and volatile world of financial markets, risk is an ever-present companion. Investors, corporations, and governments alike constantly seek ways to manage and mitigate these uncertainties. Two powerful instruments that dominate the modern financial landscape are derivatives and hedging. Both are closely interconnected—derivatives are the tools, while hedging is often the strategy. Together, they form a dynamic power play that influences global markets, stabilizes corporate earnings, and occasionally, when misused, leads to financial turmoil. Understanding the balance between these forces is essential for grasping how financial markets truly operate.
Understanding Derivatives: The Financial Instruments of Leverage
Derivatives are financial contracts whose value is derived from an underlying asset, index, rate, or event. These underlying assets can range from stocks, bonds, commodities, and interest rates to currencies and even weather conditions. The essence of a derivative lies in its dependency—its price moves in response to the value of something else.
Types of Derivatives
Futures Contracts
Futures are standardized agreements traded on exchanges to buy or sell an asset at a predetermined price and date in the future. They are widely used in commodities, indices, and currencies. For example, an airline company might use crude oil futures to lock in future fuel prices.
Options Contracts
Options give the holder the right, but not the obligation, to buy (call) or sell (put) an asset at a specific price within a specified period. Options are extremely popular among traders and institutions because they offer flexibility in hedging and speculation.
Swaps
Swaps involve exchanging one stream of cash flows for another. Common types include interest rate swaps and currency swaps. For instance, a company with variable-rate debt may enter into a swap to fix its interest payments and stabilize costs.
Forwards
Forwards are customized over-the-counter (OTC) agreements similar to futures but not traded on exchanges. They are tailored for specific needs, making them highly flexible yet riskier due to counterparty exposure.
Purpose of Derivatives
Derivatives serve multiple purposes:
Risk Management: They allow investors and corporations to hedge against adverse price movements.
Speculation: Traders use derivatives to profit from market volatility or price predictions.
Arbitrage: Derivatives help exploit price differences in markets to earn risk-free profits.
Leverage: A small amount of capital can control large positions, magnifying both gains and losses.
In essence, derivatives amplify financial capabilities, offering both protection and peril depending on how they are used.
The Art of Hedging: Controlling the Uncontrollable
Hedging is a strategy designed to reduce or eliminate the risk of adverse price movements in assets. It’s akin to buying insurance against potential financial loss. A hedge doesn’t necessarily eliminate risk—it transfers or mitigates it.
How Hedging Works
Suppose a wheat farmer is concerned that prices might fall by harvest time. By selling wheat futures now, the farmer locks in a price and ensures predictable income regardless of future market fluctuations. Similarly, an importer concerned about currency appreciation may use forward contracts to secure a fixed exchange rate.
Hedging typically involves taking an offsetting position in a related asset or derivative to counterbalance potential losses. If the market moves unfavorably in one position, the gain in the hedge offsets the loss, thereby stabilizing overall performance.
Common Hedging Techniques
Forward and Futures Hedging – Locking in prices today for future transactions.
Options Hedging – Purchasing options to protect against downside risk while retaining upside potential.
Swap Hedging – Managing exposure to interest rates or currency fluctuations.
Portfolio Diversification – Spreading investments across asset classes to reduce overall volatility.
Hedging, in short, is about stability and foresight—it prioritizes security over speculative gain.
Derivatives as the Engine of Hedging
The relationship between derivatives and hedging is symbiotic. Derivatives enable hedging strategies, providing the mechanism to offset risk exposure across markets. Without derivatives, hedging would be limited to traditional methods like asset diversification or insurance, which are often slower, less efficient, and more costly.
For instance:
Commodity producers use futures and options to stabilize revenues.
Exporters and importers hedge against foreign exchange risks through currency forwards and swaps.
Investors protect portfolios from market downturns using index options or equity futures.
Banks manage interest rate risk using interest rate swaps and caps.
This interplay creates a more stable financial ecosystem—when used prudently. Derivatives make markets more liquid and efficient, allowing participants to distribute risk where it can best be managed.
The Power and Peril: When Derivatives Overwhelm Hedging
While derivatives are powerful risk management tools, their misuse can amplify market instability. The same leverage that makes them effective hedging instruments can also turn them into speculative weapons.
Historical Examples of Misuse
Barings Bank Collapse (1995)
A single trader, Nick Leeson, made unauthorized derivatives trades in the Singapore futures market, resulting in losses exceeding £800 million. His speculation, disguised as hedging, bankrupted one of Britain’s oldest banks.
Long-Term Capital Management (LTCM) Crisis (1998)
LTCM used highly leveraged derivative positions to exploit small market inefficiencies. When markets turned volatile, the fund’s positions spiraled out of control, threatening the global financial system.
Global Financial Crisis (2008)
The widespread use of credit default swaps (CDS) on mortgage-backed securities created massive systemic risk. What began as a hedging tool evolved into a speculative bubble, culminating in a global meltdown.
These cases highlight that derivatives without proper risk control can undermine financial stability. The thin line between hedging and speculation defines whether derivatives act as a shield or a sword.
Corporate Hedging Strategies: Real-World Applications
Corporations across sectors rely heavily on derivative-based hedging to protect against market uncertainties.
1. Currency Risk Management
Multinational corporations face constant foreign exchange volatility. For instance, Infosys and Tata Consultancy Services (TCS) use currency forwards and options to manage rupee-dollar exchange rate exposure. These hedges protect profit margins despite currency fluctuations.
2. Commodity Price Protection
Oil producers, airlines, and food companies frequently hedge input costs. Southwest Airlines, for example, famously used long-term crude oil futures to secure low fuel prices during the 2000s, giving it a massive competitive advantage.
3. Interest Rate Risk Control
Financial institutions use interest rate swaps to stabilize returns. A bank holding floating-rate loans may enter into a swap to receive fixed payments, shielding itself from rising rates.
4. Portfolio Risk Hedging
Institutional investors employ derivatives like put options on stock indices to guard against market downturns. These hedges act as “insurance policies” for portfolios, especially during economic uncertainty.
In these scenarios, derivatives serve as precision tools that allow corporations to forecast and control financial outcomes.
Regulatory Oversight and Risk Management
Given the complexity and potential risks, global regulators have tightened oversight of derivatives markets. The Dodd-Frank Act (2010) in the United States and similar regulations in Europe and Asia mandate greater transparency and reporting for derivative trades.
Key Regulatory Measures:
Central Clearing: Standardized derivatives must pass through clearinghouses to reduce counterparty risk.
Reporting Requirements: All trades must be recorded in trade repositories to improve market transparency.
Margin Requirements: Participants must post collateral to prevent excessive leverage.
Risk Management Standards: Firms must establish internal controls and limits on derivative exposures.
These measures aim to restore balance—allowing derivatives to support hedging rather than fuel speculation.
Technological Influence: Algorithmic and AI-Driven Hedging
In the digital era, technology has revolutionized derivative trading and hedging strategies. Algorithmic models and artificial intelligence (AI) now play key roles in managing risk dynamically.
AI-Based Risk Prediction: Machine learning models analyze real-time market data to anticipate price movements and adjust hedges instantly.
Automated Hedging Systems: Advanced algorithms execute complex hedging strategies across multiple asset classes simultaneously.
Blockchain and Smart Contracts: These technologies enhance transparency and efficiency in derivative settlements.
Such innovations have made hedging more precise, faster, and cost-effective—but also more dependent on data integrity and cybersecurity.
The Strategic Balance: Hedging vs. Speculation
The power play between derivatives and hedging ultimately lies in their dual nature. The same instrument can serve either purpose—risk mitigation or risk creation—depending on how it’s used.
Hedging Focus: The objective is protection. Gains are secondary; stability is paramount.
Speculative Focus: The objective is profit. Risk-taking is intentional, often amplified by leverage.
A mature financial system depends on equilibrium between these forces. Without hedgers, markets would lack stability. Without speculators, liquidity would vanish. Together, they form a dynamic yet delicate ecosystem that drives modern finance.
Future Outlook: Evolving Role of Derivatives and Hedging
As global markets grow more interconnected and digitalized, the role of derivatives and hedging will continue to expand.
Green Derivatives: Instruments linked to carbon credits and ESG benchmarks are emerging, helping companies hedge sustainability risks.
Crypto Derivatives: With digital assets gaining traction, crypto futures and options are reshaping speculative and hedging opportunities.
AI-Driven Risk Management: Predictive analytics will make hedging more adaptive to real-time market conditions.
Decentralized Finance (DeFi): Blockchain-based derivative platforms are redefining transparency and access.
The future promises both efficiency and complexity—requiring even stronger governance and risk literacy.
Conclusion
The power play between derivatives and hedging defines the heartbeat of modern finance. Derivatives, with their vast potential, empower investors and corporations to manage risk, enhance returns, and navigate uncertainty. Hedging, on the other hand, channels this power responsibly, ensuring stability amid volatility. Yet, when derivatives shift from tools of protection to instruments of speculation, the balance of power tilts dangerously.
Ultimately, the key lies not in choosing between derivatives and hedging, but in mastering their synergy. When wielded wisely, they create a resilient, efficient, and innovative financial system capable of weathering the storms of global uncertainty.
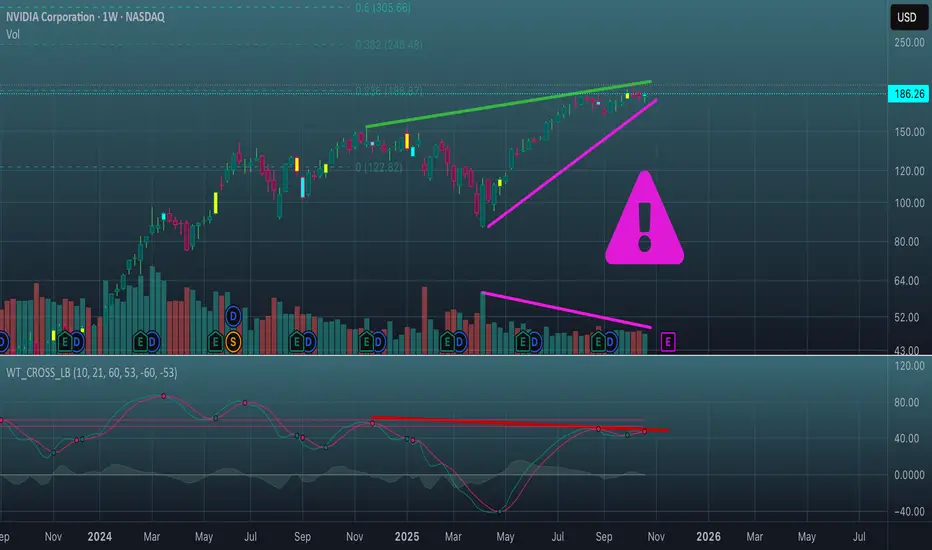
NVDA Climbs to Record Levels as Elliott Wave (5) UnfoldsNvidia (NVDA) continues its impulsive cycle from the April 2025 low, manifesting a clear five-wave advance. The stock now progresses through the terminal wave ((5)), which subdivides into a nested five-wave structure of lesser degree. The advance originated at the wave ((4)) low of $164.07, where wave (1) rallied to $195.62. A subsequent correction in wave (2) concluded at $176.18, as evidenced by the 30-minute chart. From this point, wave (3) resumed the upward trajectory.
Within wave (3), wave 1 terminated at $185.20, followed by a retracement in wave 2 to $176.76. The rally then accelerated in wave 3. From the wave 2 low, wave ((i)) completed at $195.47, and wave ((ii)) found support at $191.91. The structure projects further extension in wave ((iii)), followed by a consolidation in wave ((iv)) before the final push in wave ((v)) of 3. This internal progression supports a series of higher highs, continuing until wave (5) of ((5)) reaches completion and concludes the cycle from April 2025.
Near-term support remains firmly established at the $176.18 pivot low. As long as this level holds, any corrective dips—typically unfolding in three, seven, or eleven swings—should attract buyers and set the stage for additional upside. The overall impulsive framework remains intact, with bullish momentum driving the advance in accordance with Elliott Wave principles.

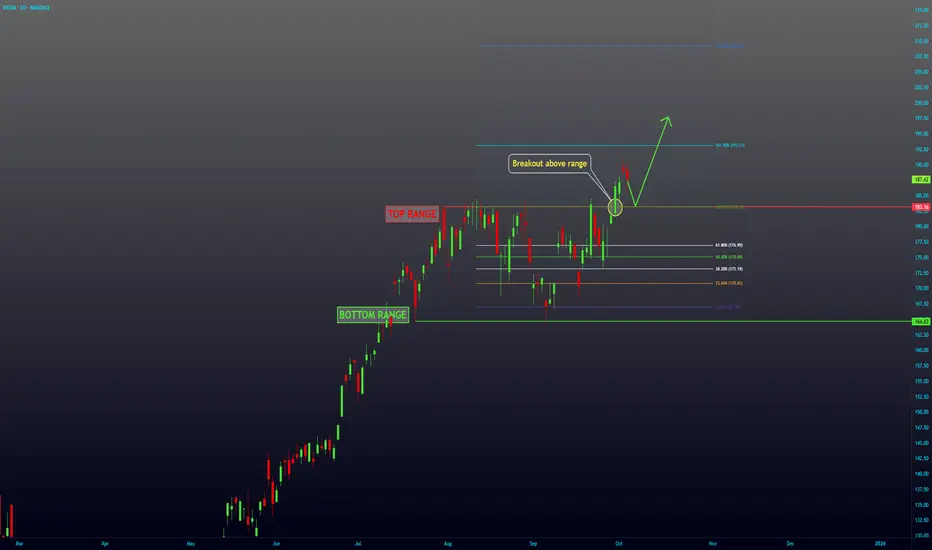
NVDA Breakout -- Continuation UPNASDAQ:NVDA has been in a range since end of July until September 30th, where it broke above the range. I expect to see more upside from here.
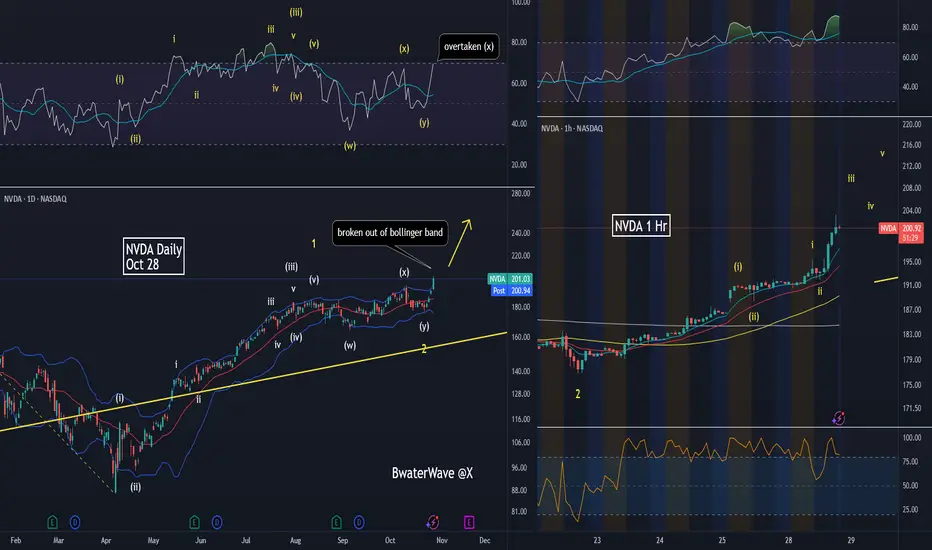
NVDA wave 3 in progressNASDAQ:NVDA just started the most powerful wave 3 of (3):
1. RSI confirms it.
2. Today's daily candle falls outside the Bollinger band and closes on top range.
3. Intraday 1 Hour shows we are still very early in this wave 3.
Please give my idea a boost and feel free to follow me if you like my ideas.
$NVDA | Fib Expansion Points to $212.81 → Is the AI Supercycle JWaverVanir International LLC | Weekly Fibonacci Roadmap
📅 June 25, 2025 | +7.27% Day | Post-Stock Split Momentum
NVIDIA ( NASDAQ:NVDA ) continues to dominate the AI-driven tech rally. After reclaiming the 1.618 Fibonacci level ($128.35), price has broken above the 0.886 retracement ($146.72) and is now pressing higher with bullish volume.
🧠 Fibonacci Insights:
🔺 1.786 Fib Extension: $207.76
🎯 Primary Target: $212.81 (Golden Projection)
🚀 Long-term Fib targets extend into $250–290+ zone (2.618–3.0 extensions)
🔻 Red trendline below signals well-respected diagonal support since early 2023
📊 Price Outlook:
Current Price: $154.31
Short-term Path: Bullish breakout → $168.21 → $178.43
Next Major Resistance: $212.81
Support to Hold: $139.93 / $128.35 (previous Fib clusters)
🧩 Catalysts Ahead:
Q2 Earnings (Late August 2025) – Focus on AI/data center revenue acceleration.
NVIDIA Blackwell GPU shipments – Institutional uptake will confirm pipeline robustness.
AI Sovereign Demand – U.S., UAE, Singapore and Saudi Arabia investing in GPU infrastructure.
AI Arms Race – Competitive moat widening vs. AMD, Intel.
AI App Ecosystem Expansion – Surge in demand for inferencing chips (L4, L40, GB200).
Post-Stock Split Rotation – Retail inflow and fresh institutional allocations.
📌 Summary:
NVIDIA is not just a chipmaker — it’s the core of the modern AI stack. With clear Fibonacci structure and geopolitical tailwinds, the next target is $212.81. Watch dips into $140s for potential reload zones.
🔖 Hashtags:
#NVDA #NVIDIA #AIstocks #WaverVanir #FibExtension #FibonacciTrading #AIboom #BlackwellGPU #GPUpower #PostSplit #TechLeadership #TradingView #SMC #AIarmsrace

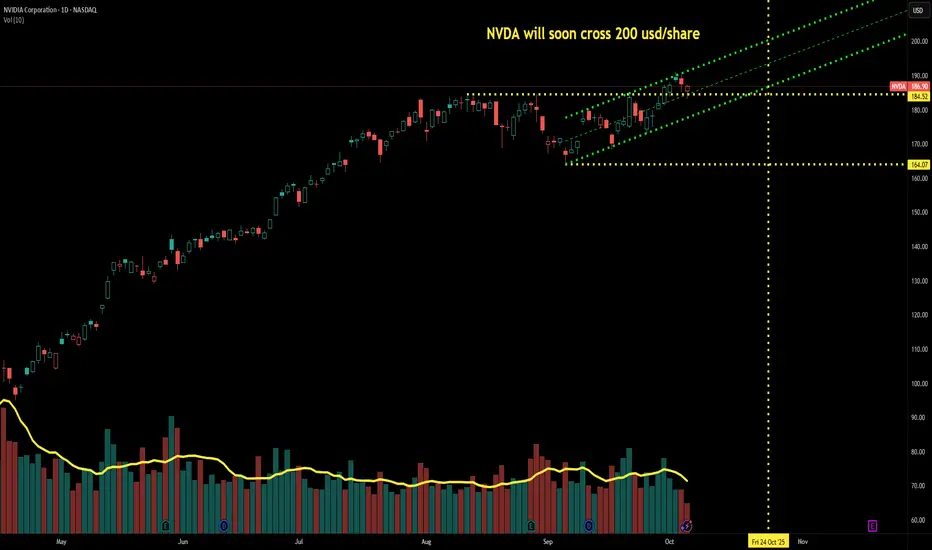
NVDA will pass 200 in the next 3 weeksFinishing the correction,
breaking above resistance,
pullback,
Marching toward the new All Time High
Nvidia Just Under Major SupportNvidia seems to have been pulled down by the Dow just like Apple as both are just under major support. I'm sorry for my previous Nvidia chart that drew support near 140, I recognize where I screwed up, but this chart should be good. Fortunately actual 117 support wasn't that far below and my NVDA isn't too in the red.
NVDA has the lowest revenue multiple in years right now. I know it's well off it's long term trend line, but it's growth rate is unlike anything it's ever been so expecting a steeper trend line to appear makes a lot of sense. Eventually I would imagine we'll get back to that trend line, but not anytime soon.
The Dow hitting major support should finally lift NVDA and the others that have been dragged down like AAPL and AMZN.
Good luck!

NVDA Weekly Outlook (Oct 28–31)NVDA Weekly Outlook (Oct 28–31): “AI Giant Reawakens — Eyes on $200 Breakout!” ⚙️
1. Weekly (1W) Structure – Macro Strength
NVIDIA is maintaining a strong bullish structure on the weekly chart, with multiple Breaks of Structure (BOS) confirming sustained institutional demand. After a temporary Change of Character (CHoCH) in September, price reclaimed momentum above $185 and is now pressing toward the $197–$200 resistance zone.
* Bias: Bullish continuation with trend support at $160–$165
* Support: $152 → $160
* Resistance: $197 → $205
* MACD: Steadily positive, histogram expanding — momentum accelerating.
* Stochastic: Trending upward from mid-range — room to push higher.
💡 Weekly Thought:
The structure suggests NVDA is forming a strong continuation leg, potentially aiming for a retest of $200–$205 if the AI and semiconductor sector continues its leadership rally.
2. Daily (1D) – Mid-Term Momentum
On the daily chart, NVDA broke out from a corrective CHoCH near $164 and reclaimed the ascending trendline. This move confirms bullish re-entry after testing demand around $170–$175. Price is now nearing the upper boundary of the short-term channel, with potential for a breakout continuation toward $197–$200.
* Bias: Bullish, with trend acceleration visible.
* Support: $184 → $176 (key demand zone)
* Resistance: $197 → $200
* Indicators:
* MACD turning back up after reset — confirming bullish continuation.
* Stochastic RSI crossing up from oversold — aligning with buyer momentum.
💭 Daily Suggestion:
Wait for a light pullback to $187–$188 for call entries. If NVDA sustains above $191, expect a grind higher to $197–$200 before month-end.
3. 1-Hour (1H) – Intraday Structure
Intraday structure remains firm. NVDA has printed consecutive BOS patterns with minimal retracements — a hallmark of institutional stepping. The latest CHoCH near $186 acted as a liquidity sweep before pushing higher.
* Scalp Bias: Bullish above $188
* Resistance: $192 → $195 → $197
* Support: $186 → $183
* Setup Idea:
* Call scalp: Above $191 with momentum confirmation; target $195–$197.
* Put scalp: Only valid below $185, targeting $182.
📈 1H Thought:
Short-term traders can trail profits on breakouts above $191. Any dip toward $186–$187 may offer strong long opportunities if momentum remains intact.
4. GEX & Options Sentiment – Institutional Positioning
Gamma Exposure (GEX) shows clear bullish call accumulation with the strongest walls around the $190–$200 range.
* Highest positive GEX / resistance: $191.5 → $197 → $200
* Support (put-dominated zones): $187 → $182 → $176
* Call flow: +27.3% net GEX (call-biased)
* IVR: 25 (low-to-neutral)
* IVx avg: 53.8 (slightly elevated volatility window)
Institutional positioning implies a controlled bullish grind — with gamma pinning around $190–$195 that could later expand to $200 if momentum persists.
5. Suggested Option Plays
* Bullish Setup (Preferred):
* Buy-to-open 190C–195C (1DTE/2DTE) on breakout above $191.
* Target: $197–$200
* Stop: Below $186
* Reason: Call concentration above 190 supports continuation move.
* Bearish Hedge:
* Buy 180P (1DTE/2DTE) only if NVDA breaks $185 with volume.
* Target: $177
* Stop: Above $190
NVIDIA’s structure is aligned bullishly across all timeframes — higher lows, consistent BOS patterns, and call-heavy gamma flow all suggest momentum continuation toward $197–$200 before potential consolidation.
Short-term traders can look to scalp the $191–$195 zone with calls, while swing traders can hold positions into the breakout channel’s upper range.
🎯 Primary Bias: Bullish toward $200
⚠️ Watch For: Failing to hold $185 = short-term weakness or sideways phase.
This analysis is for educational purposes only and does not constitute financial advice. Always do your own research and manage your risk before trading.
Nvidia Downside. No clue. Upside levels to hit Break out here Above $191.83 ^ 193.03 ^195.67 Downside. I don't have a clue. You wonder, can it stay bullish forever? Seasonality might play a role also. The fair value GAP Thanks to ICT. That the price Range that occupies right now. that is in. Needs to. break above that. And the fib top. For play, but that's for sure sign. I guarantee IT To run out the highs. No reason for me to think otherwise. NASDAQ, S&P Keep walking up the steps. Mark IT DOWN smoky. This is risky, I know, but ICT might even play it to the downside. At this point, if it cannot break out191.64 This technique was all designed for playing futures NQ & ES And forex But he taught me it can be used on everything Algorithmics 101manipulation 101 also.#NVDA2THEMOON

Recovery is needed.Damn, the picture looks like a carbon copy TSLA.
There may be a few more sideways candles,
but the overall picture points to a correction.
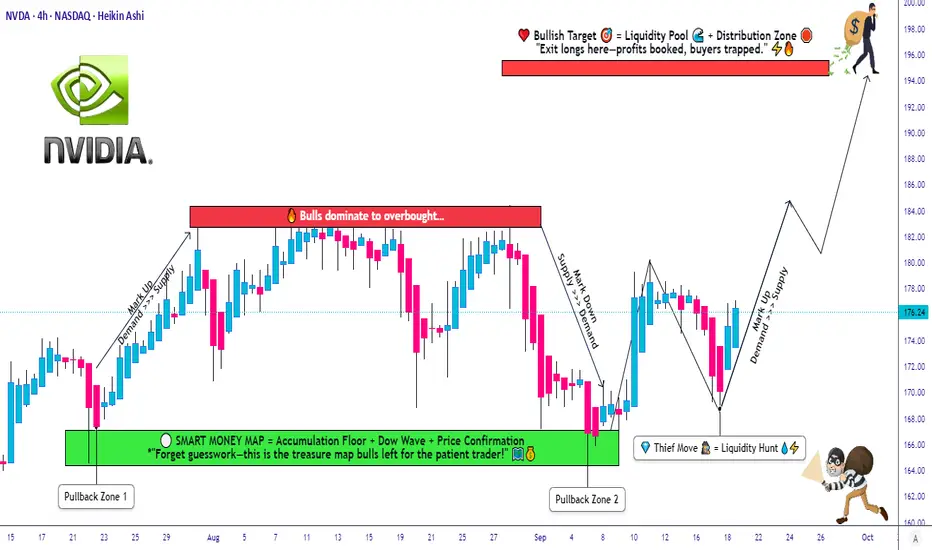
NVDA Setup Explained: Layered Entry + Clear SL/TP Levels😎 NVDA Thief’s Wealth Heist: Swing/Day Trade Blueprint 🚀
Asset: NVIDIA Corporation (NVDA) 📈Vibe: Bullish, sneaky, and ready to snatch profits with style! 💰
Welcome, ladies and gentlemen, to the Thief’s OG Wealth Strategy Map for NVDA!
This is a fun swing/day trading plan designed to grab liquidity like a master thief. Let’s break down this bullish setup with a double bottom pullback, layered entries, and a cheeky escape plan. Ready to outsmart the market? 🕵️♂️
📊 Market Analysis: Why NVDA?
NVDA is riding a bullish wave 🌊, confirmed by a double bottom pullback pattern and a sneaky liquidity grab at key support levels. The stock’s momentum is screaming “UP!” as buyers step in to defend the price. This setup is perfect for swing or day traders looking to capitalize on NVIDIA’s tech-fueled surge. 💻
🗺️ The Thief’s Plan: Bullish Heist Strategy
🎯 Entry Strategy:Deploy the Thief’s Layering Tactic with multiple buy limit orders to maximize your entry precision.
Suggested price levels:
$172.00
$174.00
$176.00
$178.00
Pro Tip: Feel free to add more layers based on your risk appetite and market conditions. The more, the merrier! 🧑💼
🛑 Stop Loss (SL):Set a Thief’s SL at $168.00 to protect your loot.
Note: Dear Thief OGs, this SL is my suggestion, but you’re the boss of your trades! Adjust based on your risk tolerance and let the profits roll. 💸
🎉 Take Profit (TP):Aim for the juicy $195.00 target, where we expect strong resistance, potential overbought conditions, and a possible trap for the unprepared. Lock in those hard-earned gains and escape like a pro! 🏃♂️
Note: This TP is my call, but you do you! Take profits at your own pace and keep the cash flowin’. 😎
🔗 Related Pairs to Watch (in USD)
To boost your market awareness, keep an eye on these correlated assets:
NASDAQ:AMD (Advanced Micro Devices): NVDA’s chipmaking cousin often moves in tandem. A bullish NVDA could signal strength in AMD. 📡
NASDAQ:SMH (VanEck Semiconductor ETF): This ETF tracks the semiconductor sector, including NVDA. Watch for sector-wide momentum. 📊
NASDAQ:QQQ (Invesco QQQ Trust): NVDA’s a heavy hitter in this tech-heavy ETF. QQQ’s trend can confirm NVDA’s direction. 🚀
Key Correlation Point: NVDA’s performance is tied to the broader semiconductor and tech sector. If AMD or SMH shows bullish patterns, it reinforces NVDA’s upside potential. Conversely, weakness in QQQ could signal caution. Stay sharp, thieves! 🕵️
🛠️ Why This Setup Rocks
Double Bottom Pullback: A textbook bullish reversal pattern, signaling strong buying interest. 📉➡️📈
Liquidity Grab: The market’s attempt to shake out weak hands before the real move up. We’re smarter than that! 😏
Layered Entries: Spread your risk across multiple price levels for a smoother ride. 🎢
Risk Management: Clear SL and TP levels keep your heist disciplined and profitable. 🧠
⚠️ Disclaimer
This Thief Style Trading Strategy is just for fun and educational purposes! I’m not a financial advisor, and trading involves risks. Make your own decisions, manage your risk, and trade responsibly. Let’s keep the vibes high and the losses low! 😜
✨ “If you find value in my analysis, a 👍 and 🚀 boost is much appreciated — it helps me share more setups with the community!”
#NVIDIA #NVDA #Trading #SwingTrading #DayTrading #ThiefStrategy #StockMarket #Bullish #TechnicalAnalysis
Oliver Kell's price cycle. longterm 50dmaOliver Kell is a legend swing trader and I thought his price cycle concept makes a lot of sense. I would intuitively use 50dma cycle for price swings. His concept give depth to an idea.
Longterm for less variance outcomes.
#GoldenCross #DeathCross.

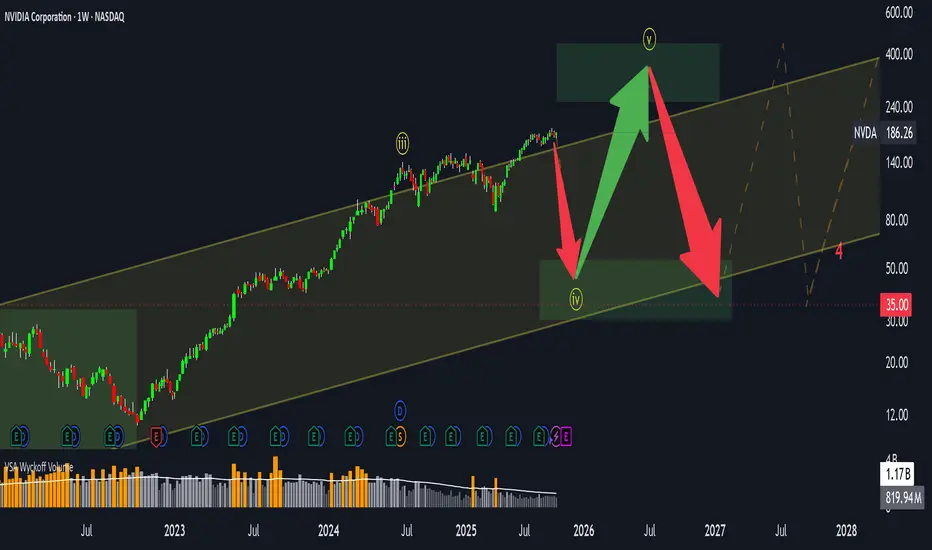
Elliott Waves Don’t Lie: NVDA’s Path to $26,000Summary: “Elliott Waves, Fibonacci, and Smart Money align perfectly — NVIDIA’s long-term chart points to an AI-powered Supercycle with massive upside." 💎📊
🚀 NVDA | The Supercycle of the AI Era! 💚
🌀 Elliott Wave Supercycle Breakdown
NVIDIA’s price action over the past two decades is a textbook example of a multi-decade Elliott Wave Supercycle — where technical , fundamentals , and Smart Money flows perfectly align to form a once-in-a-generation structure 🌎
Let’s break it down step-by-step 👇
Super Cycle Wave (1) — launched in the early 2000s, marking NVDA’s first growth phase during the birth of consumer GPUs 🎮.
Super Cycle Wave (2) — deep correction into 2002, retracing a 0.786 Fibonacci, cleansing early euphoria and creating the foundation for institutional accumulation 💼.
Then began the Super Cycle Wave (3) — the most powerful phase of all. Within it, we have distinct macro sub-waves:
1️⃣ Macro Wave (1) — ended in 2007 , aligning with the first institutional wave of adoption.
2️⃣ Macro Wave (2) — retraced 0.618 in 2008 , coinciding with the global financial crisis (perfect Smart Money shakeout).
3️⃣ Macro Wave (3) — the current dominant leg, fueled by exponential AI and data center growth . It’s extending toward the 3.618 Fibonacci extension (~$256) , confirming wave strength and institutional conviction.
4️⃣ Macro Wave (4) — expected between 2026–2027, likely retracing 0.236–0.382, a natural cooling period before the next breakout.
5️⃣ Macro Wave (5) — projected to rally toward 4.618 extension (~$2,500) , completing Super Cycle Wave (3) near 2029 🏁
From there, a larger Super Cycle Wave (4) correction could unfold before the final parabolic Super Cycle Wave (5) run to the 5.618 Fibonacci extension (~$26,000) — the climax of NVDA’s decades-long AI expansion super-trend 🌕
💰 Smart Money Concept (SMC) Perspective
The chart structure clearly shows Smart Money accumulation patterns in every correction phase:
Re-accumulation ranges appeared at every 0.618 retracement level 📊
Liquidity grabs below previous swing lows before strong impulsive moves ⚡
Fair Value Gaps (FVGs) filled during corrections, creating perfect liquidity imbalances that institutional players exploit
Currently, NVDA trades near a premium zone of Macro Wave (3), but Smart Money will likely reaccumulate during the upcoming Macro Wave (4) discount phase (2026–2027).
Expect Order Block re-tests and liquidity sweeps around discounted Fibonacci retracement zones (0.236–0.382) before the next major rally 📉➡️📈
📈 Price Action Structure
NVDA’s macro structure remains strongly bullish:
The multi-decade trend has respected every higher high and higher low sequence since 2008.
Each impulse is followed by a healthy re-accumulation range, never breaking long-term structure.
Expect distribution near the $250–$300 (split-adjusted) region as Wave (3) matures, followed by a macro correction that offers generational entries for long-term investors 🧠
🔢 Fibonacci Confluence & Technical Harmony
Fibonacci has been the invisible hand guiding NVDA’s growth 👇
0.786 retracement (2002) → deep liquidity reset
0.618 retracement (2008) → institutional re-entry
3.618 extension (256) → current macro resistance target
4.618 extension (2500) → Super Cycle Wave (3) final target
5.618 extension (26K) → ultimate Super Cycle Wave (5) projection
Each impulse and retracement aligns perfectly with Fibonacci’s geometric rhythm , proving the power of confluence between time, price, and sentiment.
🧠 Fundamentals — The Energy Behind the Waves
Behind the technicals lies unmatched fundamental growth :
💾 AI & Data Centers: NVIDIA is the core infrastructure for modern AI compute and cloud training workloads.
🧩 CUDA Ecosystem: A software moat that ties developers and enterprises directly to NVIDIA’s architecture.
🌐 Omniverse & Robotics: Positioning NVDA as a leader in 3D simulation, robotics, and digital twins — future trillion-dollar markets.
⚙️ Strategic Partnerships: Expanding across hyperscalers, automotives, and enterprise AI.
Each innovation wave fuels a new Elliott Wave impulse , with the AI revolution now driving the strongest macro leg in NVDA’s history.
⚡ Macro Outlook & Timeline
✅ Now (2025): Completing Macro Wave (3) of Super Cycle (3) → heading toward $256 target
⚠️ 2026–2027: Macro Wave (4) correction to 0.236–0.382 (Smart Money entry)
🚀 2028–2029: Macro Wave (5) push → Super Cycle (3) peak near $2,500
🌊 2030–2032: Super Cycle (4) correction — consolidation phase
💎 2035–2040+: Super Cycle (5) → ultimate 5.618 target near $26K
💬 Final Thoughts
"Every correction is a setup for the next expansion. Smart Money buys fear — not euphoria."
NVIDIA is the heartbeat of the AI revolution , the core of data-driven computing , and a living Fibonacci sequence in motion.
As long as fundamentals stay aligned with the wave rhythm, NVDA’s Supercycle will continue to redefine what’s possible in long-term growth. 🌌
#NVDA #ElliottWaveAnalysis #SmartMoneyConcept #PriceActionTrading #FibonacciMagic #AIRevolution #StockMarket #Investing #TradingViewCommunity #TechSupercycle #NVDAtoTheMoon #LongTermInvesting
💬 Traders, analysts, and wave watchers — your insights matter!
Have you spotted NVDA’s next move? Drop your Elliott Wave counts, confirmations, or constructive critiques below 👇 Let’s discuss NVIDIA’s structural evolution, AI-driven Supercycle, and long-term growth potential together 🚀💚
Every comment adds perspective — let’s decode this massive wave as a community! 🌊📈
— Team FIBCOS ⚡💎

NVIDIA (NVDA): Where Are We in the Cycle?Ticker: NVDA
Category: Market Structure / Elliott Wave Analysis
Author’s note: Educational analysis — not financial advice.
🧠 Market Context
NVIDIA has been one of the strongest growth stories in the last market cycle. However, after such a powerful move, many traders are now asking: Where are we in the broader structure — and what could come next?
From a structural perspective, NVDA appears to have completed its third Elliott Wave, with the fourth wave currently in progress. This phase often reflects a period of consolidation, where the market digests previous gains before potentially starting the fifth wave.
📊 Elliott Wave Structure
Through the lens of Elliott Wave theory:
Wave 3 — likely completed after the parabolic advance that marked NVIDIA’s latest all-time highs.
Wave 4 — a corrective phase, potentially forming a sideways or slightly downward structure.
Wave 5 (ahead?) — may still occur, possibly extending above the upper boundary of the current price channel.
However, once the fifth wave completes, markets typically enter a longer consolidation or corrective phase — often retracing 50–60% of the total move from the highs.
⚙️ Volatility and Price Range
Currently, NVDA is trading within a broad channel, roughly between $100 and $400+.
Volatility remains elevated — which suggests that the sideways phase could persist for several months, or even longer.
Such behavior is common in late-cycle stages when large market participants distribute part of their holdings while retail interest remains high.
📈 Key Takeaways
The main impulsive move seems to have already played out.
The market may enter a range-bound or sideways phase, with local rallies still possible.
Correction risks are gradually increasing, especially if the fifth wave develops and fails to sustain new highs.
In short, this might not be the best time to chase — but rather to observe how price behaves within the current channel.
💬 Final Thoughts
This analysis is purely educational and reflects one possible scenario based on market structure.
No one can predict the exact timing or depth of the next move — the market always decides.
👉 What do you think?
Are we already in the correction phase, or is there still one more leg up left for NVDA?
Share your view in the comments below 👇
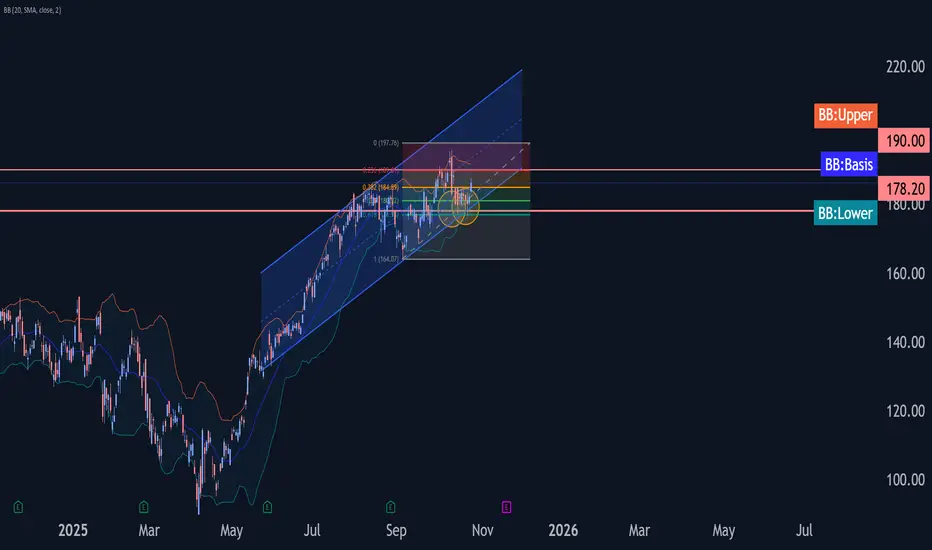
Nvidia Wave Analysis – 24 October 2025- Nvidia reversed from support zone
- Likely to rise to resistance level 190.00
Nvidia recently reversed up from the support zone between the key support level 178.20 (which stopped the previous minor wave a, as can be seen from the daily Nvidia chart below), support trendline of the daily up channel from May and the 50% Fibonacci correction of the upward impulse from the start of September.
The upward reversal from the support level 178.20 stopped the previous short-term ABC correction ii.
Given the long-term uptrend, Nvidia can be expected to rise to the next resistance level 190.00 (which reversed the price at the start of October).
NVDA Setting Up for a Friday Move: (Oct. 24 Outlook)Will Bulls Reclaim $185 or Fade Back to $177? ⚡
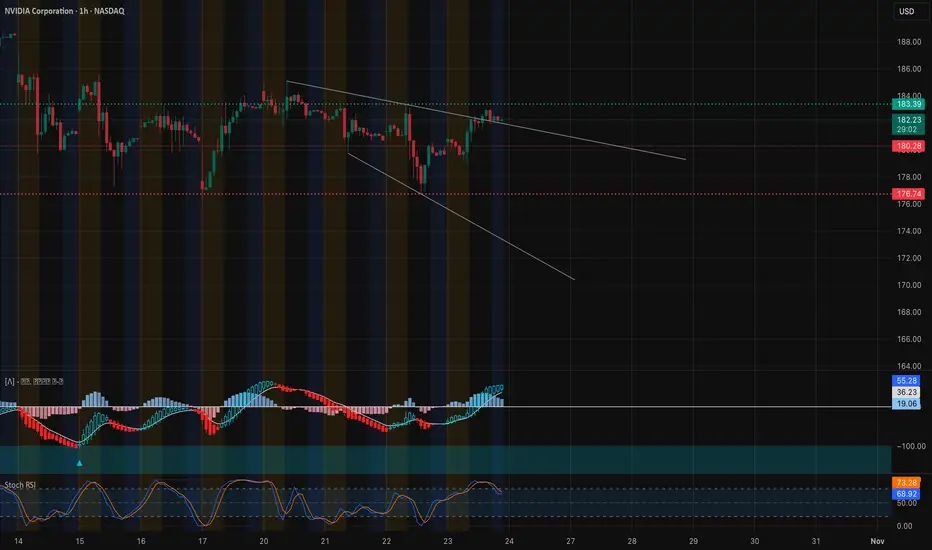
1. Market Structure (1H & 15M)
NVIDIA’s price action has been quietly building a potential bullish reversal structure. On the 1-hour chart, we’ve seen a clear Change of Character (CHoCH) off the $176–$177 demand zone, flipping prior BOS levels and reclaiming short-term control. This suggests smart money likely absorbed liquidity below $175 earlier in the week.
However, NVDA is still trading under a descending trendline from the mid-$180s highs. The latest 1H candle closed right below that resistance — meaning we’re at an inflection point heading into Friday. If bulls break above $183.50–$185, it confirms a structural shift toward higher highs. Failure here could keep NVDA locked in a range-bound corrective channel between $176–$183.
On the 15-minute chart,
we have multiple CHoCH and BOS confirmations in sequence — a bullish sign of internal structure rotation. Still, a recent CHoCH near $182.3 hints at possible profit-taking before the next leg.
2. Supply and Demand / Order Blocks
* Demand Zone (Active Buyer Base): $176.5–$178, which coincides with previous BOS lows and the last high-volume push.
* Short-Term Demand / Fair Value Gap Fill: $179–$180 — this could serve as the first bounce zone on any intraday dip.
* Supply Zone (Distribution Area): $183.5–$185. This is the key test area for bulls; a clean break and retest here could trigger acceleration toward $188+.
If sellers defend $185 again, expect a pullback toward $180. Momentum above that, however, exposes liquidity pockets up to $190–$192 (visible on the 1-hour gamma chart).
3. Indicator Confluence
* 9 EMA / 21 EMA: On the 15M, both EMAs have crossed bullishly with price still riding above — showing near-term strength. On the 1H, the crossover just occurred, confirming fresh momentum as long as NVDA stays above $180.
* MACD: Positive momentum expanding on the 1H chart, histogram rising with widening separation between signal lines. On 15M, momentum cooled slightly into close, likely just consolidation before next wave.
* RSI: Hovering near 70 on the 1H — strong but not yet overextended. The 15M RSI reset toward 50, providing room for another upside push.
* Volume: A steady increase through the $176–$182 leg suggests accumulation rather than distribution — a constructive sign for continuation.
4. GEX (Gamma Exposure) & Options Sentiment
From the GEX map, $185 is the highest positive gamma and call wall, acting as the main magnet/resistance for Friday (10/24). The HVL (High Volume Line) support sits right around $177.5, which aligns with demand and prior BOS zones.
On the downside, the 2nd and 3rd PUT walls are parked around $175 and $170, suggesting limited downside unless $176 breaks with force. Above $185, gamma positioning thins out — meaning a breakout could accelerate quickly toward $188–$190 as dealers hedge upward.
Current IVR is 16.1, with low implied volatility, and call sentiment at 17.3%, showing conservative bullish flow — not overheated. This is often where short gamma moves start to form if price expands beyond the main gamma wall.
In essence, $177 is the floor, $185 the ceiling, and whoever wins that range likely drives the end-of-week volatility.
5. Trade Scenarios for Friday, Oct. 24
Bullish Setup 🟩
* Entry Zone: $180–$181 on retest or breakout above $183.5
* Targets: $185 → $188 → $190
* Stop-Loss: Below $179
* Confirmation: Price holds above 9 EMA on 15M, MACD histogram stays positive, RSI > 55
Bearish Setup 🟥
* Entry Zone: $183.5–$185 rejection zone
* Targets: $180 → $177 → $175
* Stop-Loss: Above $186.5
* Confirmation: MACD flips red with RSI divergence on 15M, CHoCH back below $180
6. Closing Outlook for Oct. 24 (Friday)
Tomorrow, NVDA sits at a critical pivot. If buyers manage to push through $185 with volume, we could see a short-covering rally toward $188–$190 fueled by dealer hedging and gamma expansion. But if the breakout fails, $180 becomes the battleground for control again — and a break below that reopens the door to $177 and possibly $175.
My personal take: the chart favors bulls slightly, but only if $180 holds firm. Watch for a liquidity sweep below $180 early Friday followed by a rebound — that would be the most high-probability setup for a Friday squeeze into $185+.
🎯 Final Thought:
“NVDA’s coiling under $185 resistance — the next breakout or rejection there decides if Friday ends with a quiet fade or an explosive push toward $190.”
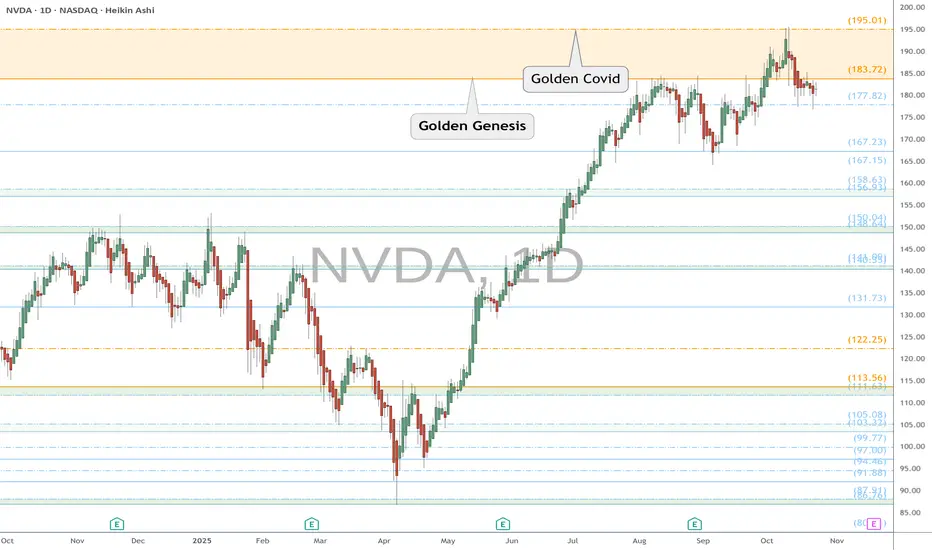
NVDA watch $183-195: Double Golden fib zone trying to TOP itNVDA was flying hard and strong UNTIL recently.
It smacked into DUAL Golden fibs at $183.72 and 195.01
Thus a "high gravity" zone that was likely to capture price.
IF there is to be TOP anywhere near here, then THIS is it.
If NOT, then it will be a key CheckPoint before continuation.
Looking for a few orbits or consolidation within before escape.
.
See "Related Publications" for other Golden Fib reactions.
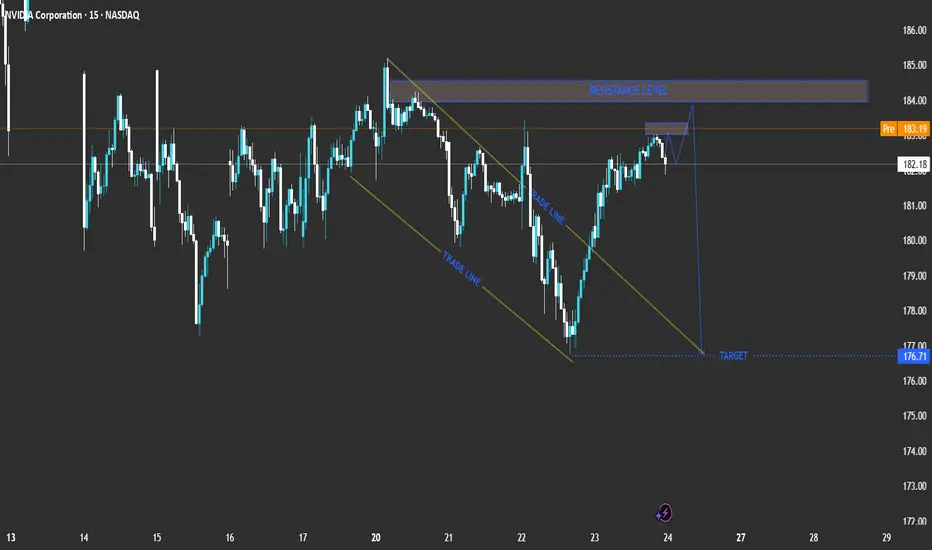
r NVIDIA Corporation (NVDA) based on your chart:Current Price: 182.18
Pre-Market Price: 183.21
Trend: Short-term bullish recovery inside a broader corrective phase.
Technical Breakdown
Descending Channel (Trade Line)
NVDA recently traded inside a downward-sloping channel, showing controlled selling pressure.
The breakout above the upper trade line suggests a short-term bullish correction phase.
Resistance Zone
A strong resistance level lies between 183.00 and 184.00.
This zone aligns with previous highs and may act as a reversal area if the price fails to break above it.
Expected Move
The chart projection shows a potential rejection near the resistance level, followed by a pullback towards the 176.71 target area.
This indicates that the current upward move might be corrective before another bearish swing.
Trade Scenarios
📉 Bearish Reversal Scenario (Primary Setup)
Entry Zone: 183.00 – 184.00 (resistance area)
Confirmation: Bearish rejection candlestick pattern or a failed breakout.
Target: 176.71
Stop Loss: Above 184.50
Comment: Ideal short setup if price rejects resistance.
📈 Bullish Breakout Scenario (Alternative)
Entry: Above 184.50 with strong bullish momentum.
Target: 186.50 – 187.00
Comment: A breakout and hold above resistance would invalidate the short setup and indicate further upside.
Summary Table
Bias Key Level Confirmation Target Notes
Bearish (Primary) 183 – 184 Rejection candle 176.71 Short setup
Bullish (Alternative) Above 184.50 Breakout candle 186.5 – 187 Upside continuation
Conclusion
NVIDIA (NVDA) is approaching a crucial resistance level. The most probable scenario is a bearish reversal from the 183–184 zone, targeting 176.71. However, a confirmed breakout above 184.50 would signal bullish continuation toward 187.00. NASDAQ:PLTR NASDAQ:AMD NASDAQ:AMZN NASDAQ:AAPL NASDAQ:TSLA OMXCOP:BAVA OMXCOP:GN OMXCOP:DNORD OMXCOP:TRMD_A OMXCOP:MAERSK_B OMXCOP:NKT OMXCOP:PNDORA OMXCOP:NSIS_B OMXCOP:DSV OMXCOP:ORSTED OMXCOP:GMAB
Regional Growth Strategies in the Global MarketIntroduction
In today’s interconnected and competitive global economy, companies no longer limit themselves to their domestic markets. They pursue expansion into multiple regions to tap new consumer bases, access resources, reduce costs, and diversify risk. However, global expansion is not a one-size-fits-all process. Each region presents unique economic conditions, cultural nuances, regulatory systems, and consumer preferences. Hence, the concept of regional growth strategies has become vital — it focuses on tailoring global business operations to fit the specific dynamics of different geographic regions.
Regional growth strategies in the global market are structured plans that multinational corporations (MNCs) and emerging firms employ to achieve sustainable expansion, build competitive advantage, and secure long-term profitability in target regions. These strategies are influenced by several factors such as regional trade blocs, demographic trends, technology adoption, government policies, and local market behavior.
1. Understanding Regional Growth Strategies
A regional growth strategy refers to a business plan that integrates global objectives with localized approaches. It involves identifying and prioritizing high-potential regions, customizing products and marketing to suit local needs, and establishing operations or partnerships to gain a competitive edge. Companies use these strategies to adapt their business model to regional conditions while maintaining global consistency.
For instance:
McDonald’s adjusts its menu to suit local tastes — vegetarian options in India, teriyaki burgers in Japan, and halal-certified meat in Middle Eastern countries.
Apple Inc. tailors pricing and distribution strategies differently in North America, Europe, and Asia-Pacific regions due to varying consumer behavior and income levels.
Regional growth strategies allow global firms to balance global efficiency (standardization for cost savings) with local responsiveness (adaptation to local markets), a key principle in international business theory.
2. Importance of Regional Strategies in the Global Market
Globalization has made regional growth strategies more important than ever. Some key reasons include:
Economic Diversification:
Companies avoid dependence on a single market by spreading their operations across regions. Economic slowdowns in one area can be offset by growth in another.
Access to Emerging Markets:
Emerging economies such as India, Brazil, Indonesia, and Vietnam have become growth hubs. Regional strategies enable firms to target these areas with customized offerings.
Cultural and Consumer Adaptation:
Understanding local culture, traditions, and consumer psychology improves brand acceptance and customer loyalty.
Regulatory Compliance:
Different regions have varying legal frameworks and trade barriers. Regional planning ensures compliance and smooth market entry.
Supply Chain Optimization:
Locating production or sourcing closer to key markets helps reduce costs, manage risks, and improve operational efficiency.
Strategic Alliances and Regional Clusters:
Regional partnerships and innovation clusters (like Silicon Valley in the US or Shenzhen in China) help firms leverage local expertise and networks.
In essence, regional strategies are crucial for aligning business operations with the realities of global diversity.
3. Types of Regional Growth Strategies
Companies use several strategic models depending on their goals, industry, and market maturity. Below are some common types:
a. Market Penetration Strategy
This involves increasing the firm’s share in existing regional markets through aggressive marketing, competitive pricing, or improved distribution. It focuses on strengthening brand visibility and consumer loyalty.
b. Market Development Strategy
Here, firms enter new regional markets with existing products. For instance, a European apparel brand might expand to Latin America, adapting its offerings slightly to suit local preferences.
c. Product Localization Strategy
To succeed regionally, firms often customize products or services for local audiences. This can include language adaptation, design modifications, or even creating region-specific versions of products.
d. Strategic Alliances and Joint Ventures
Collaborating with regional partners provides access to local knowledge, regulatory support, and established customer bases. Toyota’s joint venture with China’s FAW Group is a notable example.
e. Regional Manufacturing and Supply Chain Strategy
Setting up production centers within or near target regions reduces logistical challenges, tariffs, and currency risks. Many technology companies have established hubs in Southeast Asia for this reason.
f. Mergers and Acquisitions (M&A)
Acquiring local firms allows quick entry and immediate access to established operations. For example, Walmart’s acquisition of Flipkart in India provided a strong foothold in the Indian e-commerce market.
g. Digital and E-commerce Expansion
Firms are increasingly using digital channels to reach regional markets cost-effectively. E-commerce platforms enable global brands to operate regionally without physical infrastructure.
4. Key Regional Growth Models Across Continents
1. North America
The North American market, led by the United States, offers advanced infrastructure, high consumer spending, and a stable regulatory environment. Companies focus on innovation-driven growth, brand differentiation, and digital transformation. For example, Tesla’s regional strategy involves expanding production across multiple states and developing localized supply chains for electric vehicles.
2. Europe
Europe is a complex but lucrative region due to the European Union’s single market framework. Regional strategies here emphasize sustainability, compliance with EU standards, and cultural diversity management. Many firms adopt green technologies and ethical business practices to align with European consumer values.
3. Asia-Pacific
Asia-Pacific (APAC) is the fastest-growing region globally. Its diverse economies — China, India, Japan, South Korea, and ASEAN nations — present both opportunities and challenges. Strategies here focus on mass customization, digital-first marketing, and regional production hubs. For instance, Samsung and Huawei leverage regional R&D centers to innovate products tailored for Asian consumers.
4. Latin America
Latin America’s regional strategy revolves around price-sensitive consumers, economic volatility, and political uncertainty. Firms often adopt localized pricing, distribution through regional partners, and community-based marketing to gain traction.
5. Middle East and Africa (MEA)
The MEA region offers vast opportunities due to its growing youth population, digital adoption, and natural resource wealth. However, it also poses regulatory and infrastructural challenges. Successful regional strategies here include partnerships with local conglomerates, adapting to religious and cultural norms, and investing in sustainable infrastructure.
5. Regional Trade Blocs and Their Strategic Impact
Trade agreements and economic blocs shape regional growth strategies significantly. Some key examples include:
European Union (EU): Facilitates tariff-free trade and uniform regulations across member countries, encouraging firms to set up pan-European operations.
North American Free Trade Agreement (NAFTA) (now USMCA): Promotes trade between the US, Canada, and Mexico, encouraging integrated manufacturing and cross-border supply chains.
Association of Southeast Asian Nations (ASEAN): Provides access to a large consumer market with reduced trade barriers.
Mercosur (South America): Enhances trade cooperation among Argentina, Brazil, Paraguay, and Uruguay.
African Continental Free Trade Area (AfCFTA): Aims to create a unified African market, attracting global investors.
Companies strategically align their regional operations to take advantage of these trade frameworks, optimizing cost structures and supply chain efficiency.
6. Challenges in Implementing Regional Growth Strategies
While regional expansion offers significant opportunities, it also presents challenges that businesses must manage carefully:
Regulatory Complexity:
Each region has its own legal requirements, taxation rules, and trade policies. Navigating these can be time-consuming and costly.
Cultural Barriers:
Misunderstanding local customs, values, or communication styles can lead to marketing failures and brand rejection.
Political Instability:
Regions with political volatility or weak governance pose risks to investment and operations.
Economic Inequality:
Income disparities within and across regions affect pricing strategies and product positioning.
Competition from Local Firms:
Domestic companies often understand the market better and can respond faster to changes.
Supply Chain Disruptions:
Global crises (like the COVID-19 pandemic) highlight the vulnerability of extended supply chains and the need for regional diversification.
7. Strategies for Successful Regional Growth
To ensure sustainable success, firms should follow structured approaches:
Market Research and Data Analytics:
Understanding regional demographics, purchasing patterns, and competitor behavior is crucial before entry.
Localization and Cultural Sensitivity:
Customizing marketing, communication, and product offerings to suit local tastes builds trust and engagement.
Strategic Partnerships:
Collaborating with regional firms, distributors, or technology partners enhances market penetration.
Agile Operations:
Adopting flexible supply chains and decentralized decision-making allows quick adaptation to local market shifts.
Talent and Leadership Development:
Hiring local management teams familiar with the regional context improves responsiveness.
Digital Transformation:
Leveraging digital tools, e-commerce, and regional analytics helps firms engage customers efficiently.
Sustainability and CSR Integration:
Consumers increasingly prefer brands that demonstrate responsibility toward regional communities and the environment.
8. Case Studies of Regional Growth Success
Coca-Cola
Coca-Cola’s success lies in its ability to think globally but act locally. The company customizes flavors, packaging, and advertising campaigns to reflect local cultures. For instance, in Japan, Coca-Cola offers unique beverages such as green tea and coffee blends under regional sub-brands.
Unilever
Unilever’s regional strategy combines global brand consistency with local product innovation. It invests heavily in emerging markets like India and Indonesia by offering affordable product sizes suited for lower-income groups while maintaining sustainability goals.
Toyota
Toyota uses a regional production model, setting up manufacturing hubs in key markets to serve local demand efficiently. Its “Kaizen” philosophy of continuous improvement is applied globally but adapted regionally to meet workforce and cultural variations.
Netflix
Netflix’s regional growth strategy focuses on content localization. By producing region-specific shows in local languages (like “Money Heist” in Spain or “Sacred Games” in India), it successfully appeals to diverse audiences worldwide.
9. The Future of Regional Growth Strategies
The future of regional strategies will be shaped by three key trends:
Digital and AI Integration:
Artificial intelligence will help companies analyze regional markets in real-time, personalize offerings, and automate regional operations.
Sustainability Focus:
Green technologies and responsible supply chains will be central to regional competitiveness.
Geopolitical Realignments:
Shifts in trade policies and alliances will redefine regional partnerships and market priorities.
Companies that can blend technology, sustainability, and local adaptation will dominate the next wave of global expansion.
Conclusion
Regional growth strategies are the foundation of successful global business expansion. They allow companies to bridge the gap between global ambition and local reality. By understanding regional markets, respecting cultural differences, and leveraging trade opportunities, firms can create value both for themselves and the communities they serve.
In the dynamic global marketplace, the most successful companies are those that master the art of local responsiveness within global integration. Regional strategies thus serve as the cornerstone of a truly globalized yet locally connected enterprise model — the essence of 21st-century business success.

$NVDA - $215 Near Term TargetNvidia Stock is setting up what appears to be a bull flag. Watch for an imminent break out of its descending wedge flag for a measured move to $215. Remember, the flag pole equaling the measured extension move from the breakout.
